Free Statistics

of Irreproducible Research!

Author's title

Author*The author of this computation has been verified*
R Software Modulerwasp_multipleregression.wasp
Title produced by softwareMultiple Regression
Date of computationTue, 16 Dec 2008 13:57:35 -0700
Cite this page as followsStatistical Computations at FreeStatistics.org, Office for Research Development and Education, URL https://freestatistics.org/blog/index.php?v=date/2008/Dec/16/t122946113367uz1n369aeiil5.htm/, Retrieved Wed, 15 May 2024 10:30:53 +0000
Statistical Computations at FreeStatistics.org, Office for Research Development and Education, URL https://freestatistics.org/blog/index.php?pk=34199, Retrieved Wed, 15 May 2024 10:30:53 +0000
QR Codes:

Original text written by user:
IsPrivate?No (this computation is public)
User-defined keywords
Estimated Impact148
Family? (F = Feedback message, R = changed R code, M = changed R Module, P = changed Parameters, D = changed Data)
-       [Multiple Regression] [Paper H4 Mannen M...] [2008-12-16 20:57:35] [5e9e099b83e50415d7642e10d74756e4] [Current]
Feedback Forum

Post a new message
Dataseries X:
269645	0
267037	0
258113	0
262813	0
267413	0
267366	0
264777	0
258863	0
254844	0
254868	0
277267	0
285351	0
286602	0
283042	0
276687	0
277915	0
277128	0
277103	0
275037	0
270150	0
267140	0
264993	0
287259	0
291186	0
292300	0
288186	0
281477	0
282656	1
280190	1
280408	1
276836	1
275216	1
274352	1
271311	1
289802	1
290726	1
292300	1
278506	1
269826	1
265861	1
269034	1
264176	1
255198	1
253353	1
246057	1
235372	1
258556	1
260993	1
254663	1
250643	1
243422	1
247105	1
248541	1
245039	1
237080	1
237085	1
225554	1
226839	1
247934	1
248333	1
246969	1
245098	1
246263	1


Summary of computational transaction
Raw Inputview raw input (R code)
Raw Outputview raw output of R engine
Computing time7 seconds
R Server'Sir Ronald Aylmer Fisher' @ 193.190.124.24

\begin{tabular}{lllllllll}
\hline
Summary of computational transaction \tabularnewline
Raw Input & view raw input (R code)  \tabularnewline
Raw Output & view raw output of R engine  \tabularnewline
Computing time & 7 seconds \tabularnewline
R Server & 'Sir Ronald Aylmer Fisher' @ 193.190.124.24 \tabularnewline
\hline
\end{tabular}
%Source: https://freestatistics.org/blog/index.php?pk=34199&T=0

[TABLE]
[ROW][C]Summary of computational transaction[/C][/ROW]
[ROW][C]Raw Input[/C][C]view raw input (R code) [/C][/ROW]
[ROW][C]Raw Output[/C][C]view raw output of R engine [/C][/ROW]
[ROW][C]Computing time[/C][C]7 seconds[/C][/ROW]
[ROW][C]R Server[/C][C]'Sir Ronald Aylmer Fisher' @ 193.190.124.24[/C][/ROW]
[/TABLE]
Source: https://freestatistics.org/blog/index.php?pk=34199&T=0

Globally Unique Identifier (entire table): ba.freestatistics.org/blog/index.php?pk=34199&T=0

As an alternative you can also use a QR Code:  

The GUIDs for individual cells are displayed in the table below:

Summary of computational transaction
Raw Inputview raw input (R code)
Raw Outputview raw output of R engine
Computing time7 seconds
R Server'Sir Ronald Aylmer Fisher' @ 193.190.124.24


Multiple Linear Regression - Estimated Regression Equation
Mannen[t] = + 283911.545098039 -14322.908496732Dummy[t] -3003.59084967328M1[t] -7998.0908496732M2[t] -14118.7575163399M3[t] -8047.8M4[t] -6856.6M5[t] -8499.4M6[t] -13532.2M7[t] -16384.4M8[t] -21728.4M9[t] -24641.2M10[t] -3154.2M11[t] + e[t]

\begin{tabular}{lllllllll}
\hline
Multiple Linear Regression - Estimated Regression Equation \tabularnewline
Mannen[t] =  +  283911.545098039 -14322.908496732Dummy[t] -3003.59084967328M1[t] -7998.0908496732M2[t] -14118.7575163399M3[t] -8047.8M4[t] -6856.6M5[t] -8499.4M6[t] -13532.2M7[t] -16384.4M8[t] -21728.4M9[t] -24641.2M10[t] -3154.2M11[t]  + e[t] \tabularnewline
\hline
\end{tabular}
%Source: https://freestatistics.org/blog/index.php?pk=34199&T=1

[TABLE]
[ROW][C]Multiple Linear Regression - Estimated Regression Equation[/C][/ROW]
[ROW][C]Mannen[t] =  +  283911.545098039 -14322.908496732Dummy[t] -3003.59084967328M1[t] -7998.0908496732M2[t] -14118.7575163399M3[t] -8047.8M4[t] -6856.6M5[t] -8499.4M6[t] -13532.2M7[t] -16384.4M8[t] -21728.4M9[t] -24641.2M10[t] -3154.2M11[t]  + e[t][/C][/ROW]
[/TABLE]
Source: https://freestatistics.org/blog/index.php?pk=34199&T=1

Globally Unique Identifier (entire table): ba.freestatistics.org/blog/index.php?pk=34199&T=1

As an alternative you can also use a QR Code:  

The GUIDs for individual cells are displayed in the table below:

Multiple Linear Regression - Estimated Regression Equation
Mannen[t] = + 283911.545098039 -14322.908496732Dummy[t] -3003.59084967328M1[t] -7998.0908496732M2[t] -14118.7575163399M3[t] -8047.8M4[t] -6856.6M5[t] -8499.4M6[t] -13532.2M7[t] -16384.4M8[t] -21728.4M9[t] -24641.2M10[t] -3154.2M11[t] + e[t]


Multiple Linear Regression - Ordinary Least Squares
VariableParameterS.D.T-STATH0: parameter = 02-tail p-value1-tail p-value
(Intercept)283911.5450980397182.1417839.530200
Dummy-14322.9084967323883.657487-3.6880.0005570.000279
M1-3003.590849673289206.80784-0.32620.7456080.372804
M2-7998.09084967329206.80784-0.86870.3891540.194577
M3-14118.75751633999206.80784-1.53350.1314530.065727
M4-8047.89607.638021-0.83760.4062160.203108
M5-6856.69607.638021-0.71370.4787550.239377
M6-8499.49607.638021-0.88470.380580.19029
M7-13532.29607.638021-1.40850.1651760.082588
M8-16384.49607.638021-1.70540.0943350.047168
M9-21728.49607.638021-2.26160.0281050.014052
M10-24641.29607.638021-2.56480.0133740.006687
M11-3154.29607.638021-0.32830.7440550.372027

\begin{tabular}{lllllllll}
\hline
Multiple Linear Regression - Ordinary Least Squares \tabularnewline
Variable & Parameter & S.D. & T-STATH0: parameter = 0 & 2-tail p-value & 1-tail p-value \tabularnewline
(Intercept) & 283911.545098039 & 7182.14178 & 39.5302 & 0 & 0 \tabularnewline
Dummy & -14322.908496732 & 3883.657487 & -3.688 & 0.000557 & 0.000279 \tabularnewline
M1 & -3003.59084967328 & 9206.80784 & -0.3262 & 0.745608 & 0.372804 \tabularnewline
M2 & -7998.0908496732 & 9206.80784 & -0.8687 & 0.389154 & 0.194577 \tabularnewline
M3 & -14118.7575163399 & 9206.80784 & -1.5335 & 0.131453 & 0.065727 \tabularnewline
M4 & -8047.8 & 9607.638021 & -0.8376 & 0.406216 & 0.203108 \tabularnewline
M5 & -6856.6 & 9607.638021 & -0.7137 & 0.478755 & 0.239377 \tabularnewline
M6 & -8499.4 & 9607.638021 & -0.8847 & 0.38058 & 0.19029 \tabularnewline
M7 & -13532.2 & 9607.638021 & -1.4085 & 0.165176 & 0.082588 \tabularnewline
M8 & -16384.4 & 9607.638021 & -1.7054 & 0.094335 & 0.047168 \tabularnewline
M9 & -21728.4 & 9607.638021 & -2.2616 & 0.028105 & 0.014052 \tabularnewline
M10 & -24641.2 & 9607.638021 & -2.5648 & 0.013374 & 0.006687 \tabularnewline
M11 & -3154.2 & 9607.638021 & -0.3283 & 0.744055 & 0.372027 \tabularnewline
\hline
\end{tabular}
%Source: https://freestatistics.org/blog/index.php?pk=34199&T=2

[TABLE]
[ROW][C]Multiple Linear Regression - Ordinary Least Squares[/C][/ROW]
[ROW][C]Variable[/C][C]Parameter[/C][C]S.D.[/C][C]T-STATH0: parameter = 0[/C][C]2-tail p-value[/C][C]1-tail p-value[/C][/ROW]
[ROW][C](Intercept)[/C][C]283911.545098039[/C][C]7182.14178[/C][C]39.5302[/C][C]0[/C][C]0[/C][/ROW]
[ROW][C]Dummy[/C][C]-14322.908496732[/C][C]3883.657487[/C][C]-3.688[/C][C]0.000557[/C][C]0.000279[/C][/ROW]
[ROW][C]M1[/C][C]-3003.59084967328[/C][C]9206.80784[/C][C]-0.3262[/C][C]0.745608[/C][C]0.372804[/C][/ROW]
[ROW][C]M2[/C][C]-7998.0908496732[/C][C]9206.80784[/C][C]-0.8687[/C][C]0.389154[/C][C]0.194577[/C][/ROW]
[ROW][C]M3[/C][C]-14118.7575163399[/C][C]9206.80784[/C][C]-1.5335[/C][C]0.131453[/C][C]0.065727[/C][/ROW]
[ROW][C]M4[/C][C]-8047.8[/C][C]9607.638021[/C][C]-0.8376[/C][C]0.406216[/C][C]0.203108[/C][/ROW]
[ROW][C]M5[/C][C]-6856.6[/C][C]9607.638021[/C][C]-0.7137[/C][C]0.478755[/C][C]0.239377[/C][/ROW]
[ROW][C]M6[/C][C]-8499.4[/C][C]9607.638021[/C][C]-0.8847[/C][C]0.38058[/C][C]0.19029[/C][/ROW]
[ROW][C]M7[/C][C]-13532.2[/C][C]9607.638021[/C][C]-1.4085[/C][C]0.165176[/C][C]0.082588[/C][/ROW]
[ROW][C]M8[/C][C]-16384.4[/C][C]9607.638021[/C][C]-1.7054[/C][C]0.094335[/C][C]0.047168[/C][/ROW]
[ROW][C]M9[/C][C]-21728.4[/C][C]9607.638021[/C][C]-2.2616[/C][C]0.028105[/C][C]0.014052[/C][/ROW]
[ROW][C]M10[/C][C]-24641.2[/C][C]9607.638021[/C][C]-2.5648[/C][C]0.013374[/C][C]0.006687[/C][/ROW]
[ROW][C]M11[/C][C]-3154.2[/C][C]9607.638021[/C][C]-0.3283[/C][C]0.744055[/C][C]0.372027[/C][/ROW]
[/TABLE]
Source: https://freestatistics.org/blog/index.php?pk=34199&T=2

Globally Unique Identifier (entire table): ba.freestatistics.org/blog/index.php?pk=34199&T=2

As an alternative you can also use a QR Code:  

The GUIDs for individual cells are displayed in the table below:

Multiple Linear Regression - Ordinary Least Squares
VariableParameterS.D.T-STATH0: parameter = 02-tail p-value1-tail p-value
(Intercept)283911.5450980397182.1417839.530200
Dummy-14322.9084967323883.657487-3.6880.0005570.000279
M1-3003.590849673289206.80784-0.32620.7456080.372804
M2-7998.09084967329206.80784-0.86870.3891540.194577
M3-14118.75751633999206.80784-1.53350.1314530.065727
M4-8047.89607.638021-0.83760.4062160.203108
M5-6856.69607.638021-0.71370.4787550.239377
M6-8499.49607.638021-0.88470.380580.19029
M7-13532.29607.638021-1.40850.1651760.082588
M8-16384.49607.638021-1.70540.0943350.047168
M9-21728.49607.638021-2.26160.0281050.014052
M10-24641.29607.638021-2.56480.0133740.006687
M11-3154.29607.638021-0.32830.7440550.372027


Multiple Linear Regression - Regression Statistics
Multiple R0.600803894705908
R-squared0.360965319893787
Adjusted R-squared0.207596996668296
F-TEST (value)2.35358457536942
F-TEST (DF numerator)12
F-TEST (DF denominator)50
p-value0.0173900451783193
Multiple Linear Regression - Residual Statistics
Residual Standard Deviation15191.0095399912
Sum Squared Residuals11538338542.2052

\begin{tabular}{lllllllll}
\hline
Multiple Linear Regression - Regression Statistics \tabularnewline
Multiple R & 0.600803894705908 \tabularnewline
R-squared & 0.360965319893787 \tabularnewline
Adjusted R-squared & 0.207596996668296 \tabularnewline
F-TEST (value) & 2.35358457536942 \tabularnewline
F-TEST (DF numerator) & 12 \tabularnewline
F-TEST (DF denominator) & 50 \tabularnewline
p-value & 0.0173900451783193 \tabularnewline
Multiple Linear Regression - Residual Statistics \tabularnewline
Residual Standard Deviation & 15191.0095399912 \tabularnewline
Sum Squared Residuals & 11538338542.2052 \tabularnewline
\hline
\end{tabular}
%Source: https://freestatistics.org/blog/index.php?pk=34199&T=3

[TABLE]
[ROW][C]Multiple Linear Regression - Regression Statistics[/C][/ROW]
[ROW][C]Multiple R[/C][C]0.600803894705908[/C][/ROW]
[ROW][C]R-squared[/C][C]0.360965319893787[/C][/ROW]
[ROW][C]Adjusted R-squared[/C][C]0.207596996668296[/C][/ROW]
[ROW][C]F-TEST (value)[/C][C]2.35358457536942[/C][/ROW]
[ROW][C]F-TEST (DF numerator)[/C][C]12[/C][/ROW]
[ROW][C]F-TEST (DF denominator)[/C][C]50[/C][/ROW]
[ROW][C]p-value[/C][C]0.0173900451783193[/C][/ROW]
[ROW][C]Multiple Linear Regression - Residual Statistics[/C][/ROW]
[ROW][C]Residual Standard Deviation[/C][C]15191.0095399912[/C][/ROW]
[ROW][C]Sum Squared Residuals[/C][C]11538338542.2052[/C][/ROW]
[/TABLE]
Source: https://freestatistics.org/blog/index.php?pk=34199&T=3

Globally Unique Identifier (entire table): ba.freestatistics.org/blog/index.php?pk=34199&T=3

As an alternative you can also use a QR Code:  

The GUIDs for individual cells are displayed in the table below:

Multiple Linear Regression - Regression Statistics
Multiple R0.600803894705908
R-squared0.360965319893787
Adjusted R-squared0.207596996668296
F-TEST (value)2.35358457536942
F-TEST (DF numerator)12
F-TEST (DF denominator)50
p-value0.0173900451783193
Multiple Linear Regression - Residual Statistics
Residual Standard Deviation15191.0095399912
Sum Squared Residuals11538338542.2052


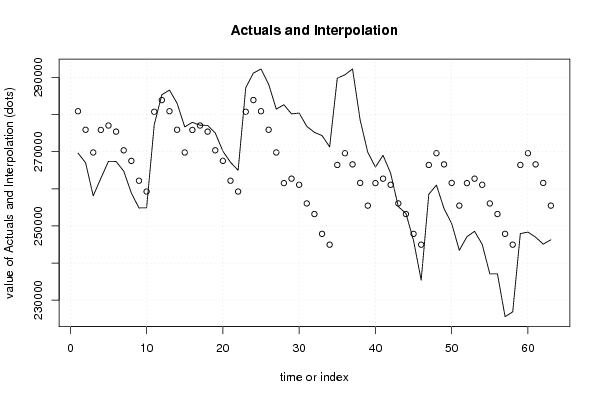
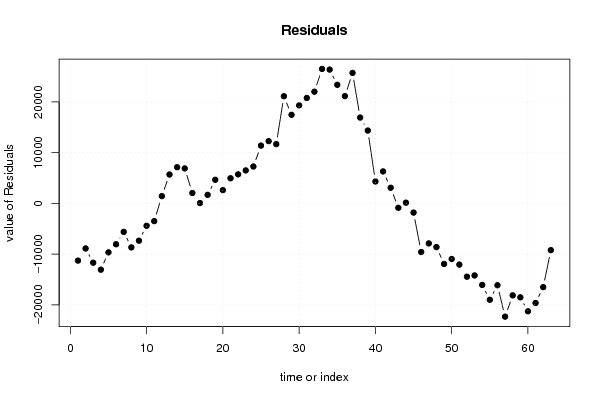
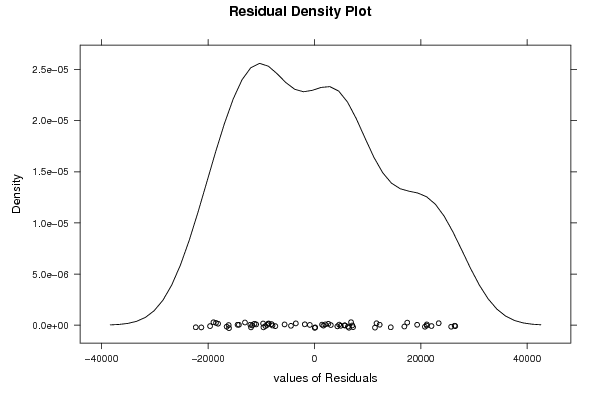
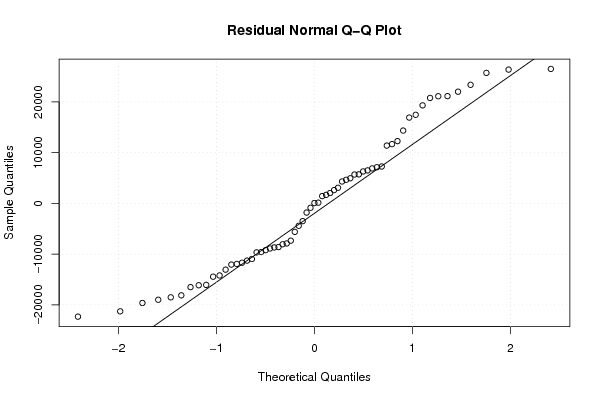
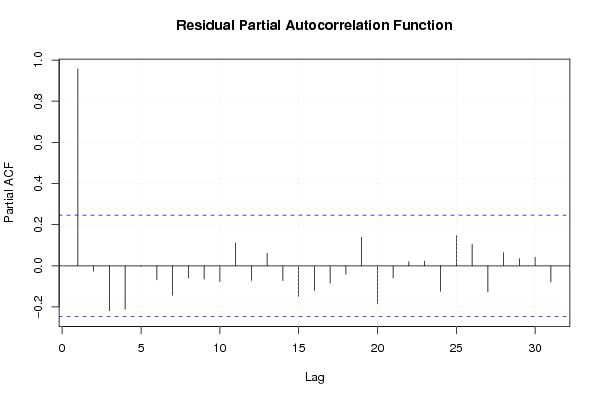
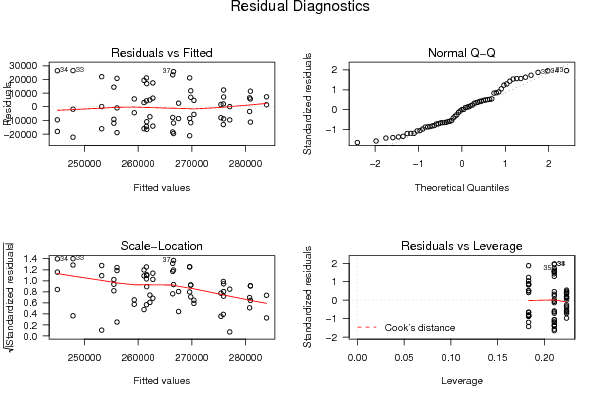
Multiple Linear Regression - Actuals, Interpolation, and Residuals
Time or IndexActualsInterpolationForecastResidualsPrediction Error
1269645280907.954248366-11262.9542483664
2267037275913.454248366-8876.454248366
3258113269792.787581699-11679.7875816993
4262813275863.745098039-13050.7450980392
5267413277054.945098039-9641.9450980392
6267366275412.145098039-8046.1450980392
7264777270379.345098039-5602.34509803921
8258863267527.145098039-8664.14509803921
9254844262183.145098039-7339.14509803921
10254868259270.345098039-4402.3450980392
11277267280757.345098039-3490.34509803921
12285351283911.5450980391439.45490196080
13286602280907.9542483665694.04575163408
14283042275913.4542483667128.545751634
15276687269792.7875816996894.21241830066
16277915275863.7450980392051.25490196079
17277128277054.94509803973.0549019607964
18277103275412.1450980391690.85490196079
19275037270379.3450980394657.6549019608
20270150267527.1450980392622.85490196080
21267140262183.1450980394956.85490196079
22264993259270.3450980395722.6549019608
23287259280757.3450980396501.65490196079
24291186283911.5450980397274.4549019608
25292300280907.95424836611392.0457516341
26288186275913.45424836612272.545751634
27281477269792.78758169911684.2124183007
28282656261540.83660130721115.1633986928
29280190262732.03660130717457.9633986928
30280408261089.23660130719318.7633986928
31276836256056.43660130720779.5633986928
32275216253204.23660130722011.7633986928
33274352247860.23660130726491.7633986928
34271311244947.43660130726363.5633986928
35289802266434.43660130723367.5633986928
36290726269588.63660130721137.3633986928
37292300266585.04575163425714.9542483661
38278506261590.54575163416915.454248366
39269826255469.87908496714356.1209150327
40265861261540.8366013074320.1633986928
41269034262732.0366013076301.9633986928
42264176261089.2366013073086.7633986928
43255198256056.436601307-858.436601307196
44253353253204.236601307148.763398692804
45246057247860.236601307-1803.2366013072
46235372244947.436601307-9575.4366013072
47258556266434.436601307-7878.4366013072
48260993269588.636601307-8595.6366013072
49254663266585.045751634-11922.0457516339
50250643261590.545751634-10947.545751634
51243422255469.879084967-12047.8790849673
52247105261540.836601307-14435.8366013072
53248541262732.036601307-14191.0366013072
54245039261089.236601307-16050.2366013072
55237080256056.436601307-18976.4366013072
56237085253204.236601307-16119.2366013072
57225554247860.236601307-22306.2366013072
58226839244947.436601307-18108.4366013072
59247934266434.436601307-18500.4366013072
60248333269588.636601307-21255.6366013072
61246969266585.045751634-19616.0457516339
62245098261590.545751634-16492.545751634
63246263255469.879084967-9206.87908496733

\begin{tabular}{lllllllll}
\hline
Multiple Linear Regression - Actuals, Interpolation, and Residuals \tabularnewline
Time or Index & Actuals & InterpolationForecast & ResidualsPrediction Error \tabularnewline
1 & 269645 & 280907.954248366 & -11262.9542483664 \tabularnewline
2 & 267037 & 275913.454248366 & -8876.454248366 \tabularnewline
3 & 258113 & 269792.787581699 & -11679.7875816993 \tabularnewline
4 & 262813 & 275863.745098039 & -13050.7450980392 \tabularnewline
5 & 267413 & 277054.945098039 & -9641.9450980392 \tabularnewline
6 & 267366 & 275412.145098039 & -8046.1450980392 \tabularnewline
7 & 264777 & 270379.345098039 & -5602.34509803921 \tabularnewline
8 & 258863 & 267527.145098039 & -8664.14509803921 \tabularnewline
9 & 254844 & 262183.145098039 & -7339.14509803921 \tabularnewline
10 & 254868 & 259270.345098039 & -4402.3450980392 \tabularnewline
11 & 277267 & 280757.345098039 & -3490.34509803921 \tabularnewline
12 & 285351 & 283911.545098039 & 1439.45490196080 \tabularnewline
13 & 286602 & 280907.954248366 & 5694.04575163408 \tabularnewline
14 & 283042 & 275913.454248366 & 7128.545751634 \tabularnewline
15 & 276687 & 269792.787581699 & 6894.21241830066 \tabularnewline
16 & 277915 & 275863.745098039 & 2051.25490196079 \tabularnewline
17 & 277128 & 277054.945098039 & 73.0549019607964 \tabularnewline
18 & 277103 & 275412.145098039 & 1690.85490196079 \tabularnewline
19 & 275037 & 270379.345098039 & 4657.6549019608 \tabularnewline
20 & 270150 & 267527.145098039 & 2622.85490196080 \tabularnewline
21 & 267140 & 262183.145098039 & 4956.85490196079 \tabularnewline
22 & 264993 & 259270.345098039 & 5722.6549019608 \tabularnewline
23 & 287259 & 280757.345098039 & 6501.65490196079 \tabularnewline
24 & 291186 & 283911.545098039 & 7274.4549019608 \tabularnewline
25 & 292300 & 280907.954248366 & 11392.0457516341 \tabularnewline
26 & 288186 & 275913.454248366 & 12272.545751634 \tabularnewline
27 & 281477 & 269792.787581699 & 11684.2124183007 \tabularnewline
28 & 282656 & 261540.836601307 & 21115.1633986928 \tabularnewline
29 & 280190 & 262732.036601307 & 17457.9633986928 \tabularnewline
30 & 280408 & 261089.236601307 & 19318.7633986928 \tabularnewline
31 & 276836 & 256056.436601307 & 20779.5633986928 \tabularnewline
32 & 275216 & 253204.236601307 & 22011.7633986928 \tabularnewline
33 & 274352 & 247860.236601307 & 26491.7633986928 \tabularnewline
34 & 271311 & 244947.436601307 & 26363.5633986928 \tabularnewline
35 & 289802 & 266434.436601307 & 23367.5633986928 \tabularnewline
36 & 290726 & 269588.636601307 & 21137.3633986928 \tabularnewline
37 & 292300 & 266585.045751634 & 25714.9542483661 \tabularnewline
38 & 278506 & 261590.545751634 & 16915.454248366 \tabularnewline
39 & 269826 & 255469.879084967 & 14356.1209150327 \tabularnewline
40 & 265861 & 261540.836601307 & 4320.1633986928 \tabularnewline
41 & 269034 & 262732.036601307 & 6301.9633986928 \tabularnewline
42 & 264176 & 261089.236601307 & 3086.7633986928 \tabularnewline
43 & 255198 & 256056.436601307 & -858.436601307196 \tabularnewline
44 & 253353 & 253204.236601307 & 148.763398692804 \tabularnewline
45 & 246057 & 247860.236601307 & -1803.2366013072 \tabularnewline
46 & 235372 & 244947.436601307 & -9575.4366013072 \tabularnewline
47 & 258556 & 266434.436601307 & -7878.4366013072 \tabularnewline
48 & 260993 & 269588.636601307 & -8595.6366013072 \tabularnewline
49 & 254663 & 266585.045751634 & -11922.0457516339 \tabularnewline
50 & 250643 & 261590.545751634 & -10947.545751634 \tabularnewline
51 & 243422 & 255469.879084967 & -12047.8790849673 \tabularnewline
52 & 247105 & 261540.836601307 & -14435.8366013072 \tabularnewline
53 & 248541 & 262732.036601307 & -14191.0366013072 \tabularnewline
54 & 245039 & 261089.236601307 & -16050.2366013072 \tabularnewline
55 & 237080 & 256056.436601307 & -18976.4366013072 \tabularnewline
56 & 237085 & 253204.236601307 & -16119.2366013072 \tabularnewline
57 & 225554 & 247860.236601307 & -22306.2366013072 \tabularnewline
58 & 226839 & 244947.436601307 & -18108.4366013072 \tabularnewline
59 & 247934 & 266434.436601307 & -18500.4366013072 \tabularnewline
60 & 248333 & 269588.636601307 & -21255.6366013072 \tabularnewline
61 & 246969 & 266585.045751634 & -19616.0457516339 \tabularnewline
62 & 245098 & 261590.545751634 & -16492.545751634 \tabularnewline
63 & 246263 & 255469.879084967 & -9206.87908496733 \tabularnewline
\hline
\end{tabular}
%Source: https://freestatistics.org/blog/index.php?pk=34199&T=4

[TABLE]
[ROW][C]Multiple Linear Regression - Actuals, Interpolation, and Residuals[/C][/ROW]
[ROW][C]Time or Index[/C][C]Actuals[/C][C]InterpolationForecast[/C][C]ResidualsPrediction Error[/C][/ROW]
[ROW][C]1[/C][C]269645[/C][C]280907.954248366[/C][C]-11262.9542483664[/C][/ROW]
[ROW][C]2[/C][C]267037[/C][C]275913.454248366[/C][C]-8876.454248366[/C][/ROW]
[ROW][C]3[/C][C]258113[/C][C]269792.787581699[/C][C]-11679.7875816993[/C][/ROW]
[ROW][C]4[/C][C]262813[/C][C]275863.745098039[/C][C]-13050.7450980392[/C][/ROW]
[ROW][C]5[/C][C]267413[/C][C]277054.945098039[/C][C]-9641.9450980392[/C][/ROW]
[ROW][C]6[/C][C]267366[/C][C]275412.145098039[/C][C]-8046.1450980392[/C][/ROW]
[ROW][C]7[/C][C]264777[/C][C]270379.345098039[/C][C]-5602.34509803921[/C][/ROW]
[ROW][C]8[/C][C]258863[/C][C]267527.145098039[/C][C]-8664.14509803921[/C][/ROW]
[ROW][C]9[/C][C]254844[/C][C]262183.145098039[/C][C]-7339.14509803921[/C][/ROW]
[ROW][C]10[/C][C]254868[/C][C]259270.345098039[/C][C]-4402.3450980392[/C][/ROW]
[ROW][C]11[/C][C]277267[/C][C]280757.345098039[/C][C]-3490.34509803921[/C][/ROW]
[ROW][C]12[/C][C]285351[/C][C]283911.545098039[/C][C]1439.45490196080[/C][/ROW]
[ROW][C]13[/C][C]286602[/C][C]280907.954248366[/C][C]5694.04575163408[/C][/ROW]
[ROW][C]14[/C][C]283042[/C][C]275913.454248366[/C][C]7128.545751634[/C][/ROW]
[ROW][C]15[/C][C]276687[/C][C]269792.787581699[/C][C]6894.21241830066[/C][/ROW]
[ROW][C]16[/C][C]277915[/C][C]275863.745098039[/C][C]2051.25490196079[/C][/ROW]
[ROW][C]17[/C][C]277128[/C][C]277054.945098039[/C][C]73.0549019607964[/C][/ROW]
[ROW][C]18[/C][C]277103[/C][C]275412.145098039[/C][C]1690.85490196079[/C][/ROW]
[ROW][C]19[/C][C]275037[/C][C]270379.345098039[/C][C]4657.6549019608[/C][/ROW]
[ROW][C]20[/C][C]270150[/C][C]267527.145098039[/C][C]2622.85490196080[/C][/ROW]
[ROW][C]21[/C][C]267140[/C][C]262183.145098039[/C][C]4956.85490196079[/C][/ROW]
[ROW][C]22[/C][C]264993[/C][C]259270.345098039[/C][C]5722.6549019608[/C][/ROW]
[ROW][C]23[/C][C]287259[/C][C]280757.345098039[/C][C]6501.65490196079[/C][/ROW]
[ROW][C]24[/C][C]291186[/C][C]283911.545098039[/C][C]7274.4549019608[/C][/ROW]
[ROW][C]25[/C][C]292300[/C][C]280907.954248366[/C][C]11392.0457516341[/C][/ROW]
[ROW][C]26[/C][C]288186[/C][C]275913.454248366[/C][C]12272.545751634[/C][/ROW]
[ROW][C]27[/C][C]281477[/C][C]269792.787581699[/C][C]11684.2124183007[/C][/ROW]
[ROW][C]28[/C][C]282656[/C][C]261540.836601307[/C][C]21115.1633986928[/C][/ROW]
[ROW][C]29[/C][C]280190[/C][C]262732.036601307[/C][C]17457.9633986928[/C][/ROW]
[ROW][C]30[/C][C]280408[/C][C]261089.236601307[/C][C]19318.7633986928[/C][/ROW]
[ROW][C]31[/C][C]276836[/C][C]256056.436601307[/C][C]20779.5633986928[/C][/ROW]
[ROW][C]32[/C][C]275216[/C][C]253204.236601307[/C][C]22011.7633986928[/C][/ROW]
[ROW][C]33[/C][C]274352[/C][C]247860.236601307[/C][C]26491.7633986928[/C][/ROW]
[ROW][C]34[/C][C]271311[/C][C]244947.436601307[/C][C]26363.5633986928[/C][/ROW]
[ROW][C]35[/C][C]289802[/C][C]266434.436601307[/C][C]23367.5633986928[/C][/ROW]
[ROW][C]36[/C][C]290726[/C][C]269588.636601307[/C][C]21137.3633986928[/C][/ROW]
[ROW][C]37[/C][C]292300[/C][C]266585.045751634[/C][C]25714.9542483661[/C][/ROW]
[ROW][C]38[/C][C]278506[/C][C]261590.545751634[/C][C]16915.454248366[/C][/ROW]
[ROW][C]39[/C][C]269826[/C][C]255469.879084967[/C][C]14356.1209150327[/C][/ROW]
[ROW][C]40[/C][C]265861[/C][C]261540.836601307[/C][C]4320.1633986928[/C][/ROW]
[ROW][C]41[/C][C]269034[/C][C]262732.036601307[/C][C]6301.9633986928[/C][/ROW]
[ROW][C]42[/C][C]264176[/C][C]261089.236601307[/C][C]3086.7633986928[/C][/ROW]
[ROW][C]43[/C][C]255198[/C][C]256056.436601307[/C][C]-858.436601307196[/C][/ROW]
[ROW][C]44[/C][C]253353[/C][C]253204.236601307[/C][C]148.763398692804[/C][/ROW]
[ROW][C]45[/C][C]246057[/C][C]247860.236601307[/C][C]-1803.2366013072[/C][/ROW]
[ROW][C]46[/C][C]235372[/C][C]244947.436601307[/C][C]-9575.4366013072[/C][/ROW]
[ROW][C]47[/C][C]258556[/C][C]266434.436601307[/C][C]-7878.4366013072[/C][/ROW]
[ROW][C]48[/C][C]260993[/C][C]269588.636601307[/C][C]-8595.6366013072[/C][/ROW]
[ROW][C]49[/C][C]254663[/C][C]266585.045751634[/C][C]-11922.0457516339[/C][/ROW]
[ROW][C]50[/C][C]250643[/C][C]261590.545751634[/C][C]-10947.545751634[/C][/ROW]
[ROW][C]51[/C][C]243422[/C][C]255469.879084967[/C][C]-12047.8790849673[/C][/ROW]
[ROW][C]52[/C][C]247105[/C][C]261540.836601307[/C][C]-14435.8366013072[/C][/ROW]
[ROW][C]53[/C][C]248541[/C][C]262732.036601307[/C][C]-14191.0366013072[/C][/ROW]
[ROW][C]54[/C][C]245039[/C][C]261089.236601307[/C][C]-16050.2366013072[/C][/ROW]
[ROW][C]55[/C][C]237080[/C][C]256056.436601307[/C][C]-18976.4366013072[/C][/ROW]
[ROW][C]56[/C][C]237085[/C][C]253204.236601307[/C][C]-16119.2366013072[/C][/ROW]
[ROW][C]57[/C][C]225554[/C][C]247860.236601307[/C][C]-22306.2366013072[/C][/ROW]
[ROW][C]58[/C][C]226839[/C][C]244947.436601307[/C][C]-18108.4366013072[/C][/ROW]
[ROW][C]59[/C][C]247934[/C][C]266434.436601307[/C][C]-18500.4366013072[/C][/ROW]
[ROW][C]60[/C][C]248333[/C][C]269588.636601307[/C][C]-21255.6366013072[/C][/ROW]
[ROW][C]61[/C][C]246969[/C][C]266585.045751634[/C][C]-19616.0457516339[/C][/ROW]
[ROW][C]62[/C][C]245098[/C][C]261590.545751634[/C][C]-16492.545751634[/C][/ROW]
[ROW][C]63[/C][C]246263[/C][C]255469.879084967[/C][C]-9206.87908496733[/C][/ROW]
[/TABLE]
Source: https://freestatistics.org/blog/index.php?pk=34199&T=4

Globally Unique Identifier (entire table): ba.freestatistics.org/blog/index.php?pk=34199&T=4

As an alternative you can also use a QR Code:  

The GUIDs for individual cells are displayed in the table below:

Multiple Linear Regression - Actuals, Interpolation, and Residuals
Time or IndexActualsInterpolationForecastResidualsPrediction Error
1269645280907.954248366-11262.9542483664
2267037275913.454248366-8876.454248366
3258113269792.787581699-11679.7875816993
4262813275863.745098039-13050.7450980392
5267413277054.945098039-9641.9450980392
6267366275412.145098039-8046.1450980392
7264777270379.345098039-5602.34509803921
8258863267527.145098039-8664.14509803921
9254844262183.145098039-7339.14509803921
10254868259270.345098039-4402.3450980392
11277267280757.345098039-3490.34509803921
12285351283911.5450980391439.45490196080
13286602280907.9542483665694.04575163408
14283042275913.4542483667128.545751634
15276687269792.7875816996894.21241830066
16277915275863.7450980392051.25490196079
17277128277054.94509803973.0549019607964
18277103275412.1450980391690.85490196079
19275037270379.3450980394657.6549019608
20270150267527.1450980392622.85490196080
21267140262183.1450980394956.85490196079
22264993259270.3450980395722.6549019608
23287259280757.3450980396501.65490196079
24291186283911.5450980397274.4549019608
25292300280907.95424836611392.0457516341
26288186275913.45424836612272.545751634
27281477269792.78758169911684.2124183007
28282656261540.83660130721115.1633986928
29280190262732.03660130717457.9633986928
30280408261089.23660130719318.7633986928
31276836256056.43660130720779.5633986928
32275216253204.23660130722011.7633986928
33274352247860.23660130726491.7633986928
34271311244947.43660130726363.5633986928
35289802266434.43660130723367.5633986928
36290726269588.63660130721137.3633986928
37292300266585.04575163425714.9542483661
38278506261590.54575163416915.454248366
39269826255469.87908496714356.1209150327
40265861261540.8366013074320.1633986928
41269034262732.0366013076301.9633986928
42264176261089.2366013073086.7633986928
43255198256056.436601307-858.436601307196
44253353253204.236601307148.763398692804
45246057247860.236601307-1803.2366013072
46235372244947.436601307-9575.4366013072
47258556266434.436601307-7878.4366013072
48260993269588.636601307-8595.6366013072
49254663266585.045751634-11922.0457516339
50250643261590.545751634-10947.545751634
51243422255469.879084967-12047.8790849673
52247105261540.836601307-14435.8366013072
53248541262732.036601307-14191.0366013072
54245039261089.236601307-16050.2366013072
55237080256056.436601307-18976.4366013072
56237085253204.236601307-16119.2366013072
57225554247860.236601307-22306.2366013072
58226839244947.436601307-18108.4366013072
59247934266434.436601307-18500.4366013072
60248333269588.636601307-21255.6366013072
61246969266585.045751634-19616.0457516339
62245098261590.545751634-16492.545751634
63246263255469.879084967-9206.87908496733


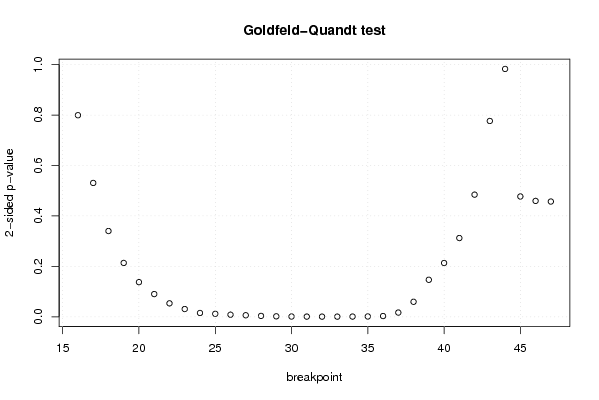
Goldfeld-Quandt test for Heteroskedasticity
p-valuesAlternative Hypothesis
breakpoint indexgreater2-sidedless
160.399566413525110.799132827050220.60043358647489
170.2652611655168030.5305223310336060.734738834483197
180.1699815344686340.3399630689372680.830018465531366
190.1067271852567290.2134543705134580.893272814743271
200.06863994707977820.1372798941595560.931360052920222
210.04500057931428440.09000115862856870.954999420685716
220.02663551986193880.05327103972387760.973364480138061
230.01533599495407220.03067198990814440.984664005045928
240.007491801253532570.01498360250706510.992508198746467
250.005812870626355470.01162574125271090.994187129373645
260.004083367882714880.008166735765429760.995916632117285
270.002995451087193730.005990902174387470.997004548912806
280.001672090760850230.003344181521700470.99832790923915
290.0008716744777808470.001743348955561690.99912832552222
300.0004864481733156880.0009728963466313770.999513551826684
310.0003220593921497950.0006441187842995910.99967794060785
320.0002178038460311810.0004356076920623630.999782196153969
330.0002495188534673910.0004990377069347820.999750481146533
340.0003811572044371830.0007623144088743670.999618842795563
350.0006055137138813620.001211027427762720.999394486286119
360.001431816003559910.002863632007119830.99856818399644
370.008323252938017420.01664650587603480.991676747061983
380.02969994290389460.05939988580778910.970300057096105
390.073297019829620.146594039659240.92670298017038
400.1065861093531670.2131722187063340.893413890646833
410.1560667697926970.3121335395853940.843933230207303
420.2420778518004940.4841557036009880.757922148199506
430.3881392131163770.7762784262327530.611860786883623
440.4912920405317740.9825840810635470.508707959468226
450.7615430568309750.476913886338050.238456943169025
460.7703250011098720.4593499977802570.229674998890128
470.7715685618582520.4568628762834970.228431438141748

\begin{tabular}{lllllllll}
\hline
Goldfeld-Quandt test for Heteroskedasticity \tabularnewline
p-values & Alternative Hypothesis \tabularnewline
breakpoint index & greater & 2-sided & less \tabularnewline
16 & 0.39956641352511 & 0.79913282705022 & 0.60043358647489 \tabularnewline
17 & 0.265261165516803 & 0.530522331033606 & 0.734738834483197 \tabularnewline
18 & 0.169981534468634 & 0.339963068937268 & 0.830018465531366 \tabularnewline
19 & 0.106727185256729 & 0.213454370513458 & 0.893272814743271 \tabularnewline
20 & 0.0686399470797782 & 0.137279894159556 & 0.931360052920222 \tabularnewline
21 & 0.0450005793142844 & 0.0900011586285687 & 0.954999420685716 \tabularnewline
22 & 0.0266355198619388 & 0.0532710397238776 & 0.973364480138061 \tabularnewline
23 & 0.0153359949540722 & 0.0306719899081444 & 0.984664005045928 \tabularnewline
24 & 0.00749180125353257 & 0.0149836025070651 & 0.992508198746467 \tabularnewline
25 & 0.00581287062635547 & 0.0116257412527109 & 0.994187129373645 \tabularnewline
26 & 0.00408336788271488 & 0.00816673576542976 & 0.995916632117285 \tabularnewline
27 & 0.00299545108719373 & 0.00599090217438747 & 0.997004548912806 \tabularnewline
28 & 0.00167209076085023 & 0.00334418152170047 & 0.99832790923915 \tabularnewline
29 & 0.000871674477780847 & 0.00174334895556169 & 0.99912832552222 \tabularnewline
30 & 0.000486448173315688 & 0.000972896346631377 & 0.999513551826684 \tabularnewline
31 & 0.000322059392149795 & 0.000644118784299591 & 0.99967794060785 \tabularnewline
32 & 0.000217803846031181 & 0.000435607692062363 & 0.999782196153969 \tabularnewline
33 & 0.000249518853467391 & 0.000499037706934782 & 0.999750481146533 \tabularnewline
34 & 0.000381157204437183 & 0.000762314408874367 & 0.999618842795563 \tabularnewline
35 & 0.000605513713881362 & 0.00121102742776272 & 0.999394486286119 \tabularnewline
36 & 0.00143181600355991 & 0.00286363200711983 & 0.99856818399644 \tabularnewline
37 & 0.00832325293801742 & 0.0166465058760348 & 0.991676747061983 \tabularnewline
38 & 0.0296999429038946 & 0.0593998858077891 & 0.970300057096105 \tabularnewline
39 & 0.07329701982962 & 0.14659403965924 & 0.92670298017038 \tabularnewline
40 & 0.106586109353167 & 0.213172218706334 & 0.893413890646833 \tabularnewline
41 & 0.156066769792697 & 0.312133539585394 & 0.843933230207303 \tabularnewline
42 & 0.242077851800494 & 0.484155703600988 & 0.757922148199506 \tabularnewline
43 & 0.388139213116377 & 0.776278426232753 & 0.611860786883623 \tabularnewline
44 & 0.491292040531774 & 0.982584081063547 & 0.508707959468226 \tabularnewline
45 & 0.761543056830975 & 0.47691388633805 & 0.238456943169025 \tabularnewline
46 & 0.770325001109872 & 0.459349997780257 & 0.229674998890128 \tabularnewline
47 & 0.771568561858252 & 0.456862876283497 & 0.228431438141748 \tabularnewline
\hline
\end{tabular}
%Source: https://freestatistics.org/blog/index.php?pk=34199&T=5

[TABLE]
[ROW][C]Goldfeld-Quandt test for Heteroskedasticity[/C][/ROW]
[ROW][C]p-values[/C][C]Alternative Hypothesis[/C][/ROW]
[ROW][C]breakpoint index[/C][C]greater[/C][C]2-sided[/C][C]less[/C][/ROW]
[ROW][C]16[/C][C]0.39956641352511[/C][C]0.79913282705022[/C][C]0.60043358647489[/C][/ROW]
[ROW][C]17[/C][C]0.265261165516803[/C][C]0.530522331033606[/C][C]0.734738834483197[/C][/ROW]
[ROW][C]18[/C][C]0.169981534468634[/C][C]0.339963068937268[/C][C]0.830018465531366[/C][/ROW]
[ROW][C]19[/C][C]0.106727185256729[/C][C]0.213454370513458[/C][C]0.893272814743271[/C][/ROW]
[ROW][C]20[/C][C]0.0686399470797782[/C][C]0.137279894159556[/C][C]0.931360052920222[/C][/ROW]
[ROW][C]21[/C][C]0.0450005793142844[/C][C]0.0900011586285687[/C][C]0.954999420685716[/C][/ROW]
[ROW][C]22[/C][C]0.0266355198619388[/C][C]0.0532710397238776[/C][C]0.973364480138061[/C][/ROW]
[ROW][C]23[/C][C]0.0153359949540722[/C][C]0.0306719899081444[/C][C]0.984664005045928[/C][/ROW]
[ROW][C]24[/C][C]0.00749180125353257[/C][C]0.0149836025070651[/C][C]0.992508198746467[/C][/ROW]
[ROW][C]25[/C][C]0.00581287062635547[/C][C]0.0116257412527109[/C][C]0.994187129373645[/C][/ROW]
[ROW][C]26[/C][C]0.00408336788271488[/C][C]0.00816673576542976[/C][C]0.995916632117285[/C][/ROW]
[ROW][C]27[/C][C]0.00299545108719373[/C][C]0.00599090217438747[/C][C]0.997004548912806[/C][/ROW]
[ROW][C]28[/C][C]0.00167209076085023[/C][C]0.00334418152170047[/C][C]0.99832790923915[/C][/ROW]
[ROW][C]29[/C][C]0.000871674477780847[/C][C]0.00174334895556169[/C][C]0.99912832552222[/C][/ROW]
[ROW][C]30[/C][C]0.000486448173315688[/C][C]0.000972896346631377[/C][C]0.999513551826684[/C][/ROW]
[ROW][C]31[/C][C]0.000322059392149795[/C][C]0.000644118784299591[/C][C]0.99967794060785[/C][/ROW]
[ROW][C]32[/C][C]0.000217803846031181[/C][C]0.000435607692062363[/C][C]0.999782196153969[/C][/ROW]
[ROW][C]33[/C][C]0.000249518853467391[/C][C]0.000499037706934782[/C][C]0.999750481146533[/C][/ROW]
[ROW][C]34[/C][C]0.000381157204437183[/C][C]0.000762314408874367[/C][C]0.999618842795563[/C][/ROW]
[ROW][C]35[/C][C]0.000605513713881362[/C][C]0.00121102742776272[/C][C]0.999394486286119[/C][/ROW]
[ROW][C]36[/C][C]0.00143181600355991[/C][C]0.00286363200711983[/C][C]0.99856818399644[/C][/ROW]
[ROW][C]37[/C][C]0.00832325293801742[/C][C]0.0166465058760348[/C][C]0.991676747061983[/C][/ROW]
[ROW][C]38[/C][C]0.0296999429038946[/C][C]0.0593998858077891[/C][C]0.970300057096105[/C][/ROW]
[ROW][C]39[/C][C]0.07329701982962[/C][C]0.14659403965924[/C][C]0.92670298017038[/C][/ROW]
[ROW][C]40[/C][C]0.106586109353167[/C][C]0.213172218706334[/C][C]0.893413890646833[/C][/ROW]
[ROW][C]41[/C][C]0.156066769792697[/C][C]0.312133539585394[/C][C]0.843933230207303[/C][/ROW]
[ROW][C]42[/C][C]0.242077851800494[/C][C]0.484155703600988[/C][C]0.757922148199506[/C][/ROW]
[ROW][C]43[/C][C]0.388139213116377[/C][C]0.776278426232753[/C][C]0.611860786883623[/C][/ROW]
[ROW][C]44[/C][C]0.491292040531774[/C][C]0.982584081063547[/C][C]0.508707959468226[/C][/ROW]
[ROW][C]45[/C][C]0.761543056830975[/C][C]0.47691388633805[/C][C]0.238456943169025[/C][/ROW]
[ROW][C]46[/C][C]0.770325001109872[/C][C]0.459349997780257[/C][C]0.229674998890128[/C][/ROW]
[ROW][C]47[/C][C]0.771568561858252[/C][C]0.456862876283497[/C][C]0.228431438141748[/C][/ROW]
[/TABLE]
Source: https://freestatistics.org/blog/index.php?pk=34199&T=5

Globally Unique Identifier (entire table): ba.freestatistics.org/blog/index.php?pk=34199&T=5

As an alternative you can also use a QR Code:  

The GUIDs for individual cells are displayed in the table below:

Goldfeld-Quandt test for Heteroskedasticity
p-valuesAlternative Hypothesis
breakpoint indexgreater2-sidedless
160.399566413525110.799132827050220.60043358647489
170.2652611655168030.5305223310336060.734738834483197
180.1699815344686340.3399630689372680.830018465531366
190.1067271852567290.2134543705134580.893272814743271
200.06863994707977820.1372798941595560.931360052920222
210.04500057931428440.09000115862856870.954999420685716
220.02663551986193880.05327103972387760.973364480138061
230.01533599495407220.03067198990814440.984664005045928
240.007491801253532570.01498360250706510.992508198746467
250.005812870626355470.01162574125271090.994187129373645
260.004083367882714880.008166735765429760.995916632117285
270.002995451087193730.005990902174387470.997004548912806
280.001672090760850230.003344181521700470.99832790923915
290.0008716744777808470.001743348955561690.99912832552222
300.0004864481733156880.0009728963466313770.999513551826684
310.0003220593921497950.0006441187842995910.99967794060785
320.0002178038460311810.0004356076920623630.999782196153969
330.0002495188534673910.0004990377069347820.999750481146533
340.0003811572044371830.0007623144088743670.999618842795563
350.0006055137138813620.001211027427762720.999394486286119
360.001431816003559910.002863632007119830.99856818399644
370.008323252938017420.01664650587603480.991676747061983
380.02969994290389460.05939988580778910.970300057096105
390.073297019829620.146594039659240.92670298017038
400.1065861093531670.2131722187063340.893413890646833
410.1560667697926970.3121335395853940.843933230207303
420.2420778518004940.4841557036009880.757922148199506
430.3881392131163770.7762784262327530.611860786883623
440.4912920405317740.9825840810635470.508707959468226
450.7615430568309750.476913886338050.238456943169025
460.7703250011098720.4593499977802570.229674998890128
470.7715685618582520.4568628762834970.228431438141748


Meta Analysis of Goldfeld-Quandt test for Heteroskedasticity
Description# significant tests% significant testsOK/NOK
1% type I error level110.34375NOK
5% type I error level150.46875NOK
10% type I error level180.5625NOK

\begin{tabular}{lllllllll}
\hline
Meta Analysis of Goldfeld-Quandt test for Heteroskedasticity \tabularnewline
Description & # significant tests & % significant tests & OK/NOK \tabularnewline
1% type I error level & 11 & 0.34375 & NOK \tabularnewline
5% type I error level & 15 & 0.46875 & NOK \tabularnewline
10% type I error level & 18 & 0.5625 & NOK \tabularnewline
\hline
\end{tabular}
%Source: https://freestatistics.org/blog/index.php?pk=34199&T=6

[TABLE]
[ROW][C]Meta Analysis of Goldfeld-Quandt test for Heteroskedasticity[/C][/ROW]
[ROW][C]Description[/C][C]# significant tests[/C][C]% significant tests[/C][C]OK/NOK[/C][/ROW]
[ROW][C]1% type I error level[/C][C]11[/C][C]0.34375[/C][C]NOK[/C][/ROW]
[ROW][C]5% type I error level[/C][C]15[/C][C]0.46875[/C][C]NOK[/C][/ROW]
[ROW][C]10% type I error level[/C][C]18[/C][C]0.5625[/C][C]NOK[/C][/ROW]
[/TABLE]
Source: https://freestatistics.org/blog/index.php?pk=34199&T=6

Globally Unique Identifier (entire table): ba.freestatistics.org/blog/index.php?pk=34199&T=6

As an alternative you can also use a QR Code:  

The GUIDs for individual cells are displayed in the table below:

Meta Analysis of Goldfeld-Quandt test for Heteroskedasticity
Description# significant tests% significant testsOK/NOK
1% type I error level110.34375NOK
5% type I error level150.46875NOK
10% type I error level180.5625NOK


Parameters (Session):
par1 = 1 ; par2 = Include Monthly Dummies ; par3 = No Linear Trend ;
Parameters (R input):
par1 = 1 ; par2 = Include Monthly Dummies ; par3 = No Linear Trend ;
R code (references can be found in the software module):
library(lattice)
library(lmtest)
n25 <- 25 #minimum number of obs. for Goldfeld-Quandt test
par1 <- as.numeric(par1)
x <- t(y)
k <- length(x[1,])
n <- length(x[,1])
x1 <- cbind(x[,par1], x[,1:k!=par1])
mycolnames <- c(colnames(x)[par1], colnames(x)[1:k!=par1])
colnames(x1) <- mycolnames #colnames(x)[par1]
x <- x1
if (par3 == 'First Differences'){
x2 <- array(0, dim=c(n-1,k), dimnames=list(1:(n-1), paste('(1-B)',colnames(x),sep='')))
for (i in 1:n-1) {
for (j in 1:k) {
x2[i,j] <- x[i+1,j] - x[i,j]
}
}
x <- x2
}
if (par2 == 'Include Monthly Dummies'){
x2 <- array(0, dim=c(n,11), dimnames=list(1:n, paste('M', seq(1:11), sep ='')))
for (i in 1:11){
x2[seq(i,n,12),i] <- 1
}
x <- cbind(x, x2)
}
if (par2 == 'Include Quarterly Dummies'){
x2 <- array(0, dim=c(n,3), dimnames=list(1:n, paste('Q', seq(1:3), sep ='')))
for (i in 1:3){
x2[seq(i,n,4),i] <- 1
}
x <- cbind(x, x2)
}
k <- length(x[1,])
if (par3 == 'Linear Trend'){
x <- cbind(x, c(1:n))
colnames(x)[k+1] <- 't'
}
x
k <- length(x[1,])
df <- as.data.frame(x)
(mylm <- lm(df))
(mysum <- summary(mylm))
if (n > n25) {
kp3 <- k + 3
nmkm3 <- n - k - 3
gqarr <- array(NA, dim=c(nmkm3-kp3+1,3))
numgqtests <- 0
numsignificant1 <- 0
numsignificant5 <- 0
numsignificant10 <- 0
for (mypoint in kp3:nmkm3) {
j <- 0
numgqtests <- numgqtests + 1
for (myalt in c('greater', 'two.sided', 'less')) {
j <- j + 1
gqarr[mypoint-kp3+1,j] <- gqtest(mylm, point=mypoint, alternative=myalt)$p.value
}
if (gqarr[mypoint-kp3+1,2] < 0.01) numsignificant1 <- numsignificant1 + 1
if (gqarr[mypoint-kp3+1,2] < 0.05) numsignificant5 <- numsignificant5 + 1
if (gqarr[mypoint-kp3+1,2] < 0.10) numsignificant10 <- numsignificant10 + 1
}
gqarr
}
bitmap(file='test0.png')
plot(x[,1], type='l', main='Actuals and Interpolation', ylab='value of Actuals and Interpolation (dots)', xlab='time or index')
points(x[,1]-mysum$resid)
grid()
dev.off()
bitmap(file='test1.png')
plot(mysum$resid, type='b', pch=19, main='Residuals', ylab='value of Residuals', xlab='time or index')
grid()
dev.off()
bitmap(file='test2.png')
hist(mysum$resid, main='Residual Histogram', xlab='values of Residuals')
grid()
dev.off()
bitmap(file='test3.png')
densityplot(~mysum$resid,col='black',main='Residual Density Plot', xlab='values of Residuals')
dev.off()
bitmap(file='test4.png')
qqnorm(mysum$resid, main='Residual Normal Q-Q Plot')
qqline(mysum$resid)
grid()
dev.off()
(myerror <- as.ts(mysum$resid))
bitmap(file='test5.png')
dum <- cbind(lag(myerror,k=1),myerror)
dum
dum1 <- dum[2:length(myerror),]
dum1
z <- as.data.frame(dum1)
z
plot(z,main=paste('Residual Lag plot, lowess, and regression line'), ylab='values of Residuals', xlab='lagged values of Residuals')
lines(lowess(z))
abline(lm(z))
grid()
dev.off()
bitmap(file='test6.png')
acf(mysum$resid, lag.max=length(mysum$resid)/2, main='Residual Autocorrelation Function')
grid()
dev.off()
bitmap(file='test7.png')
pacf(mysum$resid, lag.max=length(mysum$resid)/2, main='Residual Partial Autocorrelation Function')
grid()
dev.off()
bitmap(file='test8.png')
opar <- par(mfrow = c(2,2), oma = c(0, 0, 1.1, 0))
plot(mylm, las = 1, sub='Residual Diagnostics')
par(opar)
dev.off()
if (n > n25) {
bitmap(file='test9.png')
plot(kp3:nmkm3,gqarr[,2], main='Goldfeld-Quandt test',ylab='2-sided p-value',xlab='breakpoint')
grid()
dev.off()
}
load(file='createtable')
a<-table.start()
a<-table.row.start(a)
a<-table.element(a, 'Multiple Linear Regression - Estimated Regression Equation', 1, TRUE)
a<-table.row.end(a)
myeq <- colnames(x)[1]
myeq <- paste(myeq, '[t] = ', sep='')
for (i in 1:k){
if (mysum$coefficients[i,1] > 0) myeq <- paste(myeq, '+', '')
myeq <- paste(myeq, mysum$coefficients[i,1], sep=' ')
if (rownames(mysum$coefficients)[i] != '(Intercept)') {
myeq <- paste(myeq, rownames(mysum$coefficients)[i], sep='')
if (rownames(mysum$coefficients)[i] != 't') myeq <- paste(myeq, '[t]', sep='')
}
}
myeq <- paste(myeq, ' + e[t]')
a<-table.row.start(a)
a<-table.element(a, myeq)
a<-table.row.end(a)
a<-table.end(a)
table.save(a,file='mytable1.tab')
a<-table.start()
a<-table.row.start(a)
a<-table.element(a,hyperlink('ols1.htm','Multiple Linear Regression - Ordinary Least Squares',''), 6, TRUE)
a<-table.row.end(a)
a<-table.row.start(a)
a<-table.element(a,'Variable',header=TRUE)
a<-table.element(a,'Parameter',header=TRUE)
a<-table.element(a,'S.D.',header=TRUE)
a<-table.element(a,'T-STAT
H0: parameter = 0',header=TRUE)
a<-table.element(a,'2-tail p-value',header=TRUE)
a<-table.element(a,'1-tail p-value',header=TRUE)
a<-table.row.end(a)
for (i in 1:k){
a<-table.row.start(a)
a<-table.element(a,rownames(mysum$coefficients)[i],header=TRUE)
a<-table.element(a,mysum$coefficients[i,1])
a<-table.element(a, round(mysum$coefficients[i,2],6))
a<-table.element(a, round(mysum$coefficients[i,3],4))
a<-table.element(a, round(mysum$coefficients[i,4],6))
a<-table.element(a, round(mysum$coefficients[i,4]/2,6))
a<-table.row.end(a)
}
a<-table.end(a)
table.save(a,file='mytable2.tab')
a<-table.start()
a<-table.row.start(a)
a<-table.element(a, 'Multiple Linear Regression - Regression Statistics', 2, TRUE)
a<-table.row.end(a)
a<-table.row.start(a)
a<-table.element(a, 'Multiple R',1,TRUE)
a<-table.element(a, sqrt(mysum$r.squared))
a<-table.row.end(a)
a<-table.row.start(a)
a<-table.element(a, 'R-squared',1,TRUE)
a<-table.element(a, mysum$r.squared)
a<-table.row.end(a)
a<-table.row.start(a)
a<-table.element(a, 'Adjusted R-squared',1,TRUE)
a<-table.element(a, mysum$adj.r.squared)
a<-table.row.end(a)
a<-table.row.start(a)
a<-table.element(a, 'F-TEST (value)',1,TRUE)
a<-table.element(a, mysum$fstatistic[1])
a<-table.row.end(a)
a<-table.row.start(a)
a<-table.element(a, 'F-TEST (DF numerator)',1,TRUE)
a<-table.element(a, mysum$fstatistic[2])
a<-table.row.end(a)
a<-table.row.start(a)
a<-table.element(a, 'F-TEST (DF denominator)',1,TRUE)
a<-table.element(a, mysum$fstatistic[3])
a<-table.row.end(a)
a<-table.row.start(a)
a<-table.element(a, 'p-value',1,TRUE)
a<-table.element(a, 1-pf(mysum$fstatistic[1],mysum$fstatistic[2],mysum$fstatistic[3]))
a<-table.row.end(a)
a<-table.row.start(a)
a<-table.element(a, 'Multiple Linear Regression - Residual Statistics', 2, TRUE)
a<-table.row.end(a)
a<-table.row.start(a)
a<-table.element(a, 'Residual Standard Deviation',1,TRUE)
a<-table.element(a, mysum$sigma)
a<-table.row.end(a)
a<-table.row.start(a)
a<-table.element(a, 'Sum Squared Residuals',1,TRUE)
a<-table.element(a, sum(myerror*myerror))
a<-table.row.end(a)
a<-table.end(a)
table.save(a,file='mytable3.tab')
a<-table.start()
a<-table.row.start(a)
a<-table.element(a, 'Multiple Linear Regression - Actuals, Interpolation, and Residuals', 4, TRUE)
a<-table.row.end(a)
a<-table.row.start(a)
a<-table.element(a, 'Time or Index', 1, TRUE)
a<-table.element(a, 'Actuals', 1, TRUE)
a<-table.element(a, 'Interpolation
Forecast', 1, TRUE)
a<-table.element(a, 'Residuals
Prediction Error', 1, TRUE)
a<-table.row.end(a)
for (i in 1:n) {
a<-table.row.start(a)
a<-table.element(a,i, 1, TRUE)
a<-table.element(a,x[i])
a<-table.element(a,x[i]-mysum$resid[i])
a<-table.element(a,mysum$resid[i])
a<-table.row.end(a)
}
a<-table.end(a)
table.save(a,file='mytable4.tab')
if (n > n25) {
a<-table.start()
a<-table.row.start(a)
a<-table.element(a,'Goldfeld-Quandt test for Heteroskedasticity',4,TRUE)
a<-table.row.end(a)
a<-table.row.start(a)
a<-table.element(a,'p-values',header=TRUE)
a<-table.element(a,'Alternative Hypothesis',3,header=TRUE)
a<-table.row.end(a)
a<-table.row.start(a)
a<-table.element(a,'breakpoint index',header=TRUE)
a<-table.element(a,'greater',header=TRUE)
a<-table.element(a,'2-sided',header=TRUE)
a<-table.element(a,'less',header=TRUE)
a<-table.row.end(a)
for (mypoint in kp3:nmkm3) {
a<-table.row.start(a)
a<-table.element(a,mypoint,header=TRUE)
a<-table.element(a,gqarr[mypoint-kp3+1,1])
a<-table.element(a,gqarr[mypoint-kp3+1,2])
a<-table.element(a,gqarr[mypoint-kp3+1,3])
a<-table.row.end(a)
}
a<-table.end(a)
table.save(a,file='mytable5.tab')
a<-table.start()
a<-table.row.start(a)
a<-table.element(a,'Meta Analysis of Goldfeld-Quandt test for Heteroskedasticity',4,TRUE)
a<-table.row.end(a)
a<-table.row.start(a)
a<-table.element(a,'Description',header=TRUE)
a<-table.element(a,'# significant tests',header=TRUE)
a<-table.element(a,'% significant tests',header=TRUE)
a<-table.element(a,'OK/NOK',header=TRUE)
a<-table.row.end(a)
a<-table.row.start(a)
a<-table.element(a,'1% type I error level',header=TRUE)
a<-table.element(a,numsignificant1)
a<-table.element(a,numsignificant1/numgqtests)
if (numsignificant1/numgqtests < 0.01) dum <- 'OK' else dum <- 'NOK'
a<-table.element(a,dum)
a<-table.row.end(a)
a<-table.row.start(a)
a<-table.element(a,'5% type I error level',header=TRUE)
a<-table.element(a,numsignificant5)
a<-table.element(a,numsignificant5/numgqtests)
if (numsignificant5/numgqtests < 0.05) dum <- 'OK' else dum <- 'NOK'
a<-table.element(a,dum)
a<-table.row.end(a)
a<-table.row.start(a)
a<-table.element(a,'10% type I error level',header=TRUE)
a<-table.element(a,numsignificant10)
a<-table.element(a,numsignificant10/numgqtests)
if (numsignificant10/numgqtests < 0.1) dum <- 'OK' else dum <- 'NOK'
a<-table.element(a,dum)
a<-table.row.end(a)
a<-table.end(a)
table.save(a,file='mytable6.tab')
}