Free Statistics

of Irreproducible Research!

Author's title

Author*The author of this computation has been verified*
R Software Modulerwasp_arimabackwardselection.wasp
Title produced by softwareARIMA Backward Selection
Date of computationTue, 16 Dec 2008 13:22:41 -0700
Cite this page as followsStatistical Computations at FreeStatistics.org, Office for Research Development and Education, URL https://freestatistics.org/blog/index.php?v=date/2008/Dec/16/t1229459053r5rum9ibifj4eqb.htm/, Retrieved Wed, 15 May 2024 11:16:38 +0000
Statistical Computations at FreeStatistics.org, Office for Research Development and Education, URL https://freestatistics.org/blog/index.php?pk=34177, Retrieved Wed, 15 May 2024 11:16:38 +0000
QR Codes:

Original text written by user:
IsPrivate?No (this computation is public)
User-defined keywords
Estimated Impact177
Family? (F = Feedback message, R = changed R code, M = changed R Module, P = changed Parameters, D = changed Data)
F     [ARIMA Forecasting] [arima forecast ex...] [2008-12-10 16:35:06] [1e1d8320a8a1170c475bf6e4ce119de6]
F       [ARIMA Forecasting] [ARIMA Forecasting] [2008-12-15 20:25:56] [3754dd41128068acfc463ebbabce5a9c]
- RMP       [ARIMA Backward Selection] [feedback op blog] [2008-12-16 20:22:41] [f4b2017b314c03698059f43b95818e67] [Current]
Feedback Forum

Post a new message
Dataseries X:
13807.9
14101.7
16010.3
14633.1
14478.5
15327.3
14179.5
11398.2
16111.5
15887.4
14529.3
13923.1
13960.2
14807.8
17511.5
15845.9
14594.2
17252.2
14832.8
13132.1
17665.9
16913
17318.8
16224.2
15469.6
16557.5
19414.8
17335
16525.2
18160.4
15553.8
15262.2
18581
17564.1
18948.6
17187.8
17564.8
17668.4
20811.7
17257.8
18984.2
20532.6
17082.3
16894.9
20274.9
20078.6
19900.9
17012.2
19642.9
19024
21691
18835.9
19873.4
21468.2
19406.8
18385.3
20739.3
22268.3
21569
17514.8


Summary of computational transaction
Raw Inputview raw input (R code)
Raw Outputview raw output of R engine
Computing time16 seconds
R Server'Herman Ole Andreas Wold' @ 193.190.124.10:1001

\begin{tabular}{lllllllll}
\hline
Summary of computational transaction \tabularnewline
Raw Input & view raw input (R code)  \tabularnewline
Raw Output & view raw output of R engine  \tabularnewline
Computing time & 16 seconds \tabularnewline
R Server & 'Herman Ole Andreas Wold' @ 193.190.124.10:1001 \tabularnewline
\hline
\end{tabular}
%Source: https://freestatistics.org/blog/index.php?pk=34177&T=0

[TABLE]
[ROW][C]Summary of computational transaction[/C][/ROW]
[ROW][C]Raw Input[/C][C]view raw input (R code) [/C][/ROW]
[ROW][C]Raw Output[/C][C]view raw output of R engine [/C][/ROW]
[ROW][C]Computing time[/C][C]16 seconds[/C][/ROW]
[ROW][C]R Server[/C][C]'Herman Ole Andreas Wold' @ 193.190.124.10:1001[/C][/ROW]
[/TABLE]
Source: https://freestatistics.org/blog/index.php?pk=34177&T=0

Globally Unique Identifier (entire table): ba.freestatistics.org/blog/index.php?pk=34177&T=0

As an alternative you can also use a QR Code:  

The GUIDs for individual cells are displayed in the table below:

Summary of computational transaction
Raw Inputview raw input (R code)
Raw Outputview raw output of R engine
Computing time16 seconds
R Server'Herman Ole Andreas Wold' @ 193.190.124.10:1001


ARIMA Parameter Estimation and Backward Selection
Iterationar1ar2ar3ma1sar1sar2sma1
Estimates ( 1 )0.47270.05020.4726-0.4550.4377-0.4254-0.5281
(p-val)(0.0308 )(0.7695 )(0.005 )(0.0273 )(0.6883 )(0.0327 )(0.7279 )
Estimates ( 2 )0.512800.4833-0.470.4974-0.4173-0.5812
(p-val)(0.0014 )(NA )(0.0021 )(0.0106 )(0.4583 )(0.03 )(0.5342 )
Estimates ( 3 )0.482100.5061-0.44170.041-0.42950
(p-val)(0.0022 )(NA )(0.0012 )(0.0172 )(0.8051 )(0.0198 )(NA )
Estimates ( 4 )0.478300.511-0.44860-0.43260
(p-val)(0.0024 )(NA )(0.0011 )(0.014 )(NA )(0.0185 )(NA )
Estimates ( 5 )NANANANANANANA
(p-val)(NA )(NA )(NA )(NA )(NA )(NA )(NA )
Estimates ( 6 )NANANANANANANA
(p-val)(NA )(NA )(NA )(NA )(NA )(NA )(NA )
Estimates ( 7 )NANANANANANANA
(p-val)(NA )(NA )(NA )(NA )(NA )(NA )(NA )
Estimates ( 8 )NANANANANANANA
(p-val)(NA )(NA )(NA )(NA )(NA )(NA )(NA )
Estimates ( 9 )NANANANANANANA
(p-val)(NA )(NA )(NA )(NA )(NA )(NA )(NA )
Estimates ( 10 )NANANANANANANA
(p-val)(NA )(NA )(NA )(NA )(NA )(NA )(NA )
Estimates ( 11 )NANANANANANANA
(p-val)(NA )(NA )(NA )(NA )(NA )(NA )(NA )
Estimates ( 12 )NANANANANANANA
(p-val)(NA )(NA )(NA )(NA )(NA )(NA )(NA )
Estimates ( 13 )NANANANANANANA
(p-val)(NA )(NA )(NA )(NA )(NA )(NA )(NA )

\begin{tabular}{lllllllll}
\hline
ARIMA Parameter Estimation and Backward Selection \tabularnewline
Iteration & ar1 & ar2 & ar3 & ma1 & sar1 & sar2 & sma1 \tabularnewline
Estimates ( 1 ) & 0.4727 & 0.0502 & 0.4726 & -0.455 & 0.4377 & -0.4254 & -0.5281 \tabularnewline
(p-val) & (0.0308 ) & (0.7695 ) & (0.005 ) & (0.0273 ) & (0.6883 ) & (0.0327 ) & (0.7279 ) \tabularnewline
Estimates ( 2 ) & 0.5128 & 0 & 0.4833 & -0.47 & 0.4974 & -0.4173 & -0.5812 \tabularnewline
(p-val) & (0.0014 ) & (NA ) & (0.0021 ) & (0.0106 ) & (0.4583 ) & (0.03 ) & (0.5342 ) \tabularnewline
Estimates ( 3 ) & 0.4821 & 0 & 0.5061 & -0.4417 & 0.041 & -0.4295 & 0 \tabularnewline
(p-val) & (0.0022 ) & (NA ) & (0.0012 ) & (0.0172 ) & (0.8051 ) & (0.0198 ) & (NA ) \tabularnewline
Estimates ( 4 ) & 0.4783 & 0 & 0.511 & -0.4486 & 0 & -0.4326 & 0 \tabularnewline
(p-val) & (0.0024 ) & (NA ) & (0.0011 ) & (0.014 ) & (NA ) & (0.0185 ) & (NA ) \tabularnewline
Estimates ( 5 ) & NA & NA & NA & NA & NA & NA & NA \tabularnewline
(p-val) & (NA ) & (NA ) & (NA ) & (NA ) & (NA ) & (NA ) & (NA ) \tabularnewline
Estimates ( 6 ) & NA & NA & NA & NA & NA & NA & NA \tabularnewline
(p-val) & (NA ) & (NA ) & (NA ) & (NA ) & (NA ) & (NA ) & (NA ) \tabularnewline
Estimates ( 7 ) & NA & NA & NA & NA & NA & NA & NA \tabularnewline
(p-val) & (NA ) & (NA ) & (NA ) & (NA ) & (NA ) & (NA ) & (NA ) \tabularnewline
Estimates ( 8 ) & NA & NA & NA & NA & NA & NA & NA \tabularnewline
(p-val) & (NA ) & (NA ) & (NA ) & (NA ) & (NA ) & (NA ) & (NA ) \tabularnewline
Estimates ( 9 ) & NA & NA & NA & NA & NA & NA & NA \tabularnewline
(p-val) & (NA ) & (NA ) & (NA ) & (NA ) & (NA ) & (NA ) & (NA ) \tabularnewline
Estimates ( 10 ) & NA & NA & NA & NA & NA & NA & NA \tabularnewline
(p-val) & (NA ) & (NA ) & (NA ) & (NA ) & (NA ) & (NA ) & (NA ) \tabularnewline
Estimates ( 11 ) & NA & NA & NA & NA & NA & NA & NA \tabularnewline
(p-val) & (NA ) & (NA ) & (NA ) & (NA ) & (NA ) & (NA ) & (NA ) \tabularnewline
Estimates ( 12 ) & NA & NA & NA & NA & NA & NA & NA \tabularnewline
(p-val) & (NA ) & (NA ) & (NA ) & (NA ) & (NA ) & (NA ) & (NA ) \tabularnewline
Estimates ( 13 ) & NA & NA & NA & NA & NA & NA & NA \tabularnewline
(p-val) & (NA ) & (NA ) & (NA ) & (NA ) & (NA ) & (NA ) & (NA ) \tabularnewline
\hline
\end{tabular}
%Source: https://freestatistics.org/blog/index.php?pk=34177&T=1

[TABLE]
[ROW][C]ARIMA Parameter Estimation and Backward Selection[/C][/ROW]
[ROW][C]Iteration[/C][C]ar1[/C][C]ar2[/C][C]ar3[/C][C]ma1[/C][C]sar1[/C][C]sar2[/C][C]sma1[/C][/ROW]
[ROW][C]Estimates ( 1 )[/C][C]0.4727[/C][C]0.0502[/C][C]0.4726[/C][C]-0.455[/C][C]0.4377[/C][C]-0.4254[/C][C]-0.5281[/C][/ROW]
[ROW][C](p-val)[/C][C](0.0308 )[/C][C](0.7695 )[/C][C](0.005 )[/C][C](0.0273 )[/C][C](0.6883 )[/C][C](0.0327 )[/C][C](0.7279 )[/C][/ROW]
[ROW][C]Estimates ( 2 )[/C][C]0.5128[/C][C]0[/C][C]0.4833[/C][C]-0.47[/C][C]0.4974[/C][C]-0.4173[/C][C]-0.5812[/C][/ROW]
[ROW][C](p-val)[/C][C](0.0014 )[/C][C](NA )[/C][C](0.0021 )[/C][C](0.0106 )[/C][C](0.4583 )[/C][C](0.03 )[/C][C](0.5342 )[/C][/ROW]
[ROW][C]Estimates ( 3 )[/C][C]0.4821[/C][C]0[/C][C]0.5061[/C][C]-0.4417[/C][C]0.041[/C][C]-0.4295[/C][C]0[/C][/ROW]
[ROW][C](p-val)[/C][C](0.0022 )[/C][C](NA )[/C][C](0.0012 )[/C][C](0.0172 )[/C][C](0.8051 )[/C][C](0.0198 )[/C][C](NA )[/C][/ROW]
[ROW][C]Estimates ( 4 )[/C][C]0.4783[/C][C]0[/C][C]0.511[/C][C]-0.4486[/C][C]0[/C][C]-0.4326[/C][C]0[/C][/ROW]
[ROW][C](p-val)[/C][C](0.0024 )[/C][C](NA )[/C][C](0.0011 )[/C][C](0.014 )[/C][C](NA )[/C][C](0.0185 )[/C][C](NA )[/C][/ROW]
[ROW][C]Estimates ( 5 )[/C][C]NA[/C][C]NA[/C][C]NA[/C][C]NA[/C][C]NA[/C][C]NA[/C][C]NA[/C][/ROW]
[ROW][C](p-val)[/C][C](NA )[/C][C](NA )[/C][C](NA )[/C][C](NA )[/C][C](NA )[/C][C](NA )[/C][C](NA )[/C][/ROW]
[ROW][C]Estimates ( 6 )[/C][C]NA[/C][C]NA[/C][C]NA[/C][C]NA[/C][C]NA[/C][C]NA[/C][C]NA[/C][/ROW]
[ROW][C](p-val)[/C][C](NA )[/C][C](NA )[/C][C](NA )[/C][C](NA )[/C][C](NA )[/C][C](NA )[/C][C](NA )[/C][/ROW]
[ROW][C]Estimates ( 7 )[/C][C]NA[/C][C]NA[/C][C]NA[/C][C]NA[/C][C]NA[/C][C]NA[/C][C]NA[/C][/ROW]
[ROW][C](p-val)[/C][C](NA )[/C][C](NA )[/C][C](NA )[/C][C](NA )[/C][C](NA )[/C][C](NA )[/C][C](NA )[/C][/ROW]
[ROW][C]Estimates ( 8 )[/C][C]NA[/C][C]NA[/C][C]NA[/C][C]NA[/C][C]NA[/C][C]NA[/C][C]NA[/C][/ROW]
[ROW][C](p-val)[/C][C](NA )[/C][C](NA )[/C][C](NA )[/C][C](NA )[/C][C](NA )[/C][C](NA )[/C][C](NA )[/C][/ROW]
[ROW][C]Estimates ( 9 )[/C][C]NA[/C][C]NA[/C][C]NA[/C][C]NA[/C][C]NA[/C][C]NA[/C][C]NA[/C][/ROW]
[ROW][C](p-val)[/C][C](NA )[/C][C](NA )[/C][C](NA )[/C][C](NA )[/C][C](NA )[/C][C](NA )[/C][C](NA )[/C][/ROW]
[ROW][C]Estimates ( 10 )[/C][C]NA[/C][C]NA[/C][C]NA[/C][C]NA[/C][C]NA[/C][C]NA[/C][C]NA[/C][/ROW]
[ROW][C](p-val)[/C][C](NA )[/C][C](NA )[/C][C](NA )[/C][C](NA )[/C][C](NA )[/C][C](NA )[/C][C](NA )[/C][/ROW]
[ROW][C]Estimates ( 11 )[/C][C]NA[/C][C]NA[/C][C]NA[/C][C]NA[/C][C]NA[/C][C]NA[/C][C]NA[/C][/ROW]
[ROW][C](p-val)[/C][C](NA )[/C][C](NA )[/C][C](NA )[/C][C](NA )[/C][C](NA )[/C][C](NA )[/C][C](NA )[/C][/ROW]
[ROW][C]Estimates ( 12 )[/C][C]NA[/C][C]NA[/C][C]NA[/C][C]NA[/C][C]NA[/C][C]NA[/C][C]NA[/C][/ROW]
[ROW][C](p-val)[/C][C](NA )[/C][C](NA )[/C][C](NA )[/C][C](NA )[/C][C](NA )[/C][C](NA )[/C][C](NA )[/C][/ROW]
[ROW][C]Estimates ( 13 )[/C][C]NA[/C][C]NA[/C][C]NA[/C][C]NA[/C][C]NA[/C][C]NA[/C][C]NA[/C][/ROW]
[ROW][C](p-val)[/C][C](NA )[/C][C](NA )[/C][C](NA )[/C][C](NA )[/C][C](NA )[/C][C](NA )[/C][C](NA )[/C][/ROW]
[/TABLE]
Source: https://freestatistics.org/blog/index.php?pk=34177&T=1

Globally Unique Identifier (entire table): ba.freestatistics.org/blog/index.php?pk=34177&T=1

As an alternative you can also use a QR Code:  

The GUIDs for individual cells are displayed in the table below:

ARIMA Parameter Estimation and Backward Selection
Iterationar1ar2ar3ma1sar1sar2sma1
Estimates ( 1 )0.47270.05020.4726-0.4550.4377-0.4254-0.5281
(p-val)(0.0308 )(0.7695 )(0.005 )(0.0273 )(0.6883 )(0.0327 )(0.7279 )
Estimates ( 2 )0.512800.4833-0.470.4974-0.4173-0.5812
(p-val)(0.0014 )(NA )(0.0021 )(0.0106 )(0.4583 )(0.03 )(0.5342 )
Estimates ( 3 )0.482100.5061-0.44170.041-0.42950
(p-val)(0.0022 )(NA )(0.0012 )(0.0172 )(0.8051 )(0.0198 )(NA )
Estimates ( 4 )0.478300.511-0.44860-0.43260
(p-val)(0.0024 )(NA )(0.0011 )(0.014 )(NA )(0.0185 )(NA )
Estimates ( 5 )NANANANANANANA
(p-val)(NA )(NA )(NA )(NA )(NA )(NA )(NA )
Estimates ( 6 )NANANANANANANA
(p-val)(NA )(NA )(NA )(NA )(NA )(NA )(NA )
Estimates ( 7 )NANANANANANANA
(p-val)(NA )(NA )(NA )(NA )(NA )(NA )(NA )
Estimates ( 8 )NANANANANANANA
(p-val)(NA )(NA )(NA )(NA )(NA )(NA )(NA )
Estimates ( 9 )NANANANANANANA
(p-val)(NA )(NA )(NA )(NA )(NA )(NA )(NA )
Estimates ( 10 )NANANANANANANA
(p-val)(NA )(NA )(NA )(NA )(NA )(NA )(NA )
Estimates ( 11 )NANANANANANANA
(p-val)(NA )(NA )(NA )(NA )(NA )(NA )(NA )
Estimates ( 12 )NANANANANANANA
(p-val)(NA )(NA )(NA )(NA )(NA )(NA )(NA )
Estimates ( 13 )NANANANANANANA
(p-val)(NA )(NA )(NA )(NA )(NA )(NA )(NA )


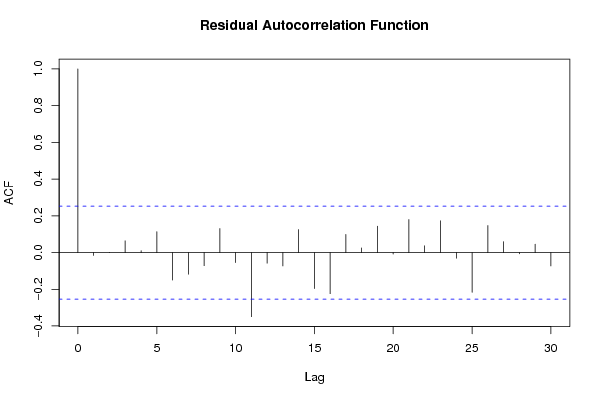
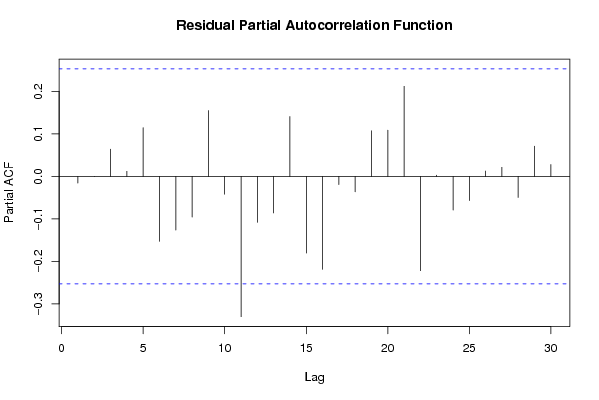
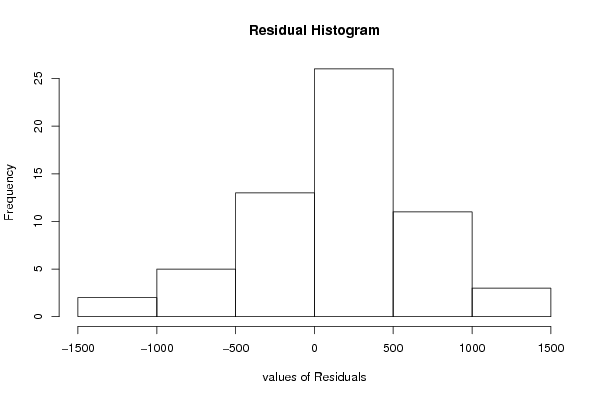
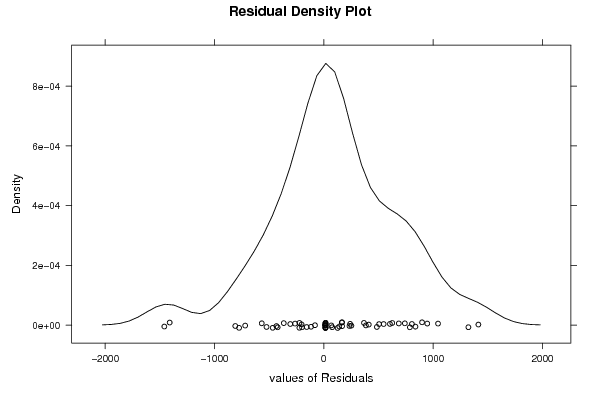
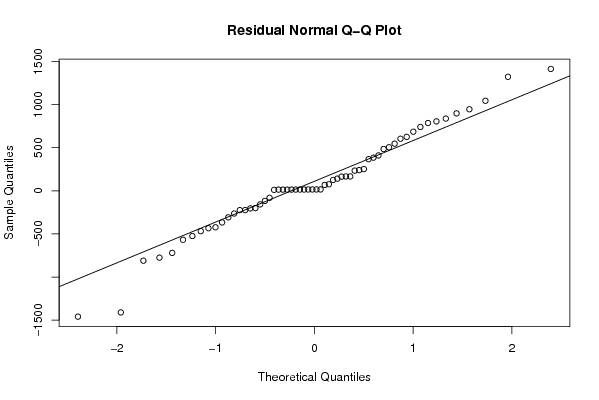
Estimated ARIMA Residuals
Value
13.9224943846940
68.4043688660345
384.522070209705
786.616741997616
625.853436514671
-467.898385607755
805.458275157012
-433.870842119899
1044.36889063495
240.383036563298
76.1392345419067
1322.22176119039
740.664903536866
252.051227208873
-223.779897461106
-200.095746213126
-263.175694353423
234.354707066055
-810.237608629557
-775.019590423048
410.744411760181
-307.227104200572
-366.632988699297
126.106080935863
-81.1920480502366
898.224527092248
-223.362979042325
484.928755177492
-1410.04965386438
945.895783583563
1413.42721465445
685.579841938263
505.326770870222
-157.105042282118
837.826050378594
-117.183939953671
-1459.26843422826
141.149023591932
-203.670769308583
164.294962009282
166.572370441733
-422.758446922431
-568.046093318517
604.370927451586
546.755078398599
-719.622843547148
367.046545501041
166.891259861823
-524.323561986676

\begin{tabular}{lllllllll}
\hline
Estimated ARIMA Residuals \tabularnewline
Value \tabularnewline
13.9224943846940 \tabularnewline
68.4043688660345 \tabularnewline
384.522070209705 \tabularnewline
786.616741997616 \tabularnewline
625.853436514671 \tabularnewline
-467.898385607755 \tabularnewline
805.458275157012 \tabularnewline
-433.870842119899 \tabularnewline
1044.36889063495 \tabularnewline
240.383036563298 \tabularnewline
76.1392345419067 \tabularnewline
1322.22176119039 \tabularnewline
740.664903536866 \tabularnewline
252.051227208873 \tabularnewline
-223.779897461106 \tabularnewline
-200.095746213126 \tabularnewline
-263.175694353423 \tabularnewline
234.354707066055 \tabularnewline
-810.237608629557 \tabularnewline
-775.019590423048 \tabularnewline
410.744411760181 \tabularnewline
-307.227104200572 \tabularnewline
-366.632988699297 \tabularnewline
126.106080935863 \tabularnewline
-81.1920480502366 \tabularnewline
898.224527092248 \tabularnewline
-223.362979042325 \tabularnewline
484.928755177492 \tabularnewline
-1410.04965386438 \tabularnewline
945.895783583563 \tabularnewline
1413.42721465445 \tabularnewline
685.579841938263 \tabularnewline
505.326770870222 \tabularnewline
-157.105042282118 \tabularnewline
837.826050378594 \tabularnewline
-117.183939953671 \tabularnewline
-1459.26843422826 \tabularnewline
141.149023591932 \tabularnewline
-203.670769308583 \tabularnewline
164.294962009282 \tabularnewline
166.572370441733 \tabularnewline
-422.758446922431 \tabularnewline
-568.046093318517 \tabularnewline
604.370927451586 \tabularnewline
546.755078398599 \tabularnewline
-719.622843547148 \tabularnewline
367.046545501041 \tabularnewline
166.891259861823 \tabularnewline
-524.323561986676 \tabularnewline
\hline
\end{tabular}
%Source: https://freestatistics.org/blog/index.php?pk=34177&T=2

[TABLE]
[ROW][C]Estimated ARIMA Residuals[/C][/ROW]
[ROW][C]Value[/C][/ROW]
[ROW][C]13.9224943846940[/C][/ROW]
[ROW][C]68.4043688660345[/C][/ROW]
[ROW][C]384.522070209705[/C][/ROW]
[ROW][C]786.616741997616[/C][/ROW]
[ROW][C]625.853436514671[/C][/ROW]
[ROW][C]-467.898385607755[/C][/ROW]
[ROW][C]805.458275157012[/C][/ROW]
[ROW][C]-433.870842119899[/C][/ROW]
[ROW][C]1044.36889063495[/C][/ROW]
[ROW][C]240.383036563298[/C][/ROW]
[ROW][C]76.1392345419067[/C][/ROW]
[ROW][C]1322.22176119039[/C][/ROW]
[ROW][C]740.664903536866[/C][/ROW]
[ROW][C]252.051227208873[/C][/ROW]
[ROW][C]-223.779897461106[/C][/ROW]
[ROW][C]-200.095746213126[/C][/ROW]
[ROW][C]-263.175694353423[/C][/ROW]
[ROW][C]234.354707066055[/C][/ROW]
[ROW][C]-810.237608629557[/C][/ROW]
[ROW][C]-775.019590423048[/C][/ROW]
[ROW][C]410.744411760181[/C][/ROW]
[ROW][C]-307.227104200572[/C][/ROW]
[ROW][C]-366.632988699297[/C][/ROW]
[ROW][C]126.106080935863[/C][/ROW]
[ROW][C]-81.1920480502366[/C][/ROW]
[ROW][C]898.224527092248[/C][/ROW]
[ROW][C]-223.362979042325[/C][/ROW]
[ROW][C]484.928755177492[/C][/ROW]
[ROW][C]-1410.04965386438[/C][/ROW]
[ROW][C]945.895783583563[/C][/ROW]
[ROW][C]1413.42721465445[/C][/ROW]
[ROW][C]685.579841938263[/C][/ROW]
[ROW][C]505.326770870222[/C][/ROW]
[ROW][C]-157.105042282118[/C][/ROW]
[ROW][C]837.826050378594[/C][/ROW]
[ROW][C]-117.183939953671[/C][/ROW]
[ROW][C]-1459.26843422826[/C][/ROW]
[ROW][C]141.149023591932[/C][/ROW]
[ROW][C]-203.670769308583[/C][/ROW]
[ROW][C]164.294962009282[/C][/ROW]
[ROW][C]166.572370441733[/C][/ROW]
[ROW][C]-422.758446922431[/C][/ROW]
[ROW][C]-568.046093318517[/C][/ROW]
[ROW][C]604.370927451586[/C][/ROW]
[ROW][C]546.755078398599[/C][/ROW]
[ROW][C]-719.622843547148[/C][/ROW]
[ROW][C]367.046545501041[/C][/ROW]
[ROW][C]166.891259861823[/C][/ROW]
[ROW][C]-524.323561986676[/C][/ROW]
[/TABLE]
Source: https://freestatistics.org/blog/index.php?pk=34177&T=2

Globally Unique Identifier (entire table): ba.freestatistics.org/blog/index.php?pk=34177&T=2

As an alternative you can also use a QR Code:  

The GUIDs for individual cells are displayed in the table below:

Estimated ARIMA Residuals
Value
13.9224943846940
68.4043688660345
384.522070209705
786.616741997616
625.853436514671
-467.898385607755
805.458275157012
-433.870842119899
1044.36889063495
240.383036563298
76.1392345419067
1322.22176119039
740.664903536866
252.051227208873
-223.779897461106
-200.095746213126
-263.175694353423
234.354707066055
-810.237608629557
-775.019590423048
410.744411760181
-307.227104200572
-366.632988699297
126.106080935863
-81.1920480502366
898.224527092248
-223.362979042325
484.928755177492
-1410.04965386438
945.895783583563
1413.42721465445
685.579841938263
505.326770870222
-157.105042282118
837.826050378594
-117.183939953671
-1459.26843422826
141.149023591932
-203.670769308583
164.294962009282
166.572370441733
-422.758446922431
-568.046093318517
604.370927451586
546.755078398599
-719.622843547148
367.046545501041
166.891259861823
-524.323561986676


Parameters (Session):
par1 = 12 ; par2 = 1 ; par3 = 0 ; par4 = 1 ; par5 = 12 ; par6 = 3 ; par7 = 0 ; par8 = 0 ; par9 = 0 ; par10 = FALSE ;
Parameters (R input):
par1 = FALSE ; par2 = 1 ; par3 = 0 ; par4 = 1 ; par5 = 12 ; par6 = 3 ; par7 = 1 ; par8 = 2 ; par9 = 1 ;
R code (references can be found in the software module):
library(lattice)
if (par1 == 'TRUE') par1 <- TRUE
if (par1 == 'FALSE') par1 <- FALSE
par2 <- as.numeric(par2) #Box-Cox lambda transformation parameter
par3 <- as.numeric(par3) #degree of non-seasonal differencing
par4 <- as.numeric(par4) #degree of seasonal differencing
par5 <- as.numeric(par5) #seasonal period
par6 <- as.numeric(par6) #degree (p) of the non-seasonal AR(p) polynomial
par7 <- as.numeric(par7) #degree (q) of the non-seasonal MA(q) polynomial
par8 <- as.numeric(par8) #degree (P) of the seasonal AR(P) polynomial
par9 <- as.numeric(par9) #degree (Q) of the seasonal MA(Q) polynomial
armaGR <- function(arima.out, names, n){
try1 <- arima.out$coef
try2 <- sqrt(diag(arima.out$var.coef))
try.data.frame <- data.frame(matrix(NA,ncol=4,nrow=length(names)))
dimnames(try.data.frame) <- list(names,c('coef','std','tstat','pv'))
try.data.frame[,1] <- try1
for(i in 1:length(try2)) try.data.frame[which(rownames(try.data.frame)==names(try2)[i]),2] <- try2[i]
try.data.frame[,3] <- try.data.frame[,1] / try.data.frame[,2]
try.data.frame[,4] <- round((1-pt(abs(try.data.frame[,3]),df=n-(length(try2)+1)))*2,5)
vector <- rep(NA,length(names))
vector[is.na(try.data.frame[,4])] <- 0
maxi <- which.max(try.data.frame[,4])
continue <- max(try.data.frame[,4],na.rm=TRUE) > .05
vector[maxi] <- 0
list(summary=try.data.frame,next.vector=vector,continue=continue)
}
arimaSelect <- function(series, order=c(13,0,0), seasonal=list(order=c(2,0,0),period=12), include.mean=F){
nrc <- order[1]+order[3]+seasonal$order[1]+seasonal$order[3]
coeff <- matrix(NA, nrow=nrc*2, ncol=nrc)
pval <- matrix(NA, nrow=nrc*2, ncol=nrc)
mylist <- rep(list(NULL), nrc)
names <- NULL
if(order[1] > 0) names <- paste('ar',1:order[1],sep='')
if(order[3] > 0) names <- c( names , paste('ma',1:order[3],sep='') )
if(seasonal$order[1] > 0) names <- c(names, paste('sar',1:seasonal$order[1],sep=''))
if(seasonal$order[3] > 0) names <- c(names, paste('sma',1:seasonal$order[3],sep=''))
arima.out <- arima(series, order=order, seasonal=seasonal, include.mean=include.mean, method='ML')
mylist[[1]] <- arima.out
last.arma <- armaGR(arima.out, names, length(series))
mystop <- FALSE
i <- 1
coeff[i,] <- last.arma[[1]][,1]
pval [i,] <- last.arma[[1]][,4]
i <- 2
aic <- arima.out$aic
while(!mystop){
mylist[[i]] <- arima.out
arima.out <- arima(series, order=order, seasonal=seasonal, include.mean=include.mean, method='ML', fixed=last.arma$next.vector)
aic <- c(aic, arima.out$aic)
last.arma <- armaGR(arima.out, names, length(series))
mystop <- !last.arma$continue
coeff[i,] <- last.arma[[1]][,1]
pval [i,] <- last.arma[[1]][,4]
i <- i+1
}
list(coeff, pval, mylist, aic=aic)
}
arimaSelectplot <- function(arimaSelect.out,noms,choix){
noms <- names(arimaSelect.out[[3]][[1]]$coef)
coeff <- arimaSelect.out[[1]]
k <- min(which(is.na(coeff[,1])))-1
coeff <- coeff[1:k,]
pval <- arimaSelect.out[[2]][1:k,]
aic <- arimaSelect.out$aic[1:k]
coeff[coeff==0] <- NA
n <- ncol(coeff)
if(missing(choix)) choix <- k
layout(matrix(c(1,1,1,2,
3,3,3,2,
3,3,3,4,
5,6,7,7),nr=4),
widths=c(10,35,45,15),
heights=c(30,30,15,15))
couleurs <- rainbow(75)[1:50]#(50)
ticks <- pretty(coeff)
par(mar=c(1,1,3,1))
plot(aic,k:1-.5,type='o',pch=21,bg='blue',cex=2,axes=F,lty=2,xpd=NA)
points(aic[choix],k-choix+.5,pch=21,cex=4,bg=2,xpd=NA)
title('aic',line=2)
par(mar=c(3,0,0,0))
plot(0,axes=F,xlab='',ylab='',xlim=range(ticks),ylim=c(.1,1))
rect(xleft = min(ticks) + (0:49)/50*(max(ticks)-min(ticks)),
xright = min(ticks) + (1:50)/50*(max(ticks)-min(ticks)),
ytop = rep(1,50),
ybottom= rep(0,50),col=couleurs,border=NA)
axis(1,ticks)
rect(xleft=min(ticks),xright=max(ticks),ytop=1,ybottom=0)
text(mean(coeff,na.rm=T),.5,'coefficients',cex=2,font=2)
par(mar=c(1,1,3,1))
image(1:n,1:k,t(coeff[k:1,]),axes=F,col=couleurs,zlim=range(ticks))
for(i in 1:n) for(j in 1:k) if(!is.na(coeff[j,i])) {
if(pval[j,i]<.01) symb = 'green'
else if( (pval[j,i]<.05) & (pval[j,i]>=.01)) symb = 'orange'
else if( (pval[j,i]<.1) & (pval[j,i]>=.05)) symb = 'red'
else symb = 'black'
polygon(c(i+.5 ,i+.2 ,i+.5 ,i+.5),
c(k-j+0.5,k-j+0.5,k-j+0.8,k-j+0.5),
col=symb)
if(j==choix) {
rect(xleft=i-.5,
xright=i+.5,
ybottom=k-j+1.5,
ytop=k-j+.5,
lwd=4)
text(i,
k-j+1,
round(coeff[j,i],2),
cex=1.2,
font=2)
}
else{
rect(xleft=i-.5,xright=i+.5,ybottom=k-j+1.5,ytop=k-j+.5)
text(i,k-j+1,round(coeff[j,i],2),cex=1.2,font=1)
}
}
axis(3,1:n,noms)
par(mar=c(0.5,0,0,0.5))
plot(0,axes=F,xlab='',ylab='',type='n',xlim=c(0,8),ylim=c(-.2,.8))
cols <- c('green','orange','red','black')
niv <- c('0','0.01','0.05','0.1')
for(i in 0:3){
polygon(c(1+2*i ,1+2*i ,1+2*i-.5 ,1+2*i),
c(.4 ,.7 , .4 , .4),
col=cols[i+1])
text(2*i,0.5,niv[i+1],cex=1.5)
}
text(8,.5,1,cex=1.5)
text(4,0,'p-value',cex=2)
box()
residus <- arimaSelect.out[[3]][[choix]]$res
par(mar=c(1,2,4,1))
acf(residus,main='')
title('acf',line=.5)
par(mar=c(1,2,4,1))
pacf(residus,main='')
title('pacf',line=.5)
par(mar=c(2,2,4,1))
qqnorm(residus,main='')
title('qq-norm',line=.5)
qqline(residus)
residus
}
if (par2 == 0) x <- log(x)
if (par2 != 0) x <- x^par2
(selection <- arimaSelect(x, order=c(par6,par3,par7), seasonal=list(order=c(par8,par4,par9), period=par5)))
bitmap(file='test1.png')
resid <- arimaSelectplot(selection)
dev.off()
resid
bitmap(file='test2.png')
acf(resid,length(resid)/2, main='Residual Autocorrelation Function')
dev.off()
bitmap(file='test3.png')
pacf(resid,length(resid)/2, main='Residual Partial Autocorrelation Function')
dev.off()
bitmap(file='test4.png')
cpgram(resid, main='Residual Cumulative Periodogram')
dev.off()
bitmap(file='test5.png')
hist(resid, main='Residual Histogram', xlab='values of Residuals')
dev.off()
bitmap(file='test6.png')
densityplot(~resid,col='black',main='Residual Density Plot', xlab='values of Residuals')
dev.off()
bitmap(file='test7.png')
qqnorm(resid, main='Residual Normal Q-Q Plot')
qqline(resid)
dev.off()
ncols <- length(selection[[1]][1,])
nrows <- length(selection[[2]][,1])-1
load(file='createtable')
a<-table.start()
a<-table.row.start(a)
a<-table.element(a,'ARIMA Parameter Estimation and Backward Selection', ncols+1,TRUE)
a<-table.row.end(a)
a<-table.row.start(a)
a<-table.element(a,'Iteration', header=TRUE)
for (i in 1:ncols) {
a<-table.element(a,names(selection[[3]][[1]]$coef)[i],header=TRUE)
}
a<-table.row.end(a)
for (j in 1:nrows) {
a<-table.row.start(a)
mydum <- 'Estimates ('
mydum <- paste(mydum,j)
mydum <- paste(mydum,')')
a<-table.element(a,mydum, header=TRUE)
for (i in 1:ncols) {
a<-table.element(a,round(selection[[1]][j,i],4))
}
a<-table.row.end(a)
a<-table.row.start(a)
a<-table.element(a,'(p-val)', header=TRUE)
for (i in 1:ncols) {
mydum <- '('
mydum <- paste(mydum,round(selection[[2]][j,i],4),sep='')
mydum <- paste(mydum,')')
a<-table.element(a,mydum)
}
a<-table.row.end(a)
}
a<-table.end(a)
table.save(a,file='mytable.tab')
a<-table.start()
a<-table.row.start(a)
a<-table.element(a,'Estimated ARIMA Residuals', 1,TRUE)
a<-table.row.end(a)
a<-table.row.start(a)
a<-table.element(a,'Value', 1,TRUE)
a<-table.row.end(a)
for (i in (par4*par5+par3):length(resid)) {
a<-table.row.start(a)
a<-table.element(a,resid[i])
a<-table.row.end(a)
}
a<-table.end(a)
table.save(a,file='mytable1.tab')