Free Statistics

of Irreproducible Research!

Author's title

Author*Unverified author*
R Software Modulerwasp_multipleregression.wasp
Title produced by softwareMultiple Regression
Date of computationTue, 16 Dec 2008 13:13:56 -0700
Cite this page as followsStatistical Computations at FreeStatistics.org, Office for Research Development and Education, URL https://freestatistics.org/blog/index.php?v=date/2008/Dec/16/t1229458492hm23d7lqyq2qdqc.htm/, Retrieved Wed, 15 May 2024 06:14:30 +0000
Statistical Computations at FreeStatistics.org, Office for Research Development and Education, URL https://freestatistics.org/blog/index.php?pk=34169, Retrieved Wed, 15 May 2024 06:14:30 +0000
QR Codes:

Original text written by user:
IsPrivate?No (this computation is public)
User-defined keywords
Estimated Impact232
Family? (F = Feedback message, R = changed R code, M = changed R Module, P = changed Parameters, D = changed Data)
-       [Multiple Regression] [Multiple Regressi...] [2008-12-16 20:13:56] [d41d8cd98f00b204e9800998ecf8427e] [Current]
Feedback Forum

Post a new message
Dataseries X:
28.24	1969.6	111.5	3796
29.58	2061.41	112	3711
26.95	2093.48	111.9	3949
29.08	2120.88	111.8	3740
28.76	2174.56	112.2	3243
29.59	2196.72	112.5	4407
30.7	2350.44	114.3	4814
30.52	2440.25	116.9	3908
32.67	2408.64	124.5	5250
33.19	2472.81	130.3	3937
37.13	2407.6	133.4	4004
35.54	2454.62	134.4	5560
37.75	2448.05	134.5	3922
41.84	2497.84	136.3	3759
42.94	2645.64	138	4138
49.14	2756.76	138.8	4634
44.61	2849.27	138.3	3996
40.22	2921.44	138.3	4308
44.23	2981.85	141.2	4142
45.85	3080.58	142.4	4429
53.38	3106.22	141.5	5219
53.26	3119.31	140.9	4929
51.8	3061.26	140.5	5754
55.3	3097.31	140	5592
57.81	3161.69	139.3	4163
63.96	3257.16	138.7	4962
63.77	3277.01	139.1	5208
59.15	3295.32	138.4	4755
56.12	3363.99	138.4	4491
57.42	3494.17	138.5	5732
63.52	3667.03	140.4	5730
61.71	3813.06	140.7	5024
63.01	3917.96	142.2	6056
68.18	3895.51	144.2	4901
72.03	3801.06	145.6	5353
69.75	3570.12	147.5	5578
74.41	3701.61	149.7	4618
74.33	3862.27	151.5	4724
64.24	3970.1	153.8	5011
60.03	4138.52	153.9	5298
59.44	4199.75	154.3	4143
62.5	4290.89	154.9	4617
55.04	4443.91	156.3	4736
58.34	4502.64	156.2	4214
61.92	4356.98	157.7	5112
67.65	4591.27	158.6	4197
67.68	4696.96	159.8	4119
70.3	4621.4	160.2	5104
75.26	4562.84	159.9	4194
71.44	4202.52	160.1	4583
76.36	4296.49	159.2	3790
81.71	4435.23	160.7	5557
92.6	4105.18	158.7	4304
90.6	4116.68	158.6	3838
92.23	3844.49	159	4277
94.09	3720.98	159.7	4951
102.79	3674.4	164.1	4479
109.65	3857.62	165.9	4677
124.05	3801.06	170.4	4274
132.69	3504.37	174.5	4782


Summary of computational transaction
Raw Inputview raw input (R code)
Raw Outputview raw output of R engine
Computing time6 seconds
R Server'George Udny Yule' @ 72.249.76.132

\begin{tabular}{lllllllll}
\hline
Summary of computational transaction \tabularnewline
Raw Input & view raw input (R code)  \tabularnewline
Raw Output & view raw output of R engine  \tabularnewline
Computing time & 6 seconds \tabularnewline
R Server & 'George Udny Yule' @ 72.249.76.132 \tabularnewline
\hline
\end{tabular}
%Source: https://freestatistics.org/blog/index.php?pk=34169&T=0

[TABLE]
[ROW][C]Summary of computational transaction[/C][/ROW]
[ROW][C]Raw Input[/C][C]view raw input (R code) [/C][/ROW]
[ROW][C]Raw Output[/C][C]view raw output of R engine [/C][/ROW]
[ROW][C]Computing time[/C][C]6 seconds[/C][/ROW]
[ROW][C]R Server[/C][C]'George Udny Yule' @ 72.249.76.132[/C][/ROW]
[/TABLE]
Source: https://freestatistics.org/blog/index.php?pk=34169&T=0

Globally Unique Identifier (entire table): ba.freestatistics.org/blog/index.php?pk=34169&T=0

As an alternative you can also use a QR Code:  

The GUIDs for individual cells are displayed in the table below:

Summary of computational transaction
Raw Inputview raw input (R code)
Raw Outputview raw output of R engine
Computing time6 seconds
R Server'George Udny Yule' @ 72.249.76.132


Multiple Linear Regression - Estimated Regression Equation
olie[t] = + 47.950868525666 -0.0223120146777083Bel20[t] + 0.0211610369424831Metaal[t] + 0.00437910398233475bouwaanvragen[t] + 4.14482496021094M1[t] + 2.82658129900088M2[t] + 0.823853361633086M3[t] + 0.114628069556997M4[t] + 1.60986689727842M5[t] -1.65009307396808M6[t] -2.19996647120571M7[t] -1.12002279828299M8[t] -2.17769483427941M9[t] + 4.47415130022531M10[t] + 4.98715599900658M11[t] + 2.08941443458687t + e[t]

\begin{tabular}{lllllllll}
\hline
Multiple Linear Regression - Estimated Regression Equation \tabularnewline
olie[t] =  +  47.950868525666 -0.0223120146777083Bel20[t] +  0.0211610369424831Metaal[t] +  0.00437910398233475bouwaanvragen[t] +  4.14482496021094M1[t] +  2.82658129900088M2[t] +  0.823853361633086M3[t] +  0.114628069556997M4[t] +  1.60986689727842M5[t] -1.65009307396808M6[t] -2.19996647120571M7[t] -1.12002279828299M8[t] -2.17769483427941M9[t] +  4.47415130022531M10[t] +  4.98715599900658M11[t] +  2.08941443458687t  + e[t] \tabularnewline
\hline
\end{tabular}
%Source: https://freestatistics.org/blog/index.php?pk=34169&T=1

[TABLE]
[ROW][C]Multiple Linear Regression - Estimated Regression Equation[/C][/ROW]
[ROW][C]olie[t] =  +  47.950868525666 -0.0223120146777083Bel20[t] +  0.0211610369424831Metaal[t] +  0.00437910398233475bouwaanvragen[t] +  4.14482496021094M1[t] +  2.82658129900088M2[t] +  0.823853361633086M3[t] +  0.114628069556997M4[t] +  1.60986689727842M5[t] -1.65009307396808M6[t] -2.19996647120571M7[t] -1.12002279828299M8[t] -2.17769483427941M9[t] +  4.47415130022531M10[t] +  4.98715599900658M11[t] +  2.08941443458687t  + e[t][/C][/ROW]
[/TABLE]
Source: https://freestatistics.org/blog/index.php?pk=34169&T=1

Globally Unique Identifier (entire table): ba.freestatistics.org/blog/index.php?pk=34169&T=1

As an alternative you can also use a QR Code:  

The GUIDs for individual cells are displayed in the table below:

Multiple Linear Regression - Estimated Regression Equation
olie[t] = + 47.950868525666 -0.0223120146777083Bel20[t] + 0.0211610369424831Metaal[t] + 0.00437910398233475bouwaanvragen[t] + 4.14482496021094M1[t] + 2.82658129900088M2[t] + 0.823853361633086M3[t] + 0.114628069556997M4[t] + 1.60986689727842M5[t] -1.65009307396808M6[t] -2.19996647120571M7[t] -1.12002279828299M8[t] -2.17769483427941M9[t] + 4.47415130022531M10[t] + 4.98715599900658M11[t] + 2.08941443458687t + e[t]


Multiple Linear Regression - Ordinary Least Squares
VariableParameterS.D.T-STATH0: parameter = 02-tail p-value1-tail p-value
(Intercept)47.95086852566622.2953892.15070.0370320.018516
Bel20-0.02231201467770830.002459-9.075400
Metaal0.02116103694248310.1733270.12210.9033860.451693
bouwaanvragen0.004379103982334750.0016392.6710.010560.00528
M14.144824960210944.4115050.93950.3525780.176289
M22.826581299000884.2490830.66520.5093810.25469
M30.8238533616330864.2303040.19480.8464850.423242
M40.1146280695569974.0820930.02810.9777250.488862
M51.609866897278424.5656530.35260.7260690.363034
M6-1.650093073968084.24273-0.38890.6992090.349605
M7-2.199966471205714.135717-0.53190.5974410.298721
M8-1.120022798282994.264154-0.26270.7940390.397019
M9-2.177694834279413.903831-0.55780.5797840.289892
M104.474151300225314.1578831.07610.2877630.143882
M114.987155999006584.0147841.24220.2207440.110372
t2.089414434586870.16972312.310700

\begin{tabular}{lllllllll}
\hline
Multiple Linear Regression - Ordinary Least Squares \tabularnewline
Variable & Parameter & S.D. & T-STATH0: parameter = 0 & 2-tail p-value & 1-tail p-value \tabularnewline
(Intercept) & 47.950868525666 & 22.295389 & 2.1507 & 0.037032 & 0.018516 \tabularnewline
Bel20 & -0.0223120146777083 & 0.002459 & -9.0754 & 0 & 0 \tabularnewline
Metaal & 0.0211610369424831 & 0.173327 & 0.1221 & 0.903386 & 0.451693 \tabularnewline
bouwaanvragen & 0.00437910398233475 & 0.001639 & 2.671 & 0.01056 & 0.00528 \tabularnewline
M1 & 4.14482496021094 & 4.411505 & 0.9395 & 0.352578 & 0.176289 \tabularnewline
M2 & 2.82658129900088 & 4.249083 & 0.6652 & 0.509381 & 0.25469 \tabularnewline
M3 & 0.823853361633086 & 4.230304 & 0.1948 & 0.846485 & 0.423242 \tabularnewline
M4 & 0.114628069556997 & 4.082093 & 0.0281 & 0.977725 & 0.488862 \tabularnewline
M5 & 1.60986689727842 & 4.565653 & 0.3526 & 0.726069 & 0.363034 \tabularnewline
M6 & -1.65009307396808 & 4.24273 & -0.3889 & 0.699209 & 0.349605 \tabularnewline
M7 & -2.19996647120571 & 4.135717 & -0.5319 & 0.597441 & 0.298721 \tabularnewline
M8 & -1.12002279828299 & 4.264154 & -0.2627 & 0.794039 & 0.397019 \tabularnewline
M9 & -2.17769483427941 & 3.903831 & -0.5578 & 0.579784 & 0.289892 \tabularnewline
M10 & 4.47415130022531 & 4.157883 & 1.0761 & 0.287763 & 0.143882 \tabularnewline
M11 & 4.98715599900658 & 4.014784 & 1.2422 & 0.220744 & 0.110372 \tabularnewline
t & 2.08941443458687 & 0.169723 & 12.3107 & 0 & 0 \tabularnewline
\hline
\end{tabular}
%Source: https://freestatistics.org/blog/index.php?pk=34169&T=2

[TABLE]
[ROW][C]Multiple Linear Regression - Ordinary Least Squares[/C][/ROW]
[ROW][C]Variable[/C][C]Parameter[/C][C]S.D.[/C][C]T-STATH0: parameter = 0[/C][C]2-tail p-value[/C][C]1-tail p-value[/C][/ROW]
[ROW][C](Intercept)[/C][C]47.950868525666[/C][C]22.295389[/C][C]2.1507[/C][C]0.037032[/C][C]0.018516[/C][/ROW]
[ROW][C]Bel20[/C][C]-0.0223120146777083[/C][C]0.002459[/C][C]-9.0754[/C][C]0[/C][C]0[/C][/ROW]
[ROW][C]Metaal[/C][C]0.0211610369424831[/C][C]0.173327[/C][C]0.1221[/C][C]0.903386[/C][C]0.451693[/C][/ROW]
[ROW][C]bouwaanvragen[/C][C]0.00437910398233475[/C][C]0.001639[/C][C]2.671[/C][C]0.01056[/C][C]0.00528[/C][/ROW]
[ROW][C]M1[/C][C]4.14482496021094[/C][C]4.411505[/C][C]0.9395[/C][C]0.352578[/C][C]0.176289[/C][/ROW]
[ROW][C]M2[/C][C]2.82658129900088[/C][C]4.249083[/C][C]0.6652[/C][C]0.509381[/C][C]0.25469[/C][/ROW]
[ROW][C]M3[/C][C]0.823853361633086[/C][C]4.230304[/C][C]0.1948[/C][C]0.846485[/C][C]0.423242[/C][/ROW]
[ROW][C]M4[/C][C]0.114628069556997[/C][C]4.082093[/C][C]0.0281[/C][C]0.977725[/C][C]0.488862[/C][/ROW]
[ROW][C]M5[/C][C]1.60986689727842[/C][C]4.565653[/C][C]0.3526[/C][C]0.726069[/C][C]0.363034[/C][/ROW]
[ROW][C]M6[/C][C]-1.65009307396808[/C][C]4.24273[/C][C]-0.3889[/C][C]0.699209[/C][C]0.349605[/C][/ROW]
[ROW][C]M7[/C][C]-2.19996647120571[/C][C]4.135717[/C][C]-0.5319[/C][C]0.597441[/C][C]0.298721[/C][/ROW]
[ROW][C]M8[/C][C]-1.12002279828299[/C][C]4.264154[/C][C]-0.2627[/C][C]0.794039[/C][C]0.397019[/C][/ROW]
[ROW][C]M9[/C][C]-2.17769483427941[/C][C]3.903831[/C][C]-0.5578[/C][C]0.579784[/C][C]0.289892[/C][/ROW]
[ROW][C]M10[/C][C]4.47415130022531[/C][C]4.157883[/C][C]1.0761[/C][C]0.287763[/C][C]0.143882[/C][/ROW]
[ROW][C]M11[/C][C]4.98715599900658[/C][C]4.014784[/C][C]1.2422[/C][C]0.220744[/C][C]0.110372[/C][/ROW]
[ROW][C]t[/C][C]2.08941443458687[/C][C]0.169723[/C][C]12.3107[/C][C]0[/C][C]0[/C][/ROW]
[/TABLE]
Source: https://freestatistics.org/blog/index.php?pk=34169&T=2

Globally Unique Identifier (entire table): ba.freestatistics.org/blog/index.php?pk=34169&T=2

As an alternative you can also use a QR Code:  

The GUIDs for individual cells are displayed in the table below:

Multiple Linear Regression - Ordinary Least Squares
VariableParameterS.D.T-STATH0: parameter = 02-tail p-value1-tail p-value
(Intercept)47.95086852566622.2953892.15070.0370320.018516
Bel20-0.02231201467770830.002459-9.075400
Metaal0.02116103694248310.1733270.12210.9033860.451693
bouwaanvragen0.004379103982334750.0016392.6710.010560.00528
M14.144824960210944.4115050.93950.3525780.176289
M22.826581299000884.2490830.66520.5093810.25469
M30.8238533616330864.2303040.19480.8464850.423242
M40.1146280695569974.0820930.02810.9777250.488862
M51.609866897278424.5656530.35260.7260690.363034
M6-1.650093073968084.24273-0.38890.6992090.349605
M7-2.199966471205714.135717-0.53190.5974410.298721
M8-1.120022798282994.264154-0.26270.7940390.397019
M9-2.177694834279413.903831-0.55780.5797840.289892
M104.474151300225314.1578831.07610.2877630.143882
M114.987155999006584.0147841.24220.2207440.110372
t2.089414434586870.16972312.310700


Multiple Linear Regression - Regression Statistics
Multiple R0.975007393121551
R-squared0.950639416641684
Adjusted R-squared0.933811945042258
F-TEST (value)56.493300911238
F-TEST (DF numerator)15
F-TEST (DF denominator)44
p-value0
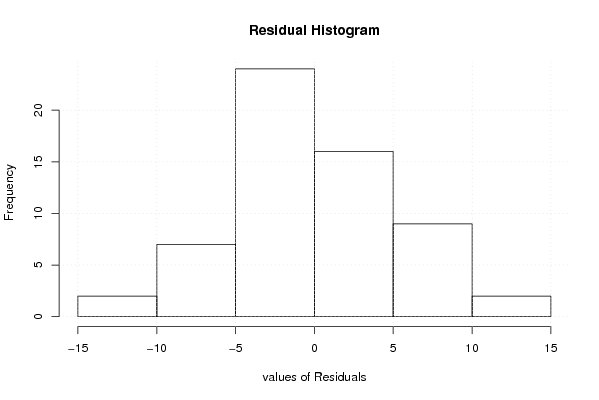
Multiple Linear Regression - Residual Statistics
Residual Standard Deviation6.06149239613482
Sum Squared Residuals1616.63436300961

\begin{tabular}{lllllllll}
\hline
Multiple Linear Regression - Regression Statistics \tabularnewline
Multiple R & 0.975007393121551 \tabularnewline
R-squared & 0.950639416641684 \tabularnewline
Adjusted R-squared & 0.933811945042258 \tabularnewline
F-TEST (value) & 56.493300911238 \tabularnewline
F-TEST (DF numerator) & 15 \tabularnewline
F-TEST (DF denominator) & 44 \tabularnewline
p-value & 0 \tabularnewline
Multiple Linear Regression - Residual Statistics \tabularnewline
Residual Standard Deviation & 6.06149239613482 \tabularnewline
Sum Squared Residuals & 1616.63436300961 \tabularnewline
\hline
\end{tabular}
%Source: https://freestatistics.org/blog/index.php?pk=34169&T=3

[TABLE]
[ROW][C]Multiple Linear Regression - Regression Statistics[/C][/ROW]
[ROW][C]Multiple R[/C][C]0.975007393121551[/C][/ROW]
[ROW][C]R-squared[/C][C]0.950639416641684[/C][/ROW]
[ROW][C]Adjusted R-squared[/C][C]0.933811945042258[/C][/ROW]
[ROW][C]F-TEST (value)[/C][C]56.493300911238[/C][/ROW]
[ROW][C]F-TEST (DF numerator)[/C][C]15[/C][/ROW]
[ROW][C]F-TEST (DF denominator)[/C][C]44[/C][/ROW]
[ROW][C]p-value[/C][C]0[/C][/ROW]
[ROW][C]Multiple Linear Regression - Residual Statistics[/C][/ROW]
[ROW][C]Residual Standard Deviation[/C][C]6.06149239613482[/C][/ROW]
[ROW][C]Sum Squared Residuals[/C][C]1616.63436300961[/C][/ROW]
[/TABLE]
Source: https://freestatistics.org/blog/index.php?pk=34169&T=3

Globally Unique Identifier (entire table): ba.freestatistics.org/blog/index.php?pk=34169&T=3

As an alternative you can also use a QR Code:  

The GUIDs for individual cells are displayed in the table below:

Multiple Linear Regression - Regression Statistics
Multiple R0.975007393121551
R-squared0.950639416641684
Adjusted R-squared0.933811945042258
F-TEST (value)56.493300911238
F-TEST (DF numerator)15
F-TEST (DF denominator)44
p-value0
Multiple Linear Regression - Residual Statistics
Residual Standard Deviation6.06149239613482
Sum Squared Residuals1616.63436300961


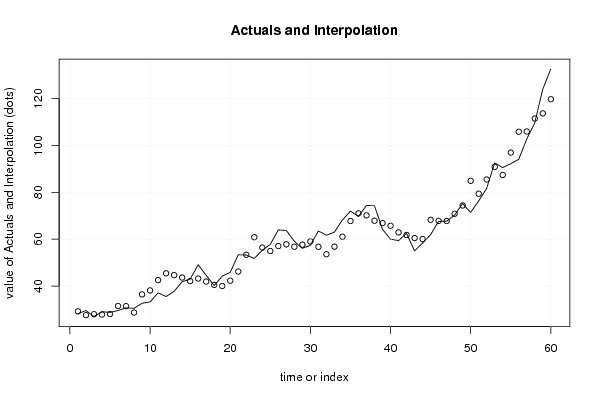
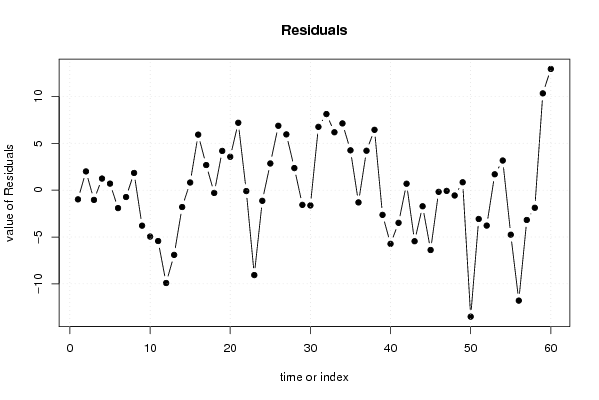
Multiple Linear Regression - Actuals, Interpolation, and Residuals
Time or IndexActualsInterpolationForecastResidualsPrediction Error
128.2429.2218981472794-0.981898147279352
229.5827.58295953306821.99704046693175
326.9527.9942103636747-1.04421036367473
429.0827.84570146801411.23429853198591
528.7628.06469551797960.69530448202037
629.5931.5033410825824-1.91334108258238
730.731.433464410981-0.733464410981009
830.5228.68653096834081.83346903165922
932.6736.4611375759497-3.7911375759497
1033.1938.1436066486336-4.9536066486336
1137.1342.5599914404732-5.42999144047323
1235.5445.448185779363-9.90818577936302
1337.7544.6581588912233-6.9081588912233
1441.8443.6427103711729-1.80271037117291
1542.9442.12733527113380.812664728866192
1649.1443.21717774744965.92282225255036
1744.6141.93329767272232.67670232727766
1840.2240.5187744792609-0.298774479260949
1944.2340.04488245599544.18511754400454
2045.8542.29357144163593.55642855836405
2153.3846.19368099668627.18631900331381
2253.2653.360240516604-0.100240516603996
2351.860.8621684726623-9.06216847266227
2455.356.4400834155017-1.14008341550171
2557.8154.96532298873262.84467701126744
2663.9657.09257318054856.86742681945147
2763.7757.82209018084645.94790981915357
2859.1556.7951995047512.35480049524899
2956.1257.6916032678047-1.57160326780471
3057.4259.0530638061727-1.63306380617267
3163.5256.76719774855936.75280225144071
3261.7153.59303325223768.11696674776244
3363.0156.83522217631966.1747778236804
3468.1861.0618444492147.11815555078595
3572.0367.78061382062654.24938617937348
3669.7571.0611132920928-1.31111329209281
3774.4170.20416033515084.20583966484915
3874.3367.8929577190316.437042280969
3964.2466.8792129014506-2.63921290145057
4060.0365.760531478566-5.73053147856603
4159.4462.9296193973386-3.48961939733861
4262.561.81394875274480.686051247255202
4355.0460.4900441297284-5.45004412972844
4458.3460.0610092327432-1.72100923274321
4561.9268.306896620839-6.386896620839
4667.6567.8328400605022-0.18284006050222
4767.6867.7609254962922-0.080925496292241
4870.370.8709615982969-0.570961598296917
4975.2674.4204596376140.839540362386068
5071.4484.9387991961793-13.4987991961793
5176.3679.4371512828945-3.07715128289446
5281.7185.4913898012192-3.78138980121923
5392.690.91078414415471.68921585584528
5490.687.44087187923923.1591281207608
5592.2396.9844112547358-4.75441125473581
5694.09105.875855105043-11.7858551050425
57102.79105.973062630206-3.18306263020552
58109.65111.531468325046-1.88146832504615
59124.05113.72630076994610.3236992300543
60132.69119.75965591474612.9303440852545

\begin{tabular}{lllllllll}
\hline
Multiple Linear Regression - Actuals, Interpolation, and Residuals \tabularnewline
Time or Index & Actuals & InterpolationForecast & ResidualsPrediction Error \tabularnewline
1 & 28.24 & 29.2218981472794 & -0.981898147279352 \tabularnewline
2 & 29.58 & 27.5829595330682 & 1.99704046693175 \tabularnewline
3 & 26.95 & 27.9942103636747 & -1.04421036367473 \tabularnewline
4 & 29.08 & 27.8457014680141 & 1.23429853198591 \tabularnewline
5 & 28.76 & 28.0646955179796 & 0.69530448202037 \tabularnewline
6 & 29.59 & 31.5033410825824 & -1.91334108258238 \tabularnewline
7 & 30.7 & 31.433464410981 & -0.733464410981009 \tabularnewline
8 & 30.52 & 28.6865309683408 & 1.83346903165922 \tabularnewline
9 & 32.67 & 36.4611375759497 & -3.7911375759497 \tabularnewline
10 & 33.19 & 38.1436066486336 & -4.9536066486336 \tabularnewline
11 & 37.13 & 42.5599914404732 & -5.42999144047323 \tabularnewline
12 & 35.54 & 45.448185779363 & -9.90818577936302 \tabularnewline
13 & 37.75 & 44.6581588912233 & -6.9081588912233 \tabularnewline
14 & 41.84 & 43.6427103711729 & -1.80271037117291 \tabularnewline
15 & 42.94 & 42.1273352711338 & 0.812664728866192 \tabularnewline
16 & 49.14 & 43.2171777474496 & 5.92282225255036 \tabularnewline
17 & 44.61 & 41.9332976727223 & 2.67670232727766 \tabularnewline
18 & 40.22 & 40.5187744792609 & -0.298774479260949 \tabularnewline
19 & 44.23 & 40.0448824559954 & 4.18511754400454 \tabularnewline
20 & 45.85 & 42.2935714416359 & 3.55642855836405 \tabularnewline
21 & 53.38 & 46.1936809966862 & 7.18631900331381 \tabularnewline
22 & 53.26 & 53.360240516604 & -0.100240516603996 \tabularnewline
23 & 51.8 & 60.8621684726623 & -9.06216847266227 \tabularnewline
24 & 55.3 & 56.4400834155017 & -1.14008341550171 \tabularnewline
25 & 57.81 & 54.9653229887326 & 2.84467701126744 \tabularnewline
26 & 63.96 & 57.0925731805485 & 6.86742681945147 \tabularnewline
27 & 63.77 & 57.8220901808464 & 5.94790981915357 \tabularnewline
28 & 59.15 & 56.795199504751 & 2.35480049524899 \tabularnewline
29 & 56.12 & 57.6916032678047 & -1.57160326780471 \tabularnewline
30 & 57.42 & 59.0530638061727 & -1.63306380617267 \tabularnewline
31 & 63.52 & 56.7671977485593 & 6.75280225144071 \tabularnewline
32 & 61.71 & 53.5930332522376 & 8.11696674776244 \tabularnewline
33 & 63.01 & 56.8352221763196 & 6.1747778236804 \tabularnewline
34 & 68.18 & 61.061844449214 & 7.11815555078595 \tabularnewline
35 & 72.03 & 67.7806138206265 & 4.24938617937348 \tabularnewline
36 & 69.75 & 71.0611132920928 & -1.31111329209281 \tabularnewline
37 & 74.41 & 70.2041603351508 & 4.20583966484915 \tabularnewline
38 & 74.33 & 67.892957719031 & 6.437042280969 \tabularnewline
39 & 64.24 & 66.8792129014506 & -2.63921290145057 \tabularnewline
40 & 60.03 & 65.760531478566 & -5.73053147856603 \tabularnewline
41 & 59.44 & 62.9296193973386 & -3.48961939733861 \tabularnewline
42 & 62.5 & 61.8139487527448 & 0.686051247255202 \tabularnewline
43 & 55.04 & 60.4900441297284 & -5.45004412972844 \tabularnewline
44 & 58.34 & 60.0610092327432 & -1.72100923274321 \tabularnewline
45 & 61.92 & 68.306896620839 & -6.386896620839 \tabularnewline
46 & 67.65 & 67.8328400605022 & -0.18284006050222 \tabularnewline
47 & 67.68 & 67.7609254962922 & -0.080925496292241 \tabularnewline
48 & 70.3 & 70.8709615982969 & -0.570961598296917 \tabularnewline
49 & 75.26 & 74.420459637614 & 0.839540362386068 \tabularnewline
50 & 71.44 & 84.9387991961793 & -13.4987991961793 \tabularnewline
51 & 76.36 & 79.4371512828945 & -3.07715128289446 \tabularnewline
52 & 81.71 & 85.4913898012192 & -3.78138980121923 \tabularnewline
53 & 92.6 & 90.9107841441547 & 1.68921585584528 \tabularnewline
54 & 90.6 & 87.4408718792392 & 3.1591281207608 \tabularnewline
55 & 92.23 & 96.9844112547358 & -4.75441125473581 \tabularnewline
56 & 94.09 & 105.875855105043 & -11.7858551050425 \tabularnewline
57 & 102.79 & 105.973062630206 & -3.18306263020552 \tabularnewline
58 & 109.65 & 111.531468325046 & -1.88146832504615 \tabularnewline
59 & 124.05 & 113.726300769946 & 10.3236992300543 \tabularnewline
60 & 132.69 & 119.759655914746 & 12.9303440852545 \tabularnewline
\hline
\end{tabular}
%Source: https://freestatistics.org/blog/index.php?pk=34169&T=4

[TABLE]
[ROW][C]Multiple Linear Regression - Actuals, Interpolation, and Residuals[/C][/ROW]
[ROW][C]Time or Index[/C][C]Actuals[/C][C]InterpolationForecast[/C][C]ResidualsPrediction Error[/C][/ROW]
[ROW][C]1[/C][C]28.24[/C][C]29.2218981472794[/C][C]-0.981898147279352[/C][/ROW]
[ROW][C]2[/C][C]29.58[/C][C]27.5829595330682[/C][C]1.99704046693175[/C][/ROW]
[ROW][C]3[/C][C]26.95[/C][C]27.9942103636747[/C][C]-1.04421036367473[/C][/ROW]
[ROW][C]4[/C][C]29.08[/C][C]27.8457014680141[/C][C]1.23429853198591[/C][/ROW]
[ROW][C]5[/C][C]28.76[/C][C]28.0646955179796[/C][C]0.69530448202037[/C][/ROW]
[ROW][C]6[/C][C]29.59[/C][C]31.5033410825824[/C][C]-1.91334108258238[/C][/ROW]
[ROW][C]7[/C][C]30.7[/C][C]31.433464410981[/C][C]-0.733464410981009[/C][/ROW]
[ROW][C]8[/C][C]30.52[/C][C]28.6865309683408[/C][C]1.83346903165922[/C][/ROW]
[ROW][C]9[/C][C]32.67[/C][C]36.4611375759497[/C][C]-3.7911375759497[/C][/ROW]
[ROW][C]10[/C][C]33.19[/C][C]38.1436066486336[/C][C]-4.9536066486336[/C][/ROW]
[ROW][C]11[/C][C]37.13[/C][C]42.5599914404732[/C][C]-5.42999144047323[/C][/ROW]
[ROW][C]12[/C][C]35.54[/C][C]45.448185779363[/C][C]-9.90818577936302[/C][/ROW]
[ROW][C]13[/C][C]37.75[/C][C]44.6581588912233[/C][C]-6.9081588912233[/C][/ROW]
[ROW][C]14[/C][C]41.84[/C][C]43.6427103711729[/C][C]-1.80271037117291[/C][/ROW]
[ROW][C]15[/C][C]42.94[/C][C]42.1273352711338[/C][C]0.812664728866192[/C][/ROW]
[ROW][C]16[/C][C]49.14[/C][C]43.2171777474496[/C][C]5.92282225255036[/C][/ROW]
[ROW][C]17[/C][C]44.61[/C][C]41.9332976727223[/C][C]2.67670232727766[/C][/ROW]
[ROW][C]18[/C][C]40.22[/C][C]40.5187744792609[/C][C]-0.298774479260949[/C][/ROW]
[ROW][C]19[/C][C]44.23[/C][C]40.0448824559954[/C][C]4.18511754400454[/C][/ROW]
[ROW][C]20[/C][C]45.85[/C][C]42.2935714416359[/C][C]3.55642855836405[/C][/ROW]
[ROW][C]21[/C][C]53.38[/C][C]46.1936809966862[/C][C]7.18631900331381[/C][/ROW]
[ROW][C]22[/C][C]53.26[/C][C]53.360240516604[/C][C]-0.100240516603996[/C][/ROW]
[ROW][C]23[/C][C]51.8[/C][C]60.8621684726623[/C][C]-9.06216847266227[/C][/ROW]
[ROW][C]24[/C][C]55.3[/C][C]56.4400834155017[/C][C]-1.14008341550171[/C][/ROW]
[ROW][C]25[/C][C]57.81[/C][C]54.9653229887326[/C][C]2.84467701126744[/C][/ROW]
[ROW][C]26[/C][C]63.96[/C][C]57.0925731805485[/C][C]6.86742681945147[/C][/ROW]
[ROW][C]27[/C][C]63.77[/C][C]57.8220901808464[/C][C]5.94790981915357[/C][/ROW]
[ROW][C]28[/C][C]59.15[/C][C]56.795199504751[/C][C]2.35480049524899[/C][/ROW]
[ROW][C]29[/C][C]56.12[/C][C]57.6916032678047[/C][C]-1.57160326780471[/C][/ROW]
[ROW][C]30[/C][C]57.42[/C][C]59.0530638061727[/C][C]-1.63306380617267[/C][/ROW]
[ROW][C]31[/C][C]63.52[/C][C]56.7671977485593[/C][C]6.75280225144071[/C][/ROW]
[ROW][C]32[/C][C]61.71[/C][C]53.5930332522376[/C][C]8.11696674776244[/C][/ROW]
[ROW][C]33[/C][C]63.01[/C][C]56.8352221763196[/C][C]6.1747778236804[/C][/ROW]
[ROW][C]34[/C][C]68.18[/C][C]61.061844449214[/C][C]7.11815555078595[/C][/ROW]
[ROW][C]35[/C][C]72.03[/C][C]67.7806138206265[/C][C]4.24938617937348[/C][/ROW]
[ROW][C]36[/C][C]69.75[/C][C]71.0611132920928[/C][C]-1.31111329209281[/C][/ROW]
[ROW][C]37[/C][C]74.41[/C][C]70.2041603351508[/C][C]4.20583966484915[/C][/ROW]
[ROW][C]38[/C][C]74.33[/C][C]67.892957719031[/C][C]6.437042280969[/C][/ROW]
[ROW][C]39[/C][C]64.24[/C][C]66.8792129014506[/C][C]-2.63921290145057[/C][/ROW]
[ROW][C]40[/C][C]60.03[/C][C]65.760531478566[/C][C]-5.73053147856603[/C][/ROW]
[ROW][C]41[/C][C]59.44[/C][C]62.9296193973386[/C][C]-3.48961939733861[/C][/ROW]
[ROW][C]42[/C][C]62.5[/C][C]61.8139487527448[/C][C]0.686051247255202[/C][/ROW]
[ROW][C]43[/C][C]55.04[/C][C]60.4900441297284[/C][C]-5.45004412972844[/C][/ROW]
[ROW][C]44[/C][C]58.34[/C][C]60.0610092327432[/C][C]-1.72100923274321[/C][/ROW]
[ROW][C]45[/C][C]61.92[/C][C]68.306896620839[/C][C]-6.386896620839[/C][/ROW]
[ROW][C]46[/C][C]67.65[/C][C]67.8328400605022[/C][C]-0.18284006050222[/C][/ROW]
[ROW][C]47[/C][C]67.68[/C][C]67.7609254962922[/C][C]-0.080925496292241[/C][/ROW]
[ROW][C]48[/C][C]70.3[/C][C]70.8709615982969[/C][C]-0.570961598296917[/C][/ROW]
[ROW][C]49[/C][C]75.26[/C][C]74.420459637614[/C][C]0.839540362386068[/C][/ROW]
[ROW][C]50[/C][C]71.44[/C][C]84.9387991961793[/C][C]-13.4987991961793[/C][/ROW]
[ROW][C]51[/C][C]76.36[/C][C]79.4371512828945[/C][C]-3.07715128289446[/C][/ROW]
[ROW][C]52[/C][C]81.71[/C][C]85.4913898012192[/C][C]-3.78138980121923[/C][/ROW]
[ROW][C]53[/C][C]92.6[/C][C]90.9107841441547[/C][C]1.68921585584528[/C][/ROW]
[ROW][C]54[/C][C]90.6[/C][C]87.4408718792392[/C][C]3.1591281207608[/C][/ROW]
[ROW][C]55[/C][C]92.23[/C][C]96.9844112547358[/C][C]-4.75441125473581[/C][/ROW]
[ROW][C]56[/C][C]94.09[/C][C]105.875855105043[/C][C]-11.7858551050425[/C][/ROW]
[ROW][C]57[/C][C]102.79[/C][C]105.973062630206[/C][C]-3.18306263020552[/C][/ROW]
[ROW][C]58[/C][C]109.65[/C][C]111.531468325046[/C][C]-1.88146832504615[/C][/ROW]
[ROW][C]59[/C][C]124.05[/C][C]113.726300769946[/C][C]10.3236992300543[/C][/ROW]
[ROW][C]60[/C][C]132.69[/C][C]119.759655914746[/C][C]12.9303440852545[/C][/ROW]
[/TABLE]
Source: https://freestatistics.org/blog/index.php?pk=34169&T=4

Globally Unique Identifier (entire table): ba.freestatistics.org/blog/index.php?pk=34169&T=4

As an alternative you can also use a QR Code:  

The GUIDs for individual cells are displayed in the table below:

Multiple Linear Regression - Actuals, Interpolation, and Residuals
Time or IndexActualsInterpolationForecastResidualsPrediction Error
128.2429.2218981472794-0.981898147279352
229.5827.58295953306821.99704046693175
326.9527.9942103636747-1.04421036367473
429.0827.84570146801411.23429853198591
528.7628.06469551797960.69530448202037
629.5931.5033410825824-1.91334108258238
730.731.433464410981-0.733464410981009
830.5228.68653096834081.83346903165922
932.6736.4611375759497-3.7911375759497
1033.1938.1436066486336-4.9536066486336
1137.1342.5599914404732-5.42999144047323
1235.5445.448185779363-9.90818577936302
1337.7544.6581588912233-6.9081588912233
1441.8443.6427103711729-1.80271037117291
1542.9442.12733527113380.812664728866192
1649.1443.21717774744965.92282225255036
1744.6141.93329767272232.67670232727766
1840.2240.5187744792609-0.298774479260949
1944.2340.04488245599544.18511754400454
2045.8542.29357144163593.55642855836405
2153.3846.19368099668627.18631900331381
2253.2653.360240516604-0.100240516603996
2351.860.8621684726623-9.06216847266227
2455.356.4400834155017-1.14008341550171
2557.8154.96532298873262.84467701126744
2663.9657.09257318054856.86742681945147
2763.7757.82209018084645.94790981915357
2859.1556.7951995047512.35480049524899
2956.1257.6916032678047-1.57160326780471
3057.4259.0530638061727-1.63306380617267
3163.5256.76719774855936.75280225144071
3261.7153.59303325223768.11696674776244
3363.0156.83522217631966.1747778236804
3468.1861.0618444492147.11815555078595
3572.0367.78061382062654.24938617937348
3669.7571.0611132920928-1.31111329209281
3774.4170.20416033515084.20583966484915
3874.3367.8929577190316.437042280969
3964.2466.8792129014506-2.63921290145057
4060.0365.760531478566-5.73053147856603
4159.4462.9296193973386-3.48961939733861
4262.561.81394875274480.686051247255202
4355.0460.4900441297284-5.45004412972844
4458.3460.0610092327432-1.72100923274321
4561.9268.306896620839-6.386896620839
4667.6567.8328400605022-0.18284006050222
4767.6867.7609254962922-0.080925496292241
4870.370.8709615982969-0.570961598296917
4975.2674.4204596376140.839540362386068
5071.4484.9387991961793-13.4987991961793
5176.3679.4371512828945-3.07715128289446
5281.7185.4913898012192-3.78138980121923
5392.690.91078414415471.68921585584528
5490.687.44087187923923.1591281207608
5592.2396.9844112547358-4.75441125473581
5694.09105.875855105043-11.7858551050425
57102.79105.973062630206-3.18306263020552
58109.65111.531468325046-1.88146832504615
59124.05113.72630076994610.3236992300543
60132.69119.75965591474612.9303440852545


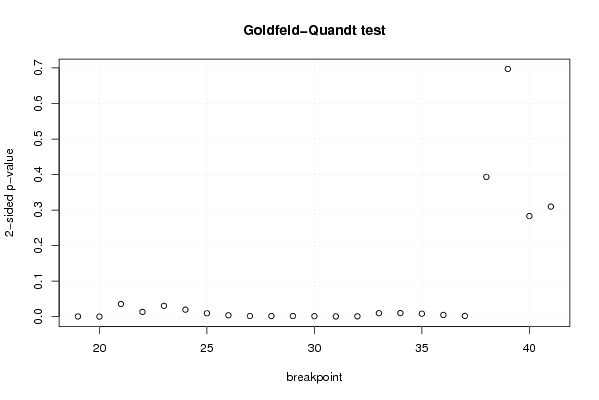
Goldfeld-Quandt test for Heteroskedasticity
p-valuesAlternative Hypothesis
breakpoint indexgreater2-sidedless
190.0003159367837260730.0006318735674521470.999684063216274
206.16936279098246e-050.0001233872558196490.99993830637209
210.01787473086263850.03574946172527690.982125269137362
220.006779400064550640.01355880012910130.99322059993545
230.01529267193899660.03058534387799310.984707328061003
240.009927714643038330.01985542928607670.990072285356962
250.004823739173613150.00964747834722630.995176260826387
260.001978913530640590.003957827061281190.99802108646936
270.0009143689604806530.001828737920961310.99908563103952
280.0008988235548556570.001797647109711310.999101176445144
290.0009270393353447290.001854078670689460.999072960664655
300.000716605520707140.001433211041414280.999283394479293
310.0003707499677198040.0007414999354396080.99962925003228
320.0005266926927748870.001053385385549770.999473307307225
330.004935569409567850.00987113881913570.995064430590432
340.00505427305940270.01010854611880540.994945726940597
350.004204970313388990.008409940626777970.995795029686611
360.002464188548581000.004928377097162010.99753581145142
370.001148635327780980.002297270655561950.99885136467222
380.1965934877947170.3931869755894350.803406512205283
390.6514415388826920.6971169222346160.348558461117308
400.8584123139552360.2831753720895290.141587686044764
410.8451324461984870.3097351076030260.154867553801513

\begin{tabular}{lllllllll}
\hline
Goldfeld-Quandt test for Heteroskedasticity \tabularnewline
p-values & Alternative Hypothesis \tabularnewline
breakpoint index & greater & 2-sided & less \tabularnewline
19 & 0.000315936783726073 & 0.000631873567452147 & 0.999684063216274 \tabularnewline
20 & 6.16936279098246e-05 & 0.000123387255819649 & 0.99993830637209 \tabularnewline
21 & 0.0178747308626385 & 0.0357494617252769 & 0.982125269137362 \tabularnewline
22 & 0.00677940006455064 & 0.0135588001291013 & 0.99322059993545 \tabularnewline
23 & 0.0152926719389966 & 0.0305853438779931 & 0.984707328061003 \tabularnewline
24 & 0.00992771464303833 & 0.0198554292860767 & 0.990072285356962 \tabularnewline
25 & 0.00482373917361315 & 0.0096474783472263 & 0.995176260826387 \tabularnewline
26 & 0.00197891353064059 & 0.00395782706128119 & 0.99802108646936 \tabularnewline
27 & 0.000914368960480653 & 0.00182873792096131 & 0.99908563103952 \tabularnewline
28 & 0.000898823554855657 & 0.00179764710971131 & 0.999101176445144 \tabularnewline
29 & 0.000927039335344729 & 0.00185407867068946 & 0.999072960664655 \tabularnewline
30 & 0.00071660552070714 & 0.00143321104141428 & 0.999283394479293 \tabularnewline
31 & 0.000370749967719804 & 0.000741499935439608 & 0.99962925003228 \tabularnewline
32 & 0.000526692692774887 & 0.00105338538554977 & 0.999473307307225 \tabularnewline
33 & 0.00493556940956785 & 0.0098711388191357 & 0.995064430590432 \tabularnewline
34 & 0.0050542730594027 & 0.0101085461188054 & 0.994945726940597 \tabularnewline
35 & 0.00420497031338899 & 0.00840994062677797 & 0.995795029686611 \tabularnewline
36 & 0.00246418854858100 & 0.00492837709716201 & 0.99753581145142 \tabularnewline
37 & 0.00114863532778098 & 0.00229727065556195 & 0.99885136467222 \tabularnewline
38 & 0.196593487794717 & 0.393186975589435 & 0.803406512205283 \tabularnewline
39 & 0.651441538882692 & 0.697116922234616 & 0.348558461117308 \tabularnewline
40 & 0.858412313955236 & 0.283175372089529 & 0.141587686044764 \tabularnewline
41 & 0.845132446198487 & 0.309735107603026 & 0.154867553801513 \tabularnewline
\hline
\end{tabular}
%Source: https://freestatistics.org/blog/index.php?pk=34169&T=5

[TABLE]
[ROW][C]Goldfeld-Quandt test for Heteroskedasticity[/C][/ROW]
[ROW][C]p-values[/C][C]Alternative Hypothesis[/C][/ROW]
[ROW][C]breakpoint index[/C][C]greater[/C][C]2-sided[/C][C]less[/C][/ROW]
[ROW][C]19[/C][C]0.000315936783726073[/C][C]0.000631873567452147[/C][C]0.999684063216274[/C][/ROW]
[ROW][C]20[/C][C]6.16936279098246e-05[/C][C]0.000123387255819649[/C][C]0.99993830637209[/C][/ROW]
[ROW][C]21[/C][C]0.0178747308626385[/C][C]0.0357494617252769[/C][C]0.982125269137362[/C][/ROW]
[ROW][C]22[/C][C]0.00677940006455064[/C][C]0.0135588001291013[/C][C]0.99322059993545[/C][/ROW]
[ROW][C]23[/C][C]0.0152926719389966[/C][C]0.0305853438779931[/C][C]0.984707328061003[/C][/ROW]
[ROW][C]24[/C][C]0.00992771464303833[/C][C]0.0198554292860767[/C][C]0.990072285356962[/C][/ROW]
[ROW][C]25[/C][C]0.00482373917361315[/C][C]0.0096474783472263[/C][C]0.995176260826387[/C][/ROW]
[ROW][C]26[/C][C]0.00197891353064059[/C][C]0.00395782706128119[/C][C]0.99802108646936[/C][/ROW]
[ROW][C]27[/C][C]0.000914368960480653[/C][C]0.00182873792096131[/C][C]0.99908563103952[/C][/ROW]
[ROW][C]28[/C][C]0.000898823554855657[/C][C]0.00179764710971131[/C][C]0.999101176445144[/C][/ROW]
[ROW][C]29[/C][C]0.000927039335344729[/C][C]0.00185407867068946[/C][C]0.999072960664655[/C][/ROW]
[ROW][C]30[/C][C]0.00071660552070714[/C][C]0.00143321104141428[/C][C]0.999283394479293[/C][/ROW]
[ROW][C]31[/C][C]0.000370749967719804[/C][C]0.000741499935439608[/C][C]0.99962925003228[/C][/ROW]
[ROW][C]32[/C][C]0.000526692692774887[/C][C]0.00105338538554977[/C][C]0.999473307307225[/C][/ROW]
[ROW][C]33[/C][C]0.00493556940956785[/C][C]0.0098711388191357[/C][C]0.995064430590432[/C][/ROW]
[ROW][C]34[/C][C]0.0050542730594027[/C][C]0.0101085461188054[/C][C]0.994945726940597[/C][/ROW]
[ROW][C]35[/C][C]0.00420497031338899[/C][C]0.00840994062677797[/C][C]0.995795029686611[/C][/ROW]
[ROW][C]36[/C][C]0.00246418854858100[/C][C]0.00492837709716201[/C][C]0.99753581145142[/C][/ROW]
[ROW][C]37[/C][C]0.00114863532778098[/C][C]0.00229727065556195[/C][C]0.99885136467222[/C][/ROW]
[ROW][C]38[/C][C]0.196593487794717[/C][C]0.393186975589435[/C][C]0.803406512205283[/C][/ROW]
[ROW][C]39[/C][C]0.651441538882692[/C][C]0.697116922234616[/C][C]0.348558461117308[/C][/ROW]
[ROW][C]40[/C][C]0.858412313955236[/C][C]0.283175372089529[/C][C]0.141587686044764[/C][/ROW]
[ROW][C]41[/C][C]0.845132446198487[/C][C]0.309735107603026[/C][C]0.154867553801513[/C][/ROW]
[/TABLE]
Source: https://freestatistics.org/blog/index.php?pk=34169&T=5

Globally Unique Identifier (entire table): ba.freestatistics.org/blog/index.php?pk=34169&T=5

As an alternative you can also use a QR Code:  

The GUIDs for individual cells are displayed in the table below:

Goldfeld-Quandt test for Heteroskedasticity
p-valuesAlternative Hypothesis
breakpoint indexgreater2-sidedless
190.0003159367837260730.0006318735674521470.999684063216274
206.16936279098246e-050.0001233872558196490.99993830637209
210.01787473086263850.03574946172527690.982125269137362
220.006779400064550640.01355880012910130.99322059993545
230.01529267193899660.03058534387799310.984707328061003
240.009927714643038330.01985542928607670.990072285356962
250.004823739173613150.00964747834722630.995176260826387
260.001978913530640590.003957827061281190.99802108646936
270.0009143689604806530.001828737920961310.99908563103952
280.0008988235548556570.001797647109711310.999101176445144
290.0009270393353447290.001854078670689460.999072960664655
300.000716605520707140.001433211041414280.999283394479293
310.0003707499677198040.0007414999354396080.99962925003228
320.0005266926927748870.001053385385549770.999473307307225
330.004935569409567850.00987113881913570.995064430590432
340.00505427305940270.01010854611880540.994945726940597
350.004204970313388990.008409940626777970.995795029686611
360.002464188548581000.004928377097162010.99753581145142
370.001148635327780980.002297270655561950.99885136467222
380.1965934877947170.3931869755894350.803406512205283
390.6514415388826920.6971169222346160.348558461117308
400.8584123139552360.2831753720895290.141587686044764
410.8451324461984870.3097351076030260.154867553801513


Meta Analysis of Goldfeld-Quandt test for Heteroskedasticity
Description# significant tests% significant testsOK/NOK
1% type I error level140.608695652173913NOK
5% type I error level190.826086956521739NOK
10% type I error level190.826086956521739NOK

\begin{tabular}{lllllllll}
\hline
Meta Analysis of Goldfeld-Quandt test for Heteroskedasticity \tabularnewline
Description & # significant tests & % significant tests & OK/NOK \tabularnewline
1% type I error level & 14 & 0.608695652173913 & NOK \tabularnewline
5% type I error level & 19 & 0.826086956521739 & NOK \tabularnewline
10% type I error level & 19 & 0.826086956521739 & NOK \tabularnewline
\hline
\end{tabular}
%Source: https://freestatistics.org/blog/index.php?pk=34169&T=6

[TABLE]
[ROW][C]Meta Analysis of Goldfeld-Quandt test for Heteroskedasticity[/C][/ROW]
[ROW][C]Description[/C][C]# significant tests[/C][C]% significant tests[/C][C]OK/NOK[/C][/ROW]
[ROW][C]1% type I error level[/C][C]14[/C][C]0.608695652173913[/C][C]NOK[/C][/ROW]
[ROW][C]5% type I error level[/C][C]19[/C][C]0.826086956521739[/C][C]NOK[/C][/ROW]
[ROW][C]10% type I error level[/C][C]19[/C][C]0.826086956521739[/C][C]NOK[/C][/ROW]
[/TABLE]
Source: https://freestatistics.org/blog/index.php?pk=34169&T=6

Globally Unique Identifier (entire table): ba.freestatistics.org/blog/index.php?pk=34169&T=6

As an alternative you can also use a QR Code:  

The GUIDs for individual cells are displayed in the table below:

Meta Analysis of Goldfeld-Quandt test for Heteroskedasticity
Description# significant tests% significant testsOK/NOK
1% type I error level140.608695652173913NOK
5% type I error level190.826086956521739NOK
10% type I error level190.826086956521739NOK


Parameters (Session):
par1 = 1 ; par2 = Include Monthly Dummies ; par3 = Linear Trend ;
Parameters (R input):
par1 = 1 ; par2 = Include Monthly Dummies ; par3 = Linear Trend ;
R code (references can be found in the software module):
library(lattice)
library(lmtest)
n25 <- 25 #minimum number of obs. for Goldfeld-Quandt test
par1 <- as.numeric(par1)
x <- t(y)
k <- length(x[1,])
n <- length(x[,1])
x1 <- cbind(x[,par1], x[,1:k!=par1])
mycolnames <- c(colnames(x)[par1], colnames(x)[1:k!=par1])
colnames(x1) <- mycolnames #colnames(x)[par1]
x <- x1
if (par3 == 'First Differences'){
x2 <- array(0, dim=c(n-1,k), dimnames=list(1:(n-1), paste('(1-B)',colnames(x),sep='')))
for (i in 1:n-1) {
for (j in 1:k) {
x2[i,j] <- x[i+1,j] - x[i,j]
}
}
x <- x2
}
if (par2 == 'Include Monthly Dummies'){
x2 <- array(0, dim=c(n,11), dimnames=list(1:n, paste('M', seq(1:11), sep ='')))
for (i in 1:11){
x2[seq(i,n,12),i] <- 1
}
x <- cbind(x, x2)
}
if (par2 == 'Include Quarterly Dummies'){
x2 <- array(0, dim=c(n,3), dimnames=list(1:n, paste('Q', seq(1:3), sep ='')))
for (i in 1:3){
x2[seq(i,n,4),i] <- 1
}
x <- cbind(x, x2)
}
k <- length(x[1,])
if (par3 == 'Linear Trend'){
x <- cbind(x, c(1:n))
colnames(x)[k+1] <- 't'
}
x
k <- length(x[1,])
df <- as.data.frame(x)
(mylm <- lm(df))
(mysum <- summary(mylm))
if (n > n25) {
kp3 <- k + 3
nmkm3 <- n - k - 3
gqarr <- array(NA, dim=c(nmkm3-kp3+1,3))
numgqtests <- 0
numsignificant1 <- 0
numsignificant5 <- 0
numsignificant10 <- 0
for (mypoint in kp3:nmkm3) {
j <- 0
numgqtests <- numgqtests + 1
for (myalt in c('greater', 'two.sided', 'less')) {
j <- j + 1
gqarr[mypoint-kp3+1,j] <- gqtest(mylm, point=mypoint, alternative=myalt)$p.value
}
if (gqarr[mypoint-kp3+1,2] < 0.01) numsignificant1 <- numsignificant1 + 1
if (gqarr[mypoint-kp3+1,2] < 0.05) numsignificant5 <- numsignificant5 + 1
if (gqarr[mypoint-kp3+1,2] < 0.10) numsignificant10 <- numsignificant10 + 1
}
gqarr
}
bitmap(file='test0.png')
plot(x[,1], type='l', main='Actuals and Interpolation', ylab='value of Actuals and Interpolation (dots)', xlab='time or index')
points(x[,1]-mysum$resid)
grid()
dev.off()
bitmap(file='test1.png')
plot(mysum$resid, type='b', pch=19, main='Residuals', ylab='value of Residuals', xlab='time or index')
grid()
dev.off()
bitmap(file='test2.png')
hist(mysum$resid, main='Residual Histogram', xlab='values of Residuals')
grid()
dev.off()
bitmap(file='test3.png')
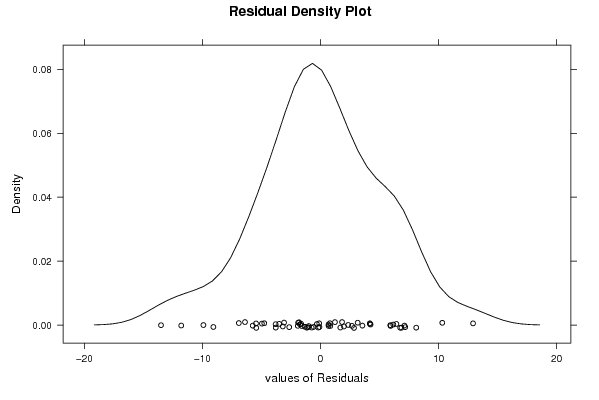
densityplot(~mysum$resid,col='black',main='Residual Density Plot', xlab='values of Residuals')
dev.off()
bitmap(file='test4.png')
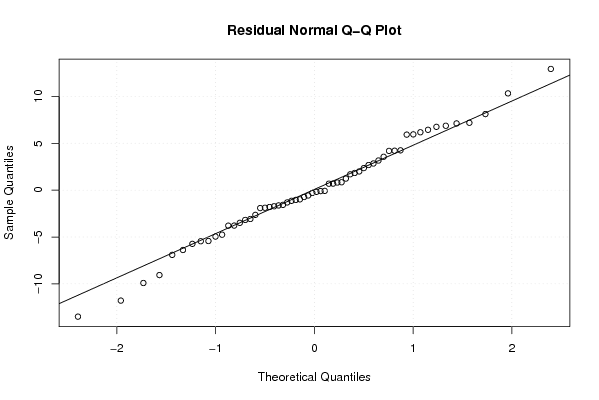
qqnorm(mysum$resid, main='Residual Normal Q-Q Plot')
qqline(mysum$resid)
grid()
dev.off()
(myerror <- as.ts(mysum$resid))
bitmap(file='test5.png')
dum <- cbind(lag(myerror,k=1),myerror)
dum
dum1 <- dum[2:length(myerror),]
dum1
z <- as.data.frame(dum1)
z
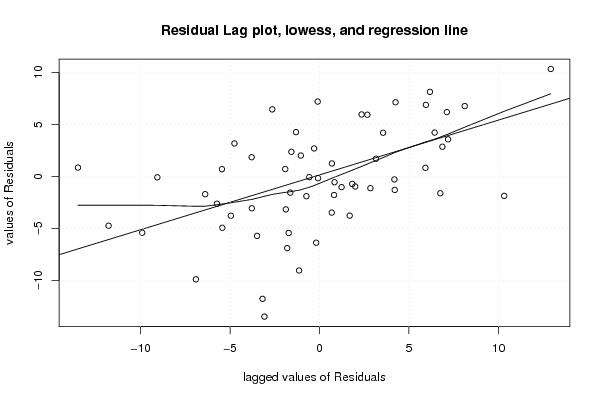
plot(z,main=paste('Residual Lag plot, lowess, and regression line'), ylab='values of Residuals', xlab='lagged values of Residuals')
lines(lowess(z))
abline(lm(z))
grid()
dev.off()
bitmap(file='test6.png')
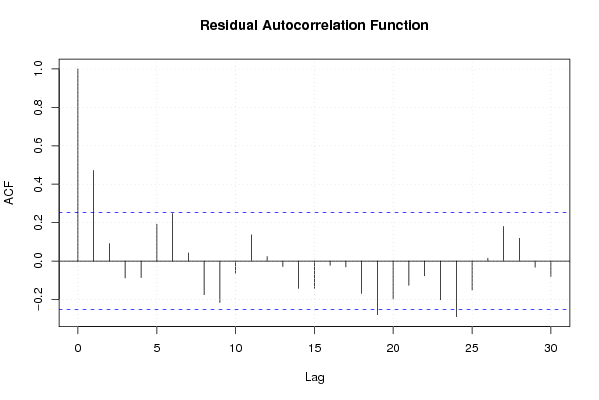
acf(mysum$resid, lag.max=length(mysum$resid)/2, main='Residual Autocorrelation Function')
grid()
dev.off()
bitmap(file='test7.png')
pacf(mysum$resid, lag.max=length(mysum$resid)/2, main='Residual Partial Autocorrelation Function')
grid()
dev.off()
bitmap(file='test8.png')
opar <- par(mfrow = c(2,2), oma = c(0, 0, 1.1, 0))
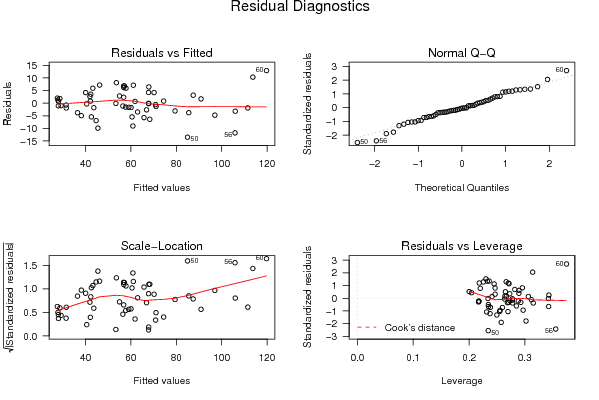
plot(mylm, las = 1, sub='Residual Diagnostics')
par(opar)
dev.off()
if (n > n25) {
bitmap(file='test9.png')
plot(kp3:nmkm3,gqarr[,2], main='Goldfeld-Quandt test',ylab='2-sided p-value',xlab='breakpoint')
grid()
dev.off()
}
load(file='createtable')
a<-table.start()
a<-table.row.start(a)
a<-table.element(a, 'Multiple Linear Regression - Estimated Regression Equation', 1, TRUE)
a<-table.row.end(a)
myeq <- colnames(x)[1]
myeq <- paste(myeq, '[t] = ', sep='')
for (i in 1:k){
if (mysum$coefficients[i,1] > 0) myeq <- paste(myeq, '+', '')
myeq <- paste(myeq, mysum$coefficients[i,1], sep=' ')
if (rownames(mysum$coefficients)[i] != '(Intercept)') {
myeq <- paste(myeq, rownames(mysum$coefficients)[i], sep='')
if (rownames(mysum$coefficients)[i] != 't') myeq <- paste(myeq, '[t]', sep='')
}
}
myeq <- paste(myeq, ' + e[t]')
a<-table.row.start(a)
a<-table.element(a, myeq)
a<-table.row.end(a)
a<-table.end(a)
table.save(a,file='mytable1.tab')
a<-table.start()
a<-table.row.start(a)
a<-table.element(a,hyperlink('ols1.htm','Multiple Linear Regression - Ordinary Least Squares',''), 6, TRUE)
a<-table.row.end(a)
a<-table.row.start(a)
a<-table.element(a,'Variable',header=TRUE)
a<-table.element(a,'Parameter',header=TRUE)
a<-table.element(a,'S.D.',header=TRUE)
a<-table.element(a,'T-STAT
H0: parameter = 0',header=TRUE)
a<-table.element(a,'2-tail p-value',header=TRUE)
a<-table.element(a,'1-tail p-value',header=TRUE)
a<-table.row.end(a)
for (i in 1:k){
a<-table.row.start(a)
a<-table.element(a,rownames(mysum$coefficients)[i],header=TRUE)
a<-table.element(a,mysum$coefficients[i,1])
a<-table.element(a, round(mysum$coefficients[i,2],6))
a<-table.element(a, round(mysum$coefficients[i,3],4))
a<-table.element(a, round(mysum$coefficients[i,4],6))
a<-table.element(a, round(mysum$coefficients[i,4]/2,6))
a<-table.row.end(a)
}
a<-table.end(a)
table.save(a,file='mytable2.tab')
a<-table.start()
a<-table.row.start(a)
a<-table.element(a, 'Multiple Linear Regression - Regression Statistics', 2, TRUE)
a<-table.row.end(a)
a<-table.row.start(a)
a<-table.element(a, 'Multiple R',1,TRUE)
a<-table.element(a, sqrt(mysum$r.squared))
a<-table.row.end(a)
a<-table.row.start(a)
a<-table.element(a, 'R-squared',1,TRUE)
a<-table.element(a, mysum$r.squared)
a<-table.row.end(a)
a<-table.row.start(a)
a<-table.element(a, 'Adjusted R-squared',1,TRUE)
a<-table.element(a, mysum$adj.r.squared)
a<-table.row.end(a)
a<-table.row.start(a)
a<-table.element(a, 'F-TEST (value)',1,TRUE)
a<-table.element(a, mysum$fstatistic[1])
a<-table.row.end(a)
a<-table.row.start(a)
a<-table.element(a, 'F-TEST (DF numerator)',1,TRUE)
a<-table.element(a, mysum$fstatistic[2])
a<-table.row.end(a)
a<-table.row.start(a)
a<-table.element(a, 'F-TEST (DF denominator)',1,TRUE)
a<-table.element(a, mysum$fstatistic[3])
a<-table.row.end(a)
a<-table.row.start(a)
a<-table.element(a, 'p-value',1,TRUE)
a<-table.element(a, 1-pf(mysum$fstatistic[1],mysum$fstatistic[2],mysum$fstatistic[3]))
a<-table.row.end(a)
a<-table.row.start(a)
a<-table.element(a, 'Multiple Linear Regression - Residual Statistics', 2, TRUE)
a<-table.row.end(a)
a<-table.row.start(a)
a<-table.element(a, 'Residual Standard Deviation',1,TRUE)
a<-table.element(a, mysum$sigma)
a<-table.row.end(a)
a<-table.row.start(a)
a<-table.element(a, 'Sum Squared Residuals',1,TRUE)
a<-table.element(a, sum(myerror*myerror))
a<-table.row.end(a)
a<-table.end(a)
table.save(a,file='mytable3.tab')
a<-table.start()
a<-table.row.start(a)
a<-table.element(a, 'Multiple Linear Regression - Actuals, Interpolation, and Residuals', 4, TRUE)
a<-table.row.end(a)
a<-table.row.start(a)
a<-table.element(a, 'Time or Index', 1, TRUE)
a<-table.element(a, 'Actuals', 1, TRUE)
a<-table.element(a, 'Interpolation
Forecast', 1, TRUE)
a<-table.element(a, 'Residuals
Prediction Error', 1, TRUE)
a<-table.row.end(a)
for (i in 1:n) {
a<-table.row.start(a)
a<-table.element(a,i, 1, TRUE)
a<-table.element(a,x[i])
a<-table.element(a,x[i]-mysum$resid[i])
a<-table.element(a,mysum$resid[i])
a<-table.row.end(a)
}
a<-table.end(a)
table.save(a,file='mytable4.tab')
if (n > n25) {
a<-table.start()
a<-table.row.start(a)
a<-table.element(a,'Goldfeld-Quandt test for Heteroskedasticity',4,TRUE)
a<-table.row.end(a)
a<-table.row.start(a)
a<-table.element(a,'p-values',header=TRUE)
a<-table.element(a,'Alternative Hypothesis',3,header=TRUE)
a<-table.row.end(a)
a<-table.row.start(a)
a<-table.element(a,'breakpoint index',header=TRUE)
a<-table.element(a,'greater',header=TRUE)
a<-table.element(a,'2-sided',header=TRUE)
a<-table.element(a,'less',header=TRUE)
a<-table.row.end(a)
for (mypoint in kp3:nmkm3) {
a<-table.row.start(a)
a<-table.element(a,mypoint,header=TRUE)
a<-table.element(a,gqarr[mypoint-kp3+1,1])
a<-table.element(a,gqarr[mypoint-kp3+1,2])
a<-table.element(a,gqarr[mypoint-kp3+1,3])
a<-table.row.end(a)
}
a<-table.end(a)
table.save(a,file='mytable5.tab')
a<-table.start()
a<-table.row.start(a)
a<-table.element(a,'Meta Analysis of Goldfeld-Quandt test for Heteroskedasticity',4,TRUE)
a<-table.row.end(a)
a<-table.row.start(a)
a<-table.element(a,'Description',header=TRUE)
a<-table.element(a,'# significant tests',header=TRUE)
a<-table.element(a,'% significant tests',header=TRUE)
a<-table.element(a,'OK/NOK',header=TRUE)
a<-table.row.end(a)
a<-table.row.start(a)
a<-table.element(a,'1% type I error level',header=TRUE)
a<-table.element(a,numsignificant1)
a<-table.element(a,numsignificant1/numgqtests)
if (numsignificant1/numgqtests < 0.01) dum <- 'OK' else dum <- 'NOK'
a<-table.element(a,dum)
a<-table.row.end(a)
a<-table.row.start(a)
a<-table.element(a,'5% type I error level',header=TRUE)
a<-table.element(a,numsignificant5)
a<-table.element(a,numsignificant5/numgqtests)
if (numsignificant5/numgqtests < 0.05) dum <- 'OK' else dum <- 'NOK'
a<-table.element(a,dum)
a<-table.row.end(a)
a<-table.row.start(a)
a<-table.element(a,'10% type I error level',header=TRUE)
a<-table.element(a,numsignificant10)
a<-table.element(a,numsignificant10/numgqtests)
if (numsignificant10/numgqtests < 0.1) dum <- 'OK' else dum <- 'NOK'
a<-table.element(a,dum)
a<-table.row.end(a)
a<-table.end(a)
table.save(a,file='mytable6.tab')
}