Free Statistics

of Irreproducible Research!

Author's title

Author*Unverified author*
R Software Modulerwasp_arimaforecasting.wasp
Title produced by softwareARIMA Forecasting
Date of computationTue, 16 Dec 2008 12:27:17 -0700
Cite this page as followsStatistical Computations at FreeStatistics.org, Office for Research Development and Education, URL https://freestatistics.org/blog/index.php?v=date/2008/Dec/16/t1229455754vt3jpb2xzoorufw.htm/, Retrieved Wed, 15 May 2024 05:46:02 +0000
Statistical Computations at FreeStatistics.org, Office for Research Development and Education, URL https://freestatistics.org/blog/index.php?pk=34143, Retrieved Wed, 15 May 2024 05:46:02 +0000
QR Codes:

Original text written by user:
IsPrivate?No (this computation is public)
User-defined keywords
Estimated Impact198
Family? (F = Feedback message, R = changed R code, M = changed R Module, P = changed Parameters, D = changed Data)
F       [ARIMA Forecasting] [step 1] [2008-12-16 19:27:17] [4feaea4b7a1dc404ed7b3613ea3a9f56] [Current]
-   PD    [ARIMA Forecasting] [ARIMA FC Vrouwen] [2008-12-24 10:41:38] [ab2167f62c8fd37f7bb79fc194eace61]
-   PD    [ARIMA Forecasting] [ARIMA FC Mannen] [2008-12-24 10:45:55] [ab2167f62c8fd37f7bb79fc194eace61]
Feedback Forum
2008-12-18 11:45:34 [72e979bcc364082694890d2eccc1a66f] [reply
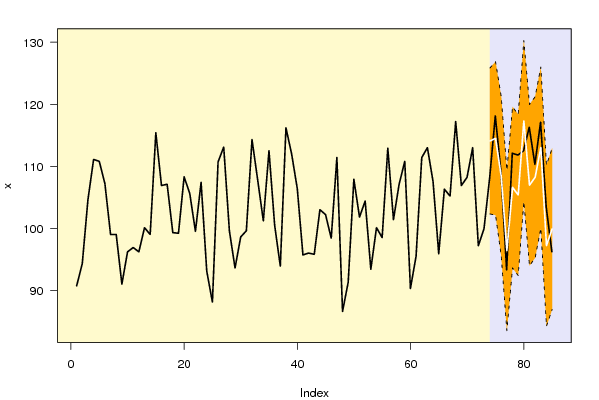
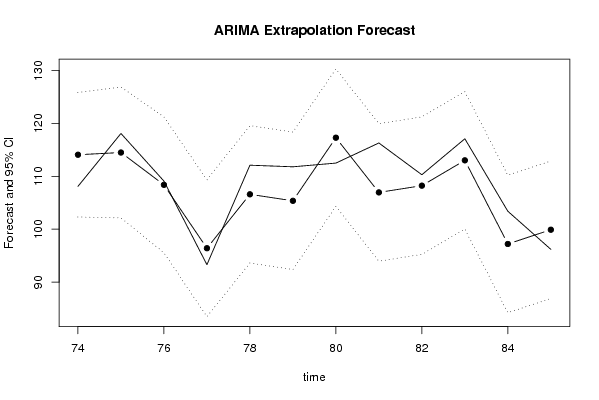
Bij stap 1 is het eigenlijk de bedoeling om enkel gebruik te maken van eerste grafiek. Hier zie je dan dat de lijn van de voorspelde waarden binnen het betrouwbaarheidsinterval ligt. Hierdoor kunnen we besluiten dat we niet te maken hebben met explosiviteit. De AR processen zijn stabiel en de MA processen zijn omkeerbaar.
2008-12-19 09:57:35 [] [reply
OPMERKING: Ik geef alle inhoudelijke uitleg onder deze link.
Step 1: De studente legt hier alle tabellen en grafieken goed uit, maar antwoord niet echt op de vraag. Step 1 vereist enkel dat we kijken naar de grafieken. We zien dat er geen sprake is van explosiviteit (de voorspelling wijkt bv. niet ineens af naar + of - oneindig). Bijgevolg kunnen we stellen dat de AR-processen stabiel zijn en de MA-processen invertibel.

Step 2: Ik zou zeggen dat er hier wel sprake is van seizonaliteit, de voorspelling word berekend op basis van de ingevoerde parameters, hierbij is D gelijk aan 1 (er is dus seizonaal gedifferentieerd). Oorspronkelijk was er dus sprake van seizonaliteit en dit wordt voortgezet in de voorspelling (pieken en dalen). Dit is het best te zien op de eerste grafiek ipv de tweede.

Step 3: De foute conclusie wordt getrokken. In deze tabel kunnen we de theoretische schatting van de standaardfout op basis van het model aflezen (% SE). Daarnaast zien we de werkelijke fout (PE). Deze laatste is bijna altijd kleiner dan de voorspelde fout. Dit is een goed teken en wijst op een correct model.

Step 4: De vraag werd verkeerd geïnterpreteerd. Men hier de kansen uit de 2de tabel bespreken.
Y[t] = zijn de werkelijke waarden van de 12 maanden die we hebben ‘afgeknipt’ van de tijdreeks en waarvoor we een voorspelling hebben gedaan.

F[t] = de waarden die voorspeld werden op basis van het model

95% Lower en Upper bound = met een waarschijnlijkheid van 95% ligt de volgende waarde binnen deze grenzen. Dit geldt wel enkel ceteris paribus. Dat wil zeggen dat we veronderstellen dat de omstandigheden normaal zijn en zo blijven.

H0 Y(t) = F (t) De nulhypothese veronderstelt dat de voorspelde waarden gelijk zijn aan de werkelijke waarden en dat ons model dus volledig correct is.

P-value van H0 = de kans dat we ons vergissen bij het verwerpen van de nulhypothese. Y(t) en F (t) mogen niet significant van elkaar verschillen. Dit betekent dat de P-waarde in dit geval niet kleiner mag zijn dan 5%. We zien dat dit bij alle waarden het geval is.

P(F[t]>Y[t-1]) = Wat is de waarschijnlijkheid dat de volgende waarde groter is dan de vorige gekende periode? We zien dat deze kansen zeer sterk verschillen soms is dit 99% soms bijna 0%. Dit valt te verklaren door de sterk schommelende bewegingen in onze tijdreeks (seizonaliteit).

P(F[t]>Y[t-s]) = de kans op stijgen in vergelijking met dezelfde maand vorig jaar. Deze kansen schommelen rond de 50%


P(F[t]>Y[73]) = de kans op stijgen tov de laatst gekende waarde. Ook deze kansen schommelen zeer sterk door de seizonaliteit in onze reeks.

De onderliggende assumpties veronderstellen dat in de residus geen autocorrelatie meer voorkomt en dat deze normaal verdeeld zijn en dat de spreiding ervan constant is. Het gemiddelde van de residus moet gelijk zijn aan nul. Dit kunnen we testen in bv de module arima backward selection dat een ACF, PACF, Q-Q plot, Density Plot en histogram van de residus weergeeft.

Step 5: Dit is correct. Het is een goed model, de standardafwijkingen zijn vrij klein, er zijn geen significante afwijkingen van de voorspellingen en alle werkelijke waarden liggen binnen het 95% procent betrouwbaarheidsinterval.
2008-12-19 11:55:47 [006ad2c49b6a7c2ad6ab685cfc1dae56] [reply
De vorige student heeft al een goede oplossing gegeven.
2008-12-24 08:59:01 [Sofie Mertens] [reply
Goede en duidelijke uitleg, maar de vragen worden niet expliciet beantwoord. Is er een aanwijzing dat de AR of MA processen onstabiel of onomkeerbaar zijn? Nee, want we hebben niet te maken met explosiviteit. De voorspelling valt mooi binnen het 95% betrouwbaarheidsinterval.

Post a new message
Dataseries X:
90,7
94,3
104,6
111,1
110,8
107,2
99
99
91
96,2
96,9
96,2
100,1
99
115,4
106,9
107,1
99,3
99,2
108,3
105,6
99,5
107,4
93,1
88,1
110,7
113,1
99,6
93,6
98,6
99,6
114,3
107,8
101,2
112,5
100,5
93,9
116,2
112
106,4
95,7
96
95,8
103
102,2
98,4
111,4
86,6
91,3
107,9
101,8
104,4
93,4
100,1
98,5
112,9
101,4
107,1
110,8
90,3
95,5
111,4
113
107,5
95,9
106,3
105,2
117,2
106,9
108,2
113
97,2
99,9
108,1
118,1
109,1
93,3
112,1
111,8
112,5
116,3
110,3
117,1
103,4
96,2


Summary of computational transaction
Raw Inputview raw input (R code)
Raw Outputview raw output of R engine
Computing time1 seconds
R Server'George Udny Yule' @ 72.249.76.132

\begin{tabular}{lllllllll}
\hline
Summary of computational transaction \tabularnewline
Raw Input & view raw input (R code)  \tabularnewline
Raw Output & view raw output of R engine  \tabularnewline
Computing time & 1 seconds \tabularnewline
R Server & 'George Udny Yule' @ 72.249.76.132 \tabularnewline
\hline
\end{tabular}
%Source: https://freestatistics.org/blog/index.php?pk=34143&T=0

[TABLE]
[ROW][C]Summary of computational transaction[/C][/ROW]
[ROW][C]Raw Input[/C][C]view raw input (R code) [/C][/ROW]
[ROW][C]Raw Output[/C][C]view raw output of R engine [/C][/ROW]
[ROW][C]Computing time[/C][C]1 seconds[/C][/ROW]
[ROW][C]R Server[/C][C]'George Udny Yule' @ 72.249.76.132[/C][/ROW]
[/TABLE]
Source: https://freestatistics.org/blog/index.php?pk=34143&T=0

Globally Unique Identifier (entire table): ba.freestatistics.org/blog/index.php?pk=34143&T=0

As an alternative you can also use a QR Code:  

The GUIDs for individual cells are displayed in the table below:

Summary of computational transaction
Raw Inputview raw input (R code)
Raw Outputview raw output of R engine
Computing time1 seconds
R Server'George Udny Yule' @ 72.249.76.132


Univariate ARIMA Extrapolation Forecast
timeY[t]F[t]95% LB95% UBp-value(H0: Y[t] = F[t])P(F[t]>Y[t-1])P(F[t]>Y[t-s])P(F[t]>Y[73])
6195.5-------
62111.4-------
63113-------
64107.5-------
6595.9-------
66106.3-------
67105.2-------
68117.2-------
69106.9-------
70108.2-------
71113-------
7297.2-------
7399.9-------
74108.1114.0776102.3151125.84010.15960.99090.67230.9909
75118.1114.4976102.1339126.86130.2840.84480.59380.9897
76109.1108.391195.5445121.23770.45690.06930.55410.9024
7793.396.406683.4755109.33770.31890.02720.53060.2982
78112.1106.597893.621119.57460.2030.97770.51790.8441
79111.8105.370892.3831118.35850.1660.15490.51030.7955
80112.5117.2998104.3074130.29220.23450.79660.5060.9957
81116.3106.957593.9638119.95120.07940.20160.50350.8565
82110.3108.233595.2392121.22770.37760.11190.5020.8956
83117.1113.0193100.0249126.01370.26910.65920.50120.9761
84103.497.211284.2168110.20570.17530.00140.50070.3425
8596.299.906586.912112.9010.28810.29910.50040.5004

\begin{tabular}{lllllllll}
\hline
Univariate ARIMA Extrapolation Forecast \tabularnewline
time & Y[t] & F[t] & 95% LB & 95% UB & p-value(H0: Y[t] = F[t]) & P(F[t]>Y[t-1]) & P(F[t]>Y[t-s]) & P(F[t]>Y[73]) \tabularnewline
61 & 95.5 & - & - & - & - & - & - & - \tabularnewline
62 & 111.4 & - & - & - & - & - & - & - \tabularnewline
63 & 113 & - & - & - & - & - & - & - \tabularnewline
64 & 107.5 & - & - & - & - & - & - & - \tabularnewline
65 & 95.9 & - & - & - & - & - & - & - \tabularnewline
66 & 106.3 & - & - & - & - & - & - & - \tabularnewline
67 & 105.2 & - & - & - & - & - & - & - \tabularnewline
68 & 117.2 & - & - & - & - & - & - & - \tabularnewline
69 & 106.9 & - & - & - & - & - & - & - \tabularnewline
70 & 108.2 & - & - & - & - & - & - & - \tabularnewline
71 & 113 & - & - & - & - & - & - & - \tabularnewline
72 & 97.2 & - & - & - & - & - & - & - \tabularnewline
73 & 99.9 & - & - & - & - & - & - & - \tabularnewline
74 & 108.1 & 114.0776 & 102.3151 & 125.8401 & 0.1596 & 0.9909 & 0.6723 & 0.9909 \tabularnewline
75 & 118.1 & 114.4976 & 102.1339 & 126.8613 & 0.284 & 0.8448 & 0.5938 & 0.9897 \tabularnewline
76 & 109.1 & 108.3911 & 95.5445 & 121.2377 & 0.4569 & 0.0693 & 0.5541 & 0.9024 \tabularnewline
77 & 93.3 & 96.4066 & 83.4755 & 109.3377 & 0.3189 & 0.0272 & 0.5306 & 0.2982 \tabularnewline
78 & 112.1 & 106.5978 & 93.621 & 119.5746 & 0.203 & 0.9777 & 0.5179 & 0.8441 \tabularnewline
79 & 111.8 & 105.3708 & 92.3831 & 118.3585 & 0.166 & 0.1549 & 0.5103 & 0.7955 \tabularnewline
80 & 112.5 & 117.2998 & 104.3074 & 130.2922 & 0.2345 & 0.7966 & 0.506 & 0.9957 \tabularnewline
81 & 116.3 & 106.9575 & 93.9638 & 119.9512 & 0.0794 & 0.2016 & 0.5035 & 0.8565 \tabularnewline
82 & 110.3 & 108.2335 & 95.2392 & 121.2277 & 0.3776 & 0.1119 & 0.502 & 0.8956 \tabularnewline
83 & 117.1 & 113.0193 & 100.0249 & 126.0137 & 0.2691 & 0.6592 & 0.5012 & 0.9761 \tabularnewline
84 & 103.4 & 97.2112 & 84.2168 & 110.2057 & 0.1753 & 0.0014 & 0.5007 & 0.3425 \tabularnewline
85 & 96.2 & 99.9065 & 86.912 & 112.901 & 0.2881 & 0.2991 & 0.5004 & 0.5004 \tabularnewline
\hline
\end{tabular}
%Source: https://freestatistics.org/blog/index.php?pk=34143&T=1

[TABLE]
[ROW][C]Univariate ARIMA Extrapolation Forecast[/C][/ROW]
[ROW][C]time[/C][C]Y[t][/C][C]F[t][/C][C]95% LB[/C][C]95% UB[/C][C]p-value(H0: Y[t] = F[t])[/C][C]P(F[t]>Y[t-1])[/C][C]P(F[t]>Y[t-s])[/C][C]P(F[t]>Y[73])[/C][/ROW]
[ROW][C]61[/C][C]95.5[/C][C]-[/C][C]-[/C][C]-[/C][C]-[/C][C]-[/C][C]-[/C][C]-[/C][/ROW]
[ROW][C]62[/C][C]111.4[/C][C]-[/C][C]-[/C][C]-[/C][C]-[/C][C]-[/C][C]-[/C][C]-[/C][/ROW]
[ROW][C]63[/C][C]113[/C][C]-[/C][C]-[/C][C]-[/C][C]-[/C][C]-[/C][C]-[/C][C]-[/C][/ROW]
[ROW][C]64[/C][C]107.5[/C][C]-[/C][C]-[/C][C]-[/C][C]-[/C][C]-[/C][C]-[/C][C]-[/C][/ROW]
[ROW][C]65[/C][C]95.9[/C][C]-[/C][C]-[/C][C]-[/C][C]-[/C][C]-[/C][C]-[/C][C]-[/C][/ROW]
[ROW][C]66[/C][C]106.3[/C][C]-[/C][C]-[/C][C]-[/C][C]-[/C][C]-[/C][C]-[/C][C]-[/C][/ROW]
[ROW][C]67[/C][C]105.2[/C][C]-[/C][C]-[/C][C]-[/C][C]-[/C][C]-[/C][C]-[/C][C]-[/C][/ROW]
[ROW][C]68[/C][C]117.2[/C][C]-[/C][C]-[/C][C]-[/C][C]-[/C][C]-[/C][C]-[/C][C]-[/C][/ROW]
[ROW][C]69[/C][C]106.9[/C][C]-[/C][C]-[/C][C]-[/C][C]-[/C][C]-[/C][C]-[/C][C]-[/C][/ROW]
[ROW][C]70[/C][C]108.2[/C][C]-[/C][C]-[/C][C]-[/C][C]-[/C][C]-[/C][C]-[/C][C]-[/C][/ROW]
[ROW][C]71[/C][C]113[/C][C]-[/C][C]-[/C][C]-[/C][C]-[/C][C]-[/C][C]-[/C][C]-[/C][/ROW]
[ROW][C]72[/C][C]97.2[/C][C]-[/C][C]-[/C][C]-[/C][C]-[/C][C]-[/C][C]-[/C][C]-[/C][/ROW]
[ROW][C]73[/C][C]99.9[/C][C]-[/C][C]-[/C][C]-[/C][C]-[/C][C]-[/C][C]-[/C][C]-[/C][/ROW]
[ROW][C]74[/C][C]108.1[/C][C]114.0776[/C][C]102.3151[/C][C]125.8401[/C][C]0.1596[/C][C]0.9909[/C][C]0.6723[/C][C]0.9909[/C][/ROW]
[ROW][C]75[/C][C]118.1[/C][C]114.4976[/C][C]102.1339[/C][C]126.8613[/C][C]0.284[/C][C]0.8448[/C][C]0.5938[/C][C]0.9897[/C][/ROW]
[ROW][C]76[/C][C]109.1[/C][C]108.3911[/C][C]95.5445[/C][C]121.2377[/C][C]0.4569[/C][C]0.0693[/C][C]0.5541[/C][C]0.9024[/C][/ROW]
[ROW][C]77[/C][C]93.3[/C][C]96.4066[/C][C]83.4755[/C][C]109.3377[/C][C]0.3189[/C][C]0.0272[/C][C]0.5306[/C][C]0.2982[/C][/ROW]
[ROW][C]78[/C][C]112.1[/C][C]106.5978[/C][C]93.621[/C][C]119.5746[/C][C]0.203[/C][C]0.9777[/C][C]0.5179[/C][C]0.8441[/C][/ROW]
[ROW][C]79[/C][C]111.8[/C][C]105.3708[/C][C]92.3831[/C][C]118.3585[/C][C]0.166[/C][C]0.1549[/C][C]0.5103[/C][C]0.7955[/C][/ROW]
[ROW][C]80[/C][C]112.5[/C][C]117.2998[/C][C]104.3074[/C][C]130.2922[/C][C]0.2345[/C][C]0.7966[/C][C]0.506[/C][C]0.9957[/C][/ROW]
[ROW][C]81[/C][C]116.3[/C][C]106.9575[/C][C]93.9638[/C][C]119.9512[/C][C]0.0794[/C][C]0.2016[/C][C]0.5035[/C][C]0.8565[/C][/ROW]
[ROW][C]82[/C][C]110.3[/C][C]108.2335[/C][C]95.2392[/C][C]121.2277[/C][C]0.3776[/C][C]0.1119[/C][C]0.502[/C][C]0.8956[/C][/ROW]
[ROW][C]83[/C][C]117.1[/C][C]113.0193[/C][C]100.0249[/C][C]126.0137[/C][C]0.2691[/C][C]0.6592[/C][C]0.5012[/C][C]0.9761[/C][/ROW]
[ROW][C]84[/C][C]103.4[/C][C]97.2112[/C][C]84.2168[/C][C]110.2057[/C][C]0.1753[/C][C]0.0014[/C][C]0.5007[/C][C]0.3425[/C][/ROW]
[ROW][C]85[/C][C]96.2[/C][C]99.9065[/C][C]86.912[/C][C]112.901[/C][C]0.2881[/C][C]0.2991[/C][C]0.5004[/C][C]0.5004[/C][/ROW]
[/TABLE]
Source: https://freestatistics.org/blog/index.php?pk=34143&T=1

Globally Unique Identifier (entire table): ba.freestatistics.org/blog/index.php?pk=34143&T=1

As an alternative you can also use a QR Code:  

The GUIDs for individual cells are displayed in the table below:

Univariate ARIMA Extrapolation Forecast
timeY[t]F[t]95% LB95% UBp-value(H0: Y[t] = F[t])P(F[t]>Y[t-1])P(F[t]>Y[t-s])P(F[t]>Y[73])
6195.5-------
62111.4-------
63113-------
64107.5-------
6595.9-------
66106.3-------
67105.2-------
68117.2-------
69106.9-------
70108.2-------
71113-------
7297.2-------
7399.9-------
74108.1114.0776102.3151125.84010.15960.99090.67230.9909
75118.1114.4976102.1339126.86130.2840.84480.59380.9897
76109.1108.391195.5445121.23770.45690.06930.55410.9024
7793.396.406683.4755109.33770.31890.02720.53060.2982
78112.1106.597893.621119.57460.2030.97770.51790.8441
79111.8105.370892.3831118.35850.1660.15490.51030.7955
80112.5117.2998104.3074130.29220.23450.79660.5060.9957
81116.3106.957593.9638119.95120.07940.20160.50350.8565
82110.3108.233595.2392121.22770.37760.11190.5020.8956
83117.1113.0193100.0249126.01370.26910.65920.50120.9761
84103.497.211284.2168110.20570.17530.00140.50070.3425
8596.299.906586.912112.9010.28810.29910.50040.5004


Univariate ARIMA Extrapolation Forecast Performance
time% S.E.PEMAPESq.EMSERMSE
740.0526-0.05240.004435.73172.97761.7256
750.05510.03150.002612.97731.08141.0399
760.06050.00655e-040.50250.04190.2046
770.0684-0.03220.00279.65110.80430.8968
780.06210.05160.004330.2742.52281.5883
790.06290.0610.005141.33433.44451.8559
800.0565-0.04090.003423.03781.91981.3856
810.0620.08730.007387.28237.27352.6969
820.06130.01910.00164.27060.35590.5966
830.05870.03610.00316.65181.38771.178
840.06820.06370.005338.30093.19171.7865
850.0664-0.03710.003113.73811.14481.07

\begin{tabular}{lllllllll}
\hline
Univariate ARIMA Extrapolation Forecast Performance \tabularnewline
time & % S.E. & PE & MAPE & Sq.E & MSE & RMSE \tabularnewline
74 & 0.0526 & -0.0524 & 0.0044 & 35.7317 & 2.9776 & 1.7256 \tabularnewline
75 & 0.0551 & 0.0315 & 0.0026 & 12.9773 & 1.0814 & 1.0399 \tabularnewline
76 & 0.0605 & 0.0065 & 5e-04 & 0.5025 & 0.0419 & 0.2046 \tabularnewline
77 & 0.0684 & -0.0322 & 0.0027 & 9.6511 & 0.8043 & 0.8968 \tabularnewline
78 & 0.0621 & 0.0516 & 0.0043 & 30.274 & 2.5228 & 1.5883 \tabularnewline
79 & 0.0629 & 0.061 & 0.0051 & 41.3343 & 3.4445 & 1.8559 \tabularnewline
80 & 0.0565 & -0.0409 & 0.0034 & 23.0378 & 1.9198 & 1.3856 \tabularnewline
81 & 0.062 & 0.0873 & 0.0073 & 87.2823 & 7.2735 & 2.6969 \tabularnewline
82 & 0.0613 & 0.0191 & 0.0016 & 4.2706 & 0.3559 & 0.5966 \tabularnewline
83 & 0.0587 & 0.0361 & 0.003 & 16.6518 & 1.3877 & 1.178 \tabularnewline
84 & 0.0682 & 0.0637 & 0.0053 & 38.3009 & 3.1917 & 1.7865 \tabularnewline
85 & 0.0664 & -0.0371 & 0.0031 & 13.7381 & 1.1448 & 1.07 \tabularnewline
\hline
\end{tabular}
%Source: https://freestatistics.org/blog/index.php?pk=34143&T=2

[TABLE]
[ROW][C]Univariate ARIMA Extrapolation Forecast Performance[/C][/ROW]
[ROW][C]time[/C][C]% S.E.[/C][C]PE[/C][C]MAPE[/C][C]Sq.E[/C][C]MSE[/C][C]RMSE[/C][/ROW]
[ROW][C]74[/C][C]0.0526[/C][C]-0.0524[/C][C]0.0044[/C][C]35.7317[/C][C]2.9776[/C][C]1.7256[/C][/ROW]
[ROW][C]75[/C][C]0.0551[/C][C]0.0315[/C][C]0.0026[/C][C]12.9773[/C][C]1.0814[/C][C]1.0399[/C][/ROW]
[ROW][C]76[/C][C]0.0605[/C][C]0.0065[/C][C]5e-04[/C][C]0.5025[/C][C]0.0419[/C][C]0.2046[/C][/ROW]
[ROW][C]77[/C][C]0.0684[/C][C]-0.0322[/C][C]0.0027[/C][C]9.6511[/C][C]0.8043[/C][C]0.8968[/C][/ROW]
[ROW][C]78[/C][C]0.0621[/C][C]0.0516[/C][C]0.0043[/C][C]30.274[/C][C]2.5228[/C][C]1.5883[/C][/ROW]
[ROW][C]79[/C][C]0.0629[/C][C]0.061[/C][C]0.0051[/C][C]41.3343[/C][C]3.4445[/C][C]1.8559[/C][/ROW]
[ROW][C]80[/C][C]0.0565[/C][C]-0.0409[/C][C]0.0034[/C][C]23.0378[/C][C]1.9198[/C][C]1.3856[/C][/ROW]
[ROW][C]81[/C][C]0.062[/C][C]0.0873[/C][C]0.0073[/C][C]87.2823[/C][C]7.2735[/C][C]2.6969[/C][/ROW]
[ROW][C]82[/C][C]0.0613[/C][C]0.0191[/C][C]0.0016[/C][C]4.2706[/C][C]0.3559[/C][C]0.5966[/C][/ROW]
[ROW][C]83[/C][C]0.0587[/C][C]0.0361[/C][C]0.003[/C][C]16.6518[/C][C]1.3877[/C][C]1.178[/C][/ROW]
[ROW][C]84[/C][C]0.0682[/C][C]0.0637[/C][C]0.0053[/C][C]38.3009[/C][C]3.1917[/C][C]1.7865[/C][/ROW]
[ROW][C]85[/C][C]0.0664[/C][C]-0.0371[/C][C]0.0031[/C][C]13.7381[/C][C]1.1448[/C][C]1.07[/C][/ROW]
[/TABLE]
Source: https://freestatistics.org/blog/index.php?pk=34143&T=2

Globally Unique Identifier (entire table): ba.freestatistics.org/blog/index.php?pk=34143&T=2

As an alternative you can also use a QR Code:  

The GUIDs for individual cells are displayed in the table below:

Univariate ARIMA Extrapolation Forecast Performance
time% S.E.PEMAPESq.EMSERMSE
740.0526-0.05240.004435.73172.97761.7256
750.05510.03150.002612.97731.08141.0399
760.06050.00655e-040.50250.04190.2046
770.0684-0.03220.00279.65110.80430.8968
780.06210.05160.004330.2742.52281.5883
790.06290.0610.005141.33433.44451.8559
800.0565-0.04090.003423.03781.91981.3856
810.0620.08730.007387.28237.27352.6969
820.06130.01910.00164.27060.35590.5966
830.05870.03610.00316.65181.38771.178
840.06820.06370.005338.30093.19171.7865
850.0664-0.03710.003113.73811.14481.07


Parameters (Session):
par1 = 12 ; par2 = 1.0 ; par3 = 0 ; par4 = 1 ; par5 = 12 ; par6 = 2 ; par7 = 1 ; par8 = 0 ; par9 = 0 ; par10 = FALSE ;
Parameters (R input):
par1 = 12 ; par2 = 1.0 ; par3 = 0 ; par4 = 1 ; par5 = 12 ; par6 = 2 ; par7 = 1 ; par8 = 0 ; par9 = 0 ; par10 = FALSE ;
R code (references can be found in the software module):
par1 <- as.numeric(par1) #cut off periods
par2 <- as.numeric(par2) #lambda
par3 <- as.numeric(par3) #degree of non-seasonal differencing
par4 <- as.numeric(par4) #degree of seasonal differencing
par5 <- as.numeric(par5) #seasonal period
par6 <- as.numeric(par6) #p
par7 <- as.numeric(par7) #q
par8 <- as.numeric(par8) #P
par9 <- as.numeric(par9) #Q
if (par10 == 'TRUE') par10 <- TRUE
if (par10 == 'FALSE') par10 <- FALSE
if (par2 == 0) x <- log(x)
if (par2 != 0) x <- x^par2
lx <- length(x)
first <- lx - 2*par1
nx <- lx - par1
nx1 <- nx + 1
fx <- lx - nx
if (fx < 1) {
fx <- par5
nx1 <- lx + fx - 1
first <- lx - 2*fx
}
first <- 1
if (fx < 3) fx <- round(lx/10,0)
(arima.out <- arima(x[1:nx], order=c(par6,par3,par7), seasonal=list(order=c(par8,par4,par9), period=par5), include.mean=par10, method='ML'))
(forecast <- predict(arima.out,fx))
(lb <- forecast$pred - 1.96 * forecast$se)
(ub <- forecast$pred + 1.96 * forecast$se)
if (par2 == 0) {
x <- exp(x)
forecast$pred <- exp(forecast$pred)
lb <- exp(lb)
ub <- exp(ub)
}
if (par2 != 0) {
x <- x^(1/par2)
forecast$pred <- forecast$pred^(1/par2)
lb <- lb^(1/par2)
ub <- ub^(1/par2)
}
if (par2 < 0) {
olb <- lb
lb <- ub
ub <- olb
}
(actandfor <- c(x[1:nx], forecast$pred))
(perc.se <- (ub-forecast$pred)/1.96/forecast$pred)
bitmap(file='test1.png')
opar <- par(mar=c(4,4,2,2),las=1)
ylim <- c( min(x[first:nx],lb), max(x[first:nx],ub))
plot(x,ylim=ylim,type='n',xlim=c(first,lx))
usr <- par('usr')
rect(usr[1],usr[3],nx+1,usr[4],border=NA,col='lemonchiffon')
rect(nx1,usr[3],usr[2],usr[4],border=NA,col='lavender')
abline(h= (-3:3)*2 , col ='gray', lty =3)
polygon( c(nx1:lx,lx:nx1), c(lb,rev(ub)), col = 'orange', lty=2,border=NA)
lines(nx1:lx, lb , lty=2)
lines(nx1:lx, ub , lty=2)
lines(x, lwd=2)
lines(nx1:lx, forecast$pred , lwd=2 , col ='white')
box()
par(opar)
dev.off()
prob.dec <- array(NA, dim=fx)
prob.sdec <- array(NA, dim=fx)
prob.ldec <- array(NA, dim=fx)
prob.pval <- array(NA, dim=fx)
perf.pe <- array(0, dim=fx)
perf.mape <- array(0, dim=fx)
perf.se <- array(0, dim=fx)
perf.mse <- array(0, dim=fx)
perf.rmse <- array(0, dim=fx)
for (i in 1:fx) {
locSD <- (ub[i] - forecast$pred[i]) / 1.96
perf.pe[i] = (x[nx+i] - forecast$pred[i]) / forecast$pred[i]
perf.mape[i] = perf.mape[i] + abs(perf.pe[i])
perf.se[i] = (x[nx+i] - forecast$pred[i])^2
perf.mse[i] = perf.mse[i] + perf.se[i]
prob.dec[i] = pnorm((x[nx+i-1] - forecast$pred[i]) / locSD)
prob.sdec[i] = pnorm((x[nx+i-par5] - forecast$pred[i]) / locSD)
prob.ldec[i] = pnorm((x[nx] - forecast$pred[i]) / locSD)
prob.pval[i] = pnorm(abs(x[nx+i] - forecast$pred[i]) / locSD)
}
perf.mape = perf.mape / fx
perf.mse = perf.mse / fx
perf.rmse = sqrt(perf.mse)
bitmap(file='test2.png')
plot(forecast$pred, pch=19, type='b',main='ARIMA Extrapolation Forecast', ylab='Forecast and 95% CI', xlab='time',ylim=c(min(lb),max(ub)))
dum <- forecast$pred
dum[1:12] <- x[(nx+1):lx]
lines(dum, lty=1)
lines(ub,lty=3)
lines(lb,lty=3)
dev.off()
load(file='createtable')
a<-table.start()
a<-table.row.start(a)
a<-table.element(a,'Univariate ARIMA Extrapolation Forecast',9,TRUE)
a<-table.row.end(a)
a<-table.row.start(a)
a<-table.element(a,'time',1,header=TRUE)
a<-table.element(a,'Y[t]',1,header=TRUE)
a<-table.element(a,'F[t]',1,header=TRUE)
a<-table.element(a,'95% LB',1,header=TRUE)
a<-table.element(a,'95% UB',1,header=TRUE)
a<-table.element(a,'p-value
(H0: Y[t] = F[t])',1,header=TRUE)
a<-table.element(a,'P(F[t]>Y[t-1])',1,header=TRUE)
a<-table.element(a,'P(F[t]>Y[t-s])',1,header=TRUE)
mylab <- paste('P(F[t]>Y[',nx,sep='')
mylab <- paste(mylab,'])',sep='')
a<-table.element(a,mylab,1,header=TRUE)
a<-table.row.end(a)
for (i in (nx-par5):nx) {
a<-table.row.start(a)
a<-table.element(a,i,header=TRUE)
a<-table.element(a,x[i])
a<-table.element(a,'-')
a<-table.row.end(a)
}
for (i in 1:fx) {
a<-table.row.start(a)
a<-table.element(a,nx+i,header=TRUE)
a<-table.element(a,round(x[nx+i],4))
a<-table.element(a,round(forecast$pred[i],4))
a<-table.element(a,round(lb[i],4))
a<-table.element(a,round(ub[i],4))
a<-table.element(a,round((1-prob.pval[i]),4))
a<-table.element(a,round((1-prob.dec[i]),4))
a<-table.element(a,round((1-prob.sdec[i]),4))
a<-table.element(a,round((1-prob.ldec[i]),4))
a<-table.row.end(a)
}
a<-table.end(a)
table.save(a,file='mytable.tab')
a<-table.start()
a<-table.row.start(a)
a<-table.element(a,'Univariate ARIMA Extrapolation Forecast Performance',7,TRUE)
a<-table.row.end(a)
a<-table.row.start(a)
a<-table.element(a,'time',1,header=TRUE)
a<-table.element(a,'% S.E.',1,header=TRUE)
a<-table.element(a,'PE',1,header=TRUE)
a<-table.element(a,'MAPE',1,header=TRUE)
a<-table.element(a,'Sq.E',1,header=TRUE)
a<-table.element(a,'MSE',1,header=TRUE)
a<-table.element(a,'RMSE',1,header=TRUE)
a<-table.row.end(a)
for (i in 1:fx) {
a<-table.row.start(a)
a<-table.element(a,nx+i,header=TRUE)
a<-table.element(a,round(perc.se[i],4))
a<-table.element(a,round(perf.pe[i],4))
a<-table.element(a,round(perf.mape[i],4))
a<-table.element(a,round(perf.se[i],4))
a<-table.element(a,round(perf.mse[i],4))
a<-table.element(a,round(perf.rmse[i],4))
a<-table.row.end(a)
}
a<-table.end(a)
table.save(a,file='mytable1.tab')