Free Statistics

of Irreproducible Research!

Author's title

Author*The author of this computation has been verified*
R Software Modulerwasp_arimaforecasting.wasp
Title produced by softwareARIMA Forecasting
Date of computationTue, 16 Dec 2008 12:08:42 -0700
Cite this page as followsStatistical Computations at FreeStatistics.org, Office for Research Development and Education, URL https://freestatistics.org/blog/index.php?v=date/2008/Dec/16/t1229454605mldww4qexsi33fu.htm/, Retrieved Thu, 16 May 2024 01:22:10 +0000
Statistical Computations at FreeStatistics.org, Office for Research Development and Education, URL https://freestatistics.org/blog/index.php?pk=34124, Retrieved Thu, 16 May 2024 01:22:10 +0000
QR Codes:

Original text written by user:
IsPrivate?No (this computation is public)
User-defined keywords
Estimated Impact159
Family? (F = Feedback message, R = changed R code, M = changed R Module, P = changed Parameters, D = changed Data)
F     [ARIMA Forecasting] [] [2008-12-16 14:16:09] [74be16979710d4c4e7c6647856088456]
F   PD    [ARIMA Forecasting] [workshop 9-step 1] [2008-12-16 19:08:42] [a16dfd7e948381d8b6391003c5d09447] [Current]
Feedback Forum
2008-12-23 20:17:49 [Sören Van Donink] [reply
step1: lijkt me correct opgelost
step2: idem
step3: idem
step4: Voor stap 4 moet je naar de laatste 3 kolommen kijken van de eerste tabel.Het model dat berekend wordt, gaat uit van een normaalverdeling. Alle residu's moeten normaal verdeeld zijn. Dit kun je zien door te kijken naar de density plot, de QQ-plot,... van de residu's die in de vorige workshop berekend zijn. Zo kun je zien of deze assumptie vervuld is. Wanneer dit niet het geval blijkt te zijn, zullen de p-waarde, de waarschijnlijkheden,... anders zijn omdat het model van een normaalverdeling uitgaat.
step5: maakt gebruik van de eerste tabel, vooral de kolommen Y(t), F(t) en de p-value. Als de p-waarde groter is dan 5% (wat hier meestal zo is) wil dit zeggen dat het verschil tussen de voorspelde waarde en de werkelijke waarde niet significant is.

Post a new message
Dataseries X:
7.5
7.2
6.9
6.7
6.4
6.3
6.8
7.3
7.1
7.1
6.8
6.5
6.3
6.1
6.1
6.3
6.3
6
6.2
6.4
6.8
7.5
7.5
7.6
7.6
7.4
7.3
7.1
6.9
6.8
7.5
7.6
7.8
8
8.1
8.2
8.3
8.2
8
7.9
7.6
7.6
8.2
8.3
8.4
8.4
8.4
8.6
8.9
8.8
8.3
7.5
7.2
7.5
8.8
9.3
9.3
8.7
8.2
8.3
8.5
8.6
8.6
8.2
8.1
8
8.6
8.7
8.8
8.5
8.4
8.5
8.7
8.7
8.6
8.5
8.3
8.1
8.2
8.1
8.1
7.9
7.9
7.9
8
8
7.9
8
7.7
7.2
7.5
7.3
7
7
7
7.2
7.3
7.1
6.8
6.6
6.2
6.2
6.8
6.9
6.8
6.7


Summary of computational transaction
Raw Inputview raw input (R code)
Raw Outputview raw output of R engine
Computing time1 seconds
R Server'George Udny Yule' @ 72.249.76.132

\begin{tabular}{lllllllll}
\hline
Summary of computational transaction \tabularnewline
Raw Input & view raw input (R code)  \tabularnewline
Raw Output & view raw output of R engine  \tabularnewline
Computing time & 1 seconds \tabularnewline
R Server & 'George Udny Yule' @ 72.249.76.132 \tabularnewline
\hline
\end{tabular}
%Source: https://freestatistics.org/blog/index.php?pk=34124&T=0

[TABLE]
[ROW][C]Summary of computational transaction[/C][/ROW]
[ROW][C]Raw Input[/C][C]view raw input (R code) [/C][/ROW]
[ROW][C]Raw Output[/C][C]view raw output of R engine [/C][/ROW]
[ROW][C]Computing time[/C][C]1 seconds[/C][/ROW]
[ROW][C]R Server[/C][C]'George Udny Yule' @ 72.249.76.132[/C][/ROW]
[/TABLE]
Source: https://freestatistics.org/blog/index.php?pk=34124&T=0

Globally Unique Identifier (entire table): ba.freestatistics.org/blog/index.php?pk=34124&T=0

As an alternative you can also use a QR Code:  

The GUIDs for individual cells are displayed in the table below:

Summary of computational transaction
Raw Inputview raw input (R code)
Raw Outputview raw output of R engine
Computing time1 seconds
R Server'George Udny Yule' @ 72.249.76.132


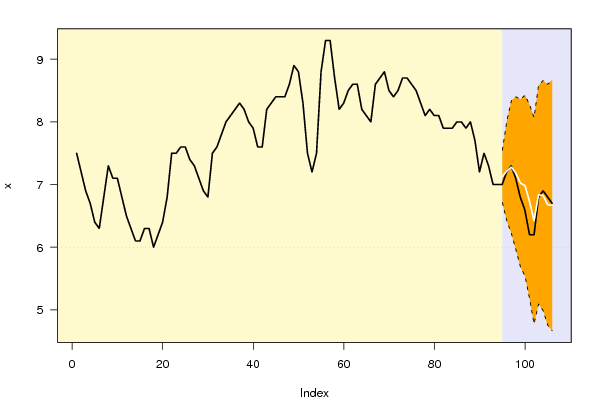
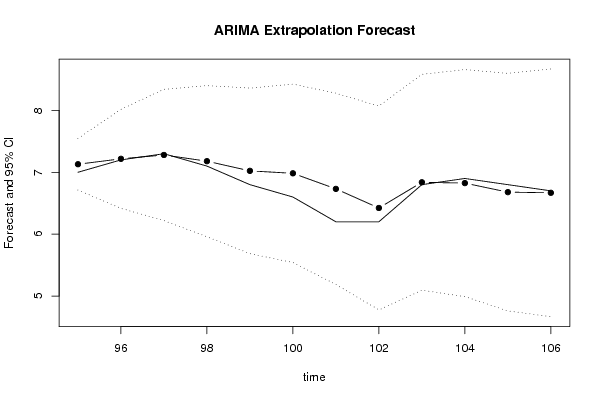
Univariate ARIMA Extrapolation Forecast
timeY[t]F[t]95% LB95% UBp-value(H0: Y[t] = F[t])P(F[t]>Y[t-1])P(F[t]>Y[t-s])P(F[t]>Y[94])
827.9-------
837.9-------
847.9-------
858-------
868-------
877.9-------
888-------
897.7-------
907.2-------
917.5-------
927.3-------
937-------
947-------
9577.12996.71217.54770.27120.72882e-040.7288
967.27.21746.41738.01750.4830.70280.04720.7028
977.37.27986.21918.34040.48510.55860.09160.6974
987.17.17945.95818.40080.44930.42330.0940.6133
996.87.0235.68568.36040.37190.45510.09940.5135
1006.66.98345.54168.42520.30110.59840.08350.491
1016.26.73175.18618.27730.25010.56630.10970.3668
1026.26.42314.77558.07070.39540.60460.17770.2463
1036.86.83825.09398.58250.48290.76340.22860.4279
1046.96.82524.99058.65990.46820.51070.3060.4259
1056.86.6794.75918.59890.45080.41070.37160.3716
1066.76.66844.66698.66990.48770.44870.37270.3727

\begin{tabular}{lllllllll}
\hline
Univariate ARIMA Extrapolation Forecast \tabularnewline
time & Y[t] & F[t] & 95% LB & 95% UB & p-value(H0: Y[t] = F[t]) & P(F[t]>Y[t-1]) & P(F[t]>Y[t-s]) & P(F[t]>Y[94]) \tabularnewline
82 & 7.9 & - & - & - & - & - & - & - \tabularnewline
83 & 7.9 & - & - & - & - & - & - & - \tabularnewline
84 & 7.9 & - & - & - & - & - & - & - \tabularnewline
85 & 8 & - & - & - & - & - & - & - \tabularnewline
86 & 8 & - & - & - & - & - & - & - \tabularnewline
87 & 7.9 & - & - & - & - & - & - & - \tabularnewline
88 & 8 & - & - & - & - & - & - & - \tabularnewline
89 & 7.7 & - & - & - & - & - & - & - \tabularnewline
90 & 7.2 & - & - & - & - & - & - & - \tabularnewline
91 & 7.5 & - & - & - & - & - & - & - \tabularnewline
92 & 7.3 & - & - & - & - & - & - & - \tabularnewline
93 & 7 & - & - & - & - & - & - & - \tabularnewline
94 & 7 & - & - & - & - & - & - & - \tabularnewline
95 & 7 & 7.1299 & 6.7121 & 7.5477 & 0.2712 & 0.7288 & 2e-04 & 0.7288 \tabularnewline
96 & 7.2 & 7.2174 & 6.4173 & 8.0175 & 0.483 & 0.7028 & 0.0472 & 0.7028 \tabularnewline
97 & 7.3 & 7.2798 & 6.2191 & 8.3404 & 0.4851 & 0.5586 & 0.0916 & 0.6974 \tabularnewline
98 & 7.1 & 7.1794 & 5.9581 & 8.4008 & 0.4493 & 0.4233 & 0.094 & 0.6133 \tabularnewline
99 & 6.8 & 7.023 & 5.6856 & 8.3604 & 0.3719 & 0.4551 & 0.0994 & 0.5135 \tabularnewline
100 & 6.6 & 6.9834 & 5.5416 & 8.4252 & 0.3011 & 0.5984 & 0.0835 & 0.491 \tabularnewline
101 & 6.2 & 6.7317 & 5.1861 & 8.2773 & 0.2501 & 0.5663 & 0.1097 & 0.3668 \tabularnewline
102 & 6.2 & 6.4231 & 4.7755 & 8.0707 & 0.3954 & 0.6046 & 0.1777 & 0.2463 \tabularnewline
103 & 6.8 & 6.8382 & 5.0939 & 8.5825 & 0.4829 & 0.7634 & 0.2286 & 0.4279 \tabularnewline
104 & 6.9 & 6.8252 & 4.9905 & 8.6599 & 0.4682 & 0.5107 & 0.306 & 0.4259 \tabularnewline
105 & 6.8 & 6.679 & 4.7591 & 8.5989 & 0.4508 & 0.4107 & 0.3716 & 0.3716 \tabularnewline
106 & 6.7 & 6.6684 & 4.6669 & 8.6699 & 0.4877 & 0.4487 & 0.3727 & 0.3727 \tabularnewline
\hline
\end{tabular}
%Source: https://freestatistics.org/blog/index.php?pk=34124&T=1

[TABLE]
[ROW][C]Univariate ARIMA Extrapolation Forecast[/C][/ROW]
[ROW][C]time[/C][C]Y[t][/C][C]F[t][/C][C]95% LB[/C][C]95% UB[/C][C]p-value(H0: Y[t] = F[t])[/C][C]P(F[t]>Y[t-1])[/C][C]P(F[t]>Y[t-s])[/C][C]P(F[t]>Y[94])[/C][/ROW]
[ROW][C]82[/C][C]7.9[/C][C]-[/C][C]-[/C][C]-[/C][C]-[/C][C]-[/C][C]-[/C][C]-[/C][/ROW]
[ROW][C]83[/C][C]7.9[/C][C]-[/C][C]-[/C][C]-[/C][C]-[/C][C]-[/C][C]-[/C][C]-[/C][/ROW]
[ROW][C]84[/C][C]7.9[/C][C]-[/C][C]-[/C][C]-[/C][C]-[/C][C]-[/C][C]-[/C][C]-[/C][/ROW]
[ROW][C]85[/C][C]8[/C][C]-[/C][C]-[/C][C]-[/C][C]-[/C][C]-[/C][C]-[/C][C]-[/C][/ROW]
[ROW][C]86[/C][C]8[/C][C]-[/C][C]-[/C][C]-[/C][C]-[/C][C]-[/C][C]-[/C][C]-[/C][/ROW]
[ROW][C]87[/C][C]7.9[/C][C]-[/C][C]-[/C][C]-[/C][C]-[/C][C]-[/C][C]-[/C][C]-[/C][/ROW]
[ROW][C]88[/C][C]8[/C][C]-[/C][C]-[/C][C]-[/C][C]-[/C][C]-[/C][C]-[/C][C]-[/C][/ROW]
[ROW][C]89[/C][C]7.7[/C][C]-[/C][C]-[/C][C]-[/C][C]-[/C][C]-[/C][C]-[/C][C]-[/C][/ROW]
[ROW][C]90[/C][C]7.2[/C][C]-[/C][C]-[/C][C]-[/C][C]-[/C][C]-[/C][C]-[/C][C]-[/C][/ROW]
[ROW][C]91[/C][C]7.5[/C][C]-[/C][C]-[/C][C]-[/C][C]-[/C][C]-[/C][C]-[/C][C]-[/C][/ROW]
[ROW][C]92[/C][C]7.3[/C][C]-[/C][C]-[/C][C]-[/C][C]-[/C][C]-[/C][C]-[/C][C]-[/C][/ROW]
[ROW][C]93[/C][C]7[/C][C]-[/C][C]-[/C][C]-[/C][C]-[/C][C]-[/C][C]-[/C][C]-[/C][/ROW]
[ROW][C]94[/C][C]7[/C][C]-[/C][C]-[/C][C]-[/C][C]-[/C][C]-[/C][C]-[/C][C]-[/C][/ROW]
[ROW][C]95[/C][C]7[/C][C]7.1299[/C][C]6.7121[/C][C]7.5477[/C][C]0.2712[/C][C]0.7288[/C][C]2e-04[/C][C]0.7288[/C][/ROW]
[ROW][C]96[/C][C]7.2[/C][C]7.2174[/C][C]6.4173[/C][C]8.0175[/C][C]0.483[/C][C]0.7028[/C][C]0.0472[/C][C]0.7028[/C][/ROW]
[ROW][C]97[/C][C]7.3[/C][C]7.2798[/C][C]6.2191[/C][C]8.3404[/C][C]0.4851[/C][C]0.5586[/C][C]0.0916[/C][C]0.6974[/C][/ROW]
[ROW][C]98[/C][C]7.1[/C][C]7.1794[/C][C]5.9581[/C][C]8.4008[/C][C]0.4493[/C][C]0.4233[/C][C]0.094[/C][C]0.6133[/C][/ROW]
[ROW][C]99[/C][C]6.8[/C][C]7.023[/C][C]5.6856[/C][C]8.3604[/C][C]0.3719[/C][C]0.4551[/C][C]0.0994[/C][C]0.5135[/C][/ROW]
[ROW][C]100[/C][C]6.6[/C][C]6.9834[/C][C]5.5416[/C][C]8.4252[/C][C]0.3011[/C][C]0.5984[/C][C]0.0835[/C][C]0.491[/C][/ROW]
[ROW][C]101[/C][C]6.2[/C][C]6.7317[/C][C]5.1861[/C][C]8.2773[/C][C]0.2501[/C][C]0.5663[/C][C]0.1097[/C][C]0.3668[/C][/ROW]
[ROW][C]102[/C][C]6.2[/C][C]6.4231[/C][C]4.7755[/C][C]8.0707[/C][C]0.3954[/C][C]0.6046[/C][C]0.1777[/C][C]0.2463[/C][/ROW]
[ROW][C]103[/C][C]6.8[/C][C]6.8382[/C][C]5.0939[/C][C]8.5825[/C][C]0.4829[/C][C]0.7634[/C][C]0.2286[/C][C]0.4279[/C][/ROW]
[ROW][C]104[/C][C]6.9[/C][C]6.8252[/C][C]4.9905[/C][C]8.6599[/C][C]0.4682[/C][C]0.5107[/C][C]0.306[/C][C]0.4259[/C][/ROW]
[ROW][C]105[/C][C]6.8[/C][C]6.679[/C][C]4.7591[/C][C]8.5989[/C][C]0.4508[/C][C]0.4107[/C][C]0.3716[/C][C]0.3716[/C][/ROW]
[ROW][C]106[/C][C]6.7[/C][C]6.6684[/C][C]4.6669[/C][C]8.6699[/C][C]0.4877[/C][C]0.4487[/C][C]0.3727[/C][C]0.3727[/C][/ROW]
[/TABLE]
Source: https://freestatistics.org/blog/index.php?pk=34124&T=1

Globally Unique Identifier (entire table): ba.freestatistics.org/blog/index.php?pk=34124&T=1

As an alternative you can also use a QR Code:  

The GUIDs for individual cells are displayed in the table below:

Univariate ARIMA Extrapolation Forecast
timeY[t]F[t]95% LB95% UBp-value(H0: Y[t] = F[t])P(F[t]>Y[t-1])P(F[t]>Y[t-s])P(F[t]>Y[94])
827.9-------
837.9-------
847.9-------
858-------
868-------
877.9-------
888-------
897.7-------
907.2-------
917.5-------
927.3-------
937-------
947-------
9577.12996.71217.54770.27120.72882e-040.7288
967.27.21746.41738.01750.4830.70280.04720.7028
977.37.27986.21918.34040.48510.55860.09160.6974
987.17.17945.95818.40080.44930.42330.0940.6133
996.87.0235.68568.36040.37190.45510.09940.5135
1006.66.98345.54168.42520.30110.59840.08350.491
1016.26.73175.18618.27730.25010.56630.10970.3668
1026.26.42314.77558.07070.39540.60460.17770.2463
1036.86.83825.09398.58250.48290.76340.22860.4279
1046.96.82524.99058.65990.46820.51070.3060.4259
1056.86.6794.75918.59890.45080.41070.37160.3716
1066.76.66844.66698.66990.48770.44870.37270.3727


Univariate ARIMA Extrapolation Forecast Performance
time% S.E.PEMAPESq.EMSERMSE
950.0299-0.01820.00150.01690.00140.0375
960.0566-0.00242e-043e-0400.005
970.07430.00282e-044e-0400.0058
980.0868-0.01119e-040.00635e-040.0229
990.0972-0.03180.00260.04970.00410.0644
1000.1053-0.05490.00460.1470.01230.1107
1010.1171-0.0790.00660.28270.02360.1535
1020.1309-0.03470.00290.04980.00410.0644
1030.1301-0.00565e-040.00151e-040.011
1040.13710.0119e-040.00565e-040.0216
1050.14670.01810.00150.01460.00120.0349
1060.15310.00474e-040.0011e-040.0091

\begin{tabular}{lllllllll}
\hline
Univariate ARIMA Extrapolation Forecast Performance \tabularnewline
time & % S.E. & PE & MAPE & Sq.E & MSE & RMSE \tabularnewline
95 & 0.0299 & -0.0182 & 0.0015 & 0.0169 & 0.0014 & 0.0375 \tabularnewline
96 & 0.0566 & -0.0024 & 2e-04 & 3e-04 & 0 & 0.005 \tabularnewline
97 & 0.0743 & 0.0028 & 2e-04 & 4e-04 & 0 & 0.0058 \tabularnewline
98 & 0.0868 & -0.0111 & 9e-04 & 0.0063 & 5e-04 & 0.0229 \tabularnewline
99 & 0.0972 & -0.0318 & 0.0026 & 0.0497 & 0.0041 & 0.0644 \tabularnewline
100 & 0.1053 & -0.0549 & 0.0046 & 0.147 & 0.0123 & 0.1107 \tabularnewline
101 & 0.1171 & -0.079 & 0.0066 & 0.2827 & 0.0236 & 0.1535 \tabularnewline
102 & 0.1309 & -0.0347 & 0.0029 & 0.0498 & 0.0041 & 0.0644 \tabularnewline
103 & 0.1301 & -0.0056 & 5e-04 & 0.0015 & 1e-04 & 0.011 \tabularnewline
104 & 0.1371 & 0.011 & 9e-04 & 0.0056 & 5e-04 & 0.0216 \tabularnewline
105 & 0.1467 & 0.0181 & 0.0015 & 0.0146 & 0.0012 & 0.0349 \tabularnewline
106 & 0.1531 & 0.0047 & 4e-04 & 0.001 & 1e-04 & 0.0091 \tabularnewline
\hline
\end{tabular}
%Source: https://freestatistics.org/blog/index.php?pk=34124&T=2

[TABLE]
[ROW][C]Univariate ARIMA Extrapolation Forecast Performance[/C][/ROW]
[ROW][C]time[/C][C]% S.E.[/C][C]PE[/C][C]MAPE[/C][C]Sq.E[/C][C]MSE[/C][C]RMSE[/C][/ROW]
[ROW][C]95[/C][C]0.0299[/C][C]-0.0182[/C][C]0.0015[/C][C]0.0169[/C][C]0.0014[/C][C]0.0375[/C][/ROW]
[ROW][C]96[/C][C]0.0566[/C][C]-0.0024[/C][C]2e-04[/C][C]3e-04[/C][C]0[/C][C]0.005[/C][/ROW]
[ROW][C]97[/C][C]0.0743[/C][C]0.0028[/C][C]2e-04[/C][C]4e-04[/C][C]0[/C][C]0.0058[/C][/ROW]
[ROW][C]98[/C][C]0.0868[/C][C]-0.0111[/C][C]9e-04[/C][C]0.0063[/C][C]5e-04[/C][C]0.0229[/C][/ROW]
[ROW][C]99[/C][C]0.0972[/C][C]-0.0318[/C][C]0.0026[/C][C]0.0497[/C][C]0.0041[/C][C]0.0644[/C][/ROW]
[ROW][C]100[/C][C]0.1053[/C][C]-0.0549[/C][C]0.0046[/C][C]0.147[/C][C]0.0123[/C][C]0.1107[/C][/ROW]
[ROW][C]101[/C][C]0.1171[/C][C]-0.079[/C][C]0.0066[/C][C]0.2827[/C][C]0.0236[/C][C]0.1535[/C][/ROW]
[ROW][C]102[/C][C]0.1309[/C][C]-0.0347[/C][C]0.0029[/C][C]0.0498[/C][C]0.0041[/C][C]0.0644[/C][/ROW]
[ROW][C]103[/C][C]0.1301[/C][C]-0.0056[/C][C]5e-04[/C][C]0.0015[/C][C]1e-04[/C][C]0.011[/C][/ROW]
[ROW][C]104[/C][C]0.1371[/C][C]0.011[/C][C]9e-04[/C][C]0.0056[/C][C]5e-04[/C][C]0.0216[/C][/ROW]
[ROW][C]105[/C][C]0.1467[/C][C]0.0181[/C][C]0.0015[/C][C]0.0146[/C][C]0.0012[/C][C]0.0349[/C][/ROW]
[ROW][C]106[/C][C]0.1531[/C][C]0.0047[/C][C]4e-04[/C][C]0.001[/C][C]1e-04[/C][C]0.0091[/C][/ROW]
[/TABLE]
Source: https://freestatistics.org/blog/index.php?pk=34124&T=2

Globally Unique Identifier (entire table): ba.freestatistics.org/blog/index.php?pk=34124&T=2

As an alternative you can also use a QR Code:  

The GUIDs for individual cells are displayed in the table below:

Univariate ARIMA Extrapolation Forecast Performance
time% S.E.PEMAPESq.EMSERMSE
950.0299-0.01820.00150.01690.00140.0375
960.0566-0.00242e-043e-0400.005
970.07430.00282e-044e-0400.0058
980.0868-0.01119e-040.00635e-040.0229
990.0972-0.03180.00260.04970.00410.0644
1000.1053-0.05490.00460.1470.01230.1107
1010.1171-0.0790.00660.28270.02360.1535
1020.1309-0.03470.00290.04980.00410.0644
1030.1301-0.00565e-040.00151e-040.011
1040.13710.0119e-040.00565e-040.0216
1050.14670.01810.00150.01460.00120.0349
1060.15310.00474e-040.0011e-040.0091


Parameters (Session):
par1 = 12 ; par2 = 1.0 ; par3 = 1 ; par4 = 1 ; par5 = 12 ; par6 = 2 ; par7 = 0 ; par8 = 1 ; par9 = 1 ; par10 = FALSE ;
Parameters (R input):
par1 = 12 ; par2 = 1.0 ; par3 = 1 ; par4 = 1 ; par5 = 12 ; par6 = 2 ; par7 = 0 ; par8 = 1 ; par9 = 1 ; par10 = FALSE ;
R code (references can be found in the software module):
par1 <- as.numeric(par1) #cut off periods
par2 <- as.numeric(par2) #lambda
par3 <- as.numeric(par3) #degree of non-seasonal differencing
par4 <- as.numeric(par4) #degree of seasonal differencing
par5 <- as.numeric(par5) #seasonal period
par6 <- as.numeric(par6) #p
par7 <- as.numeric(par7) #q
par8 <- as.numeric(par8) #P
par9 <- as.numeric(par9) #Q
if (par10 == 'TRUE') par10 <- TRUE
if (par10 == 'FALSE') par10 <- FALSE
if (par2 == 0) x <- log(x)
if (par2 != 0) x <- x^par2
lx <- length(x)
first <- lx - 2*par1
nx <- lx - par1
nx1 <- nx + 1
fx <- lx - nx
if (fx < 1) {
fx <- par5
nx1 <- lx + fx - 1
first <- lx - 2*fx
}
first <- 1
if (fx < 3) fx <- round(lx/10,0)
(arima.out <- arima(x[1:nx], order=c(par6,par3,par7), seasonal=list(order=c(par8,par4,par9), period=par5), include.mean=par10, method='ML'))
(forecast <- predict(arima.out,fx))
(lb <- forecast$pred - 1.96 * forecast$se)
(ub <- forecast$pred + 1.96 * forecast$se)
if (par2 == 0) {
x <- exp(x)
forecast$pred <- exp(forecast$pred)
lb <- exp(lb)
ub <- exp(ub)
}
if (par2 != 0) {
x <- x^(1/par2)
forecast$pred <- forecast$pred^(1/par2)
lb <- lb^(1/par2)
ub <- ub^(1/par2)
}
if (par2 < 0) {
olb <- lb
lb <- ub
ub <- olb
}
(actandfor <- c(x[1:nx], forecast$pred))
(perc.se <- (ub-forecast$pred)/1.96/forecast$pred)
bitmap(file='test1.png')
opar <- par(mar=c(4,4,2,2),las=1)
ylim <- c( min(x[first:nx],lb), max(x[first:nx],ub))
plot(x,ylim=ylim,type='n',xlim=c(first,lx))
usr <- par('usr')
rect(usr[1],usr[3],nx+1,usr[4],border=NA,col='lemonchiffon')
rect(nx1,usr[3],usr[2],usr[4],border=NA,col='lavender')
abline(h= (-3:3)*2 , col ='gray', lty =3)
polygon( c(nx1:lx,lx:nx1), c(lb,rev(ub)), col = 'orange', lty=2,border=NA)
lines(nx1:lx, lb , lty=2)
lines(nx1:lx, ub , lty=2)
lines(x, lwd=2)
lines(nx1:lx, forecast$pred , lwd=2 , col ='white')
box()
par(opar)
dev.off()
prob.dec <- array(NA, dim=fx)
prob.sdec <- array(NA, dim=fx)
prob.ldec <- array(NA, dim=fx)
prob.pval <- array(NA, dim=fx)
perf.pe <- array(0, dim=fx)
perf.mape <- array(0, dim=fx)
perf.se <- array(0, dim=fx)
perf.mse <- array(0, dim=fx)
perf.rmse <- array(0, dim=fx)
for (i in 1:fx) {
locSD <- (ub[i] - forecast$pred[i]) / 1.96
perf.pe[i] = (x[nx+i] - forecast$pred[i]) / forecast$pred[i]
perf.mape[i] = perf.mape[i] + abs(perf.pe[i])
perf.se[i] = (x[nx+i] - forecast$pred[i])^2
perf.mse[i] = perf.mse[i] + perf.se[i]
prob.dec[i] = pnorm((x[nx+i-1] - forecast$pred[i]) / locSD)
prob.sdec[i] = pnorm((x[nx+i-par5] - forecast$pred[i]) / locSD)
prob.ldec[i] = pnorm((x[nx] - forecast$pred[i]) / locSD)
prob.pval[i] = pnorm(abs(x[nx+i] - forecast$pred[i]) / locSD)
}
perf.mape = perf.mape / fx
perf.mse = perf.mse / fx
perf.rmse = sqrt(perf.mse)
bitmap(file='test2.png')
plot(forecast$pred, pch=19, type='b',main='ARIMA Extrapolation Forecast', ylab='Forecast and 95% CI', xlab='time',ylim=c(min(lb),max(ub)))
dum <- forecast$pred
dum[1:12] <- x[(nx+1):lx]
lines(dum, lty=1)
lines(ub,lty=3)
lines(lb,lty=3)
dev.off()
load(file='createtable')
a<-table.start()
a<-table.row.start(a)
a<-table.element(a,'Univariate ARIMA Extrapolation Forecast',9,TRUE)
a<-table.row.end(a)
a<-table.row.start(a)
a<-table.element(a,'time',1,header=TRUE)
a<-table.element(a,'Y[t]',1,header=TRUE)
a<-table.element(a,'F[t]',1,header=TRUE)
a<-table.element(a,'95% LB',1,header=TRUE)
a<-table.element(a,'95% UB',1,header=TRUE)
a<-table.element(a,'p-value
(H0: Y[t] = F[t])',1,header=TRUE)
a<-table.element(a,'P(F[t]>Y[t-1])',1,header=TRUE)
a<-table.element(a,'P(F[t]>Y[t-s])',1,header=TRUE)
mylab <- paste('P(F[t]>Y[',nx,sep='')
mylab <- paste(mylab,'])',sep='')
a<-table.element(a,mylab,1,header=TRUE)
a<-table.row.end(a)
for (i in (nx-par5):nx) {
a<-table.row.start(a)
a<-table.element(a,i,header=TRUE)
a<-table.element(a,x[i])
a<-table.element(a,'-')
a<-table.row.end(a)
}
for (i in 1:fx) {
a<-table.row.start(a)
a<-table.element(a,nx+i,header=TRUE)
a<-table.element(a,round(x[nx+i],4))
a<-table.element(a,round(forecast$pred[i],4))
a<-table.element(a,round(lb[i],4))
a<-table.element(a,round(ub[i],4))
a<-table.element(a,round((1-prob.pval[i]),4))
a<-table.element(a,round((1-prob.dec[i]),4))
a<-table.element(a,round((1-prob.sdec[i]),4))
a<-table.element(a,round((1-prob.ldec[i]),4))
a<-table.row.end(a)
}
a<-table.end(a)
table.save(a,file='mytable.tab')
a<-table.start()
a<-table.row.start(a)
a<-table.element(a,'Univariate ARIMA Extrapolation Forecast Performance',7,TRUE)
a<-table.row.end(a)
a<-table.row.start(a)
a<-table.element(a,'time',1,header=TRUE)
a<-table.element(a,'% S.E.',1,header=TRUE)
a<-table.element(a,'PE',1,header=TRUE)
a<-table.element(a,'MAPE',1,header=TRUE)
a<-table.element(a,'Sq.E',1,header=TRUE)
a<-table.element(a,'MSE',1,header=TRUE)
a<-table.element(a,'RMSE',1,header=TRUE)
a<-table.row.end(a)
for (i in 1:fx) {
a<-table.row.start(a)
a<-table.element(a,nx+i,header=TRUE)
a<-table.element(a,round(perc.se[i],4))
a<-table.element(a,round(perf.pe[i],4))
a<-table.element(a,round(perf.mape[i],4))
a<-table.element(a,round(perf.se[i],4))
a<-table.element(a,round(perf.mse[i],4))
a<-table.element(a,round(perf.rmse[i],4))
a<-table.row.end(a)
}
a<-table.end(a)
table.save(a,file='mytable1.tab')