Free Statistics

of Irreproducible Research!

Author's title

Author*The author of this computation has been verified*
R Software Modulerwasp_arimaforecasting.wasp
Title produced by softwareARIMA Forecasting
Date of computationTue, 16 Dec 2008 12:06:14 -0700
Cite this page as followsStatistical Computations at FreeStatistics.org, Office for Research Development and Education, URL https://freestatistics.org/blog/index.php?v=date/2008/Dec/16/t12294544255snvn6i980ifgvg.htm/, Retrieved Wed, 15 May 2024 05:48:37 +0000
Statistical Computations at FreeStatistics.org, Office for Research Development and Education, URL https://freestatistics.org/blog/index.php?pk=34120, Retrieved Wed, 15 May 2024 05:48:37 +0000
QR Codes:

Original text written by user:
IsPrivate?No (this computation is public)
User-defined keywordsjenske_cole@hotmail.com
Estimated Impact167
Family? (F = Feedback message, R = changed R code, M = changed R Module, P = changed Parameters, D = changed Data)
F       [ARIMA Forecasting] [laatste opdracht] [2008-12-16 19:06:14] [120dfa2440e51a0cfc0f5296bc5d7460] [Current]
Feedback Forum
2008-12-23 20:16:39 [a52c0b60b41faef285dfd865152adc22] [reply
Step 1:
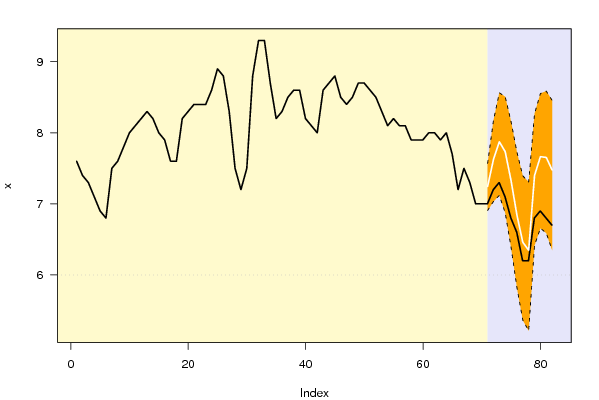
We gaan de testperiode gelijkstellen aan 12. Dit wil zeggen dat we de laatste 12 maanden in onze tijdreeks laten wegvallen en de computer berekent hier dan parameters. We gaan hierover dan een voorspelling maken en kijken of deze overeenkomt met de werkelijke gegevens.
Bij de interpretatie van de getallen in de tabel kan ik nog zeggen dat de tweede kolom de voorspelling weergeeft en de laatste kolom wat de kans is dat we stijgen tegenover de laatst gekende waarde. Je ziet in kolom 6 dat deze Yt en Ft vaak wel significant verschillend van 0 zijn, dit geeft aan dat het model nog niet correct is. In de grafiek moet je kijken naar de witte lijn, je ziet hier allereerst dat ze in het 95% betrouwbaarheidsinterval ligt, en ook dat ze het patroon van de zwarte lijn volgt (de werkelijke waarde).
Step 2:
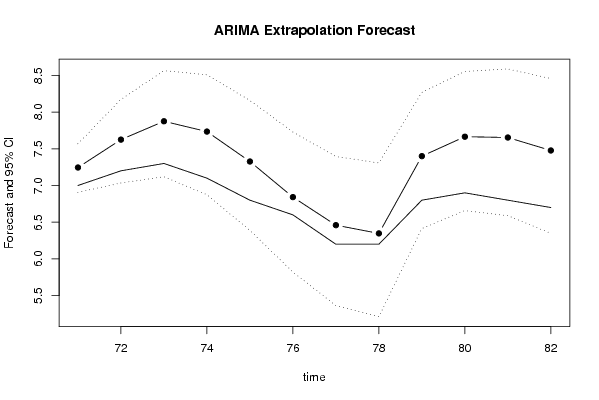
Hiervoor had je moeten kijken naar het ARIMA extrapolation forecast. De stippellijnen stellen hier het 95% betrouwbaarheidsinterval voor. De lijn met de bolletjes op is de voorspelling. Je ziet dat deze lijn zich in het interval bevindt en bovendien het patroon van de echte waarde volgt. Hier is ook een conjunctuurbeweging waar te nemen.
Step 3:
Hiervoor had je moeten kijken naar de tweede tabel. Het model berekent de procentuele standaardout op basis van de schatting (voorspelling). Zo voorspellen we bijvoorbeeld voor de eerste maand dat we er 2,3% naast zitten. Je ziet hier telkens lage waarden, wat een positief teken is.
PE: Dit is de werkelijke fout procentueel gezien. Zowel %SE als PE zullen vergroten naar de toekomst toe. Hoe verder in de toekomst je wil voorspellen, hoe minder zeker je bent van wat er naar de toekomst toe zal gebeuren.
Step 4:
De voorspelling kan als volgt geïnterpreteerd worden: de tijdreeks volgt een dalende trend en is niet seizoenaal gebonden.
Step 5:
De eerste grafiek toont ons een goed model: de witte lijn volgt mooi de zwarte en ligt ook binnen het 95% betrouwbaarheidsinterval. Ook de tweede grafiek (extrapolation forecast) toont ons dit.
Wel zie uit de tabel dat Yt en Ft verschillende keren significant verschillen van nul, wat kan betekenen dat het aan toeval te wijten is.
2008-12-24 09:49:22 [Sofie Mertens] [reply
De vragen werden niet beantwoord en dus kan ik ze ook niet evalueren. Op het feedback forum staat al wat de student zou moeten gedaan hebben.

Post a new message
Dataseries X:
7,6
7,4
7,3
7,1
6,9
6,8
7,5
7,6
7,8
8
8,1
8,2
8,3
8,2
8
7,9
7,6
7,6
8,2
8,3
8,4
8,4
8,4
8,6
8,9
8,8
8,3
7,5
7,2
7,5
8,8
9,3
9,3
8,7
8,2
8,3
8,5
8,6
8,6
8,2
8,1
8
8,6
8,7
8,8
8,5
8,4
8,5
8,7
8,7
8,6
8,5
8,3
8,1
8,2
8,1
8,1
7,9
7,9
7,9
8
8
7,9
8
7,7
7,2
7,5
7,3
7
7
7
7,2
7,3
7,1
6,8
6,6
6,2
6,2
6,8
6,9
6,8
6,7


Summary of computational transaction
Raw Inputview raw input (R code)
Raw Outputview raw output of R engine
Computing time20 seconds
R Server'Herman Ole Andreas Wold' @ 193.190.124.10:1001

\begin{tabular}{lllllllll}
\hline
Summary of computational transaction \tabularnewline
Raw Input & view raw input (R code)  \tabularnewline
Raw Output & view raw output of R engine  \tabularnewline
Computing time & 20 seconds \tabularnewline
R Server & 'Herman Ole Andreas Wold' @ 193.190.124.10:1001 \tabularnewline
\hline
\end{tabular}
%Source: https://freestatistics.org/blog/index.php?pk=34120&T=0

[TABLE]
[ROW][C]Summary of computational transaction[/C][/ROW]
[ROW][C]Raw Input[/C][C]view raw input (R code) [/C][/ROW]
[ROW][C]Raw Output[/C][C]view raw output of R engine [/C][/ROW]
[ROW][C]Computing time[/C][C]20 seconds[/C][/ROW]
[ROW][C]R Server[/C][C]'Herman Ole Andreas Wold' @ 193.190.124.10:1001[/C][/ROW]
[/TABLE]
Source: https://freestatistics.org/blog/index.php?pk=34120&T=0

Globally Unique Identifier (entire table): ba.freestatistics.org/blog/index.php?pk=34120&T=0

As an alternative you can also use a QR Code:  

The GUIDs for individual cells are displayed in the table below:

Summary of computational transaction
Raw Inputview raw input (R code)
Raw Outputview raw output of R engine
Computing time20 seconds
R Server'Herman Ole Andreas Wold' @ 193.190.124.10:1001


Univariate ARIMA Extrapolation Forecast
timeY[t]F[t]95% LB95% UBp-value(H0: Y[t] = F[t])P(F[t]>Y[t-1])P(F[t]>Y[t-s])P(F[t]>Y[70])
587.9-------
597.9-------
607.9-------
618-------
628-------
637.9-------
648-------
657.7-------
667.2-------
677.5-------
687.3-------
697-------
707-------
7177.24496.90657.56820.06880.931200.9312
727.27.62467.03438.17250.06440.98730.16230.9873
737.37.87427.11838.56360.05130.97240.36030.9935
747.17.73416.87468.50720.0540.86450.25010.9686
756.87.32676.38828.15790.10710.70350.08820.7794
766.66.84185.82217.72810.29640.53680.00520.3632
776.26.45985.36537.39410.29290.38430.00460.1285
786.26.34765.21437.30710.38160.61840.04080.0913
796.87.39966.41468.2680.0880.99660.41040.8164
806.97.66436.65818.5530.04590.97170.78920.9286
816.87.65316.58868.58670.03660.94310.91490.9149
826.77.47676.34878.45560.05990.91230.83010.8301

\begin{tabular}{lllllllll}
\hline
Univariate ARIMA Extrapolation Forecast \tabularnewline
time & Y[t] & F[t] & 95% LB & 95% UB & p-value(H0: Y[t] = F[t]) & P(F[t]>Y[t-1]) & P(F[t]>Y[t-s]) & P(F[t]>Y[70]) \tabularnewline
58 & 7.9 & - & - & - & - & - & - & - \tabularnewline
59 & 7.9 & - & - & - & - & - & - & - \tabularnewline
60 & 7.9 & - & - & - & - & - & - & - \tabularnewline
61 & 8 & - & - & - & - & - & - & - \tabularnewline
62 & 8 & - & - & - & - & - & - & - \tabularnewline
63 & 7.9 & - & - & - & - & - & - & - \tabularnewline
64 & 8 & - & - & - & - & - & - & - \tabularnewline
65 & 7.7 & - & - & - & - & - & - & - \tabularnewline
66 & 7.2 & - & - & - & - & - & - & - \tabularnewline
67 & 7.5 & - & - & - & - & - & - & - \tabularnewline
68 & 7.3 & - & - & - & - & - & - & - \tabularnewline
69 & 7 & - & - & - & - & - & - & - \tabularnewline
70 & 7 & - & - & - & - & - & - & - \tabularnewline
71 & 7 & 7.2449 & 6.9065 & 7.5682 & 0.0688 & 0.9312 & 0 & 0.9312 \tabularnewline
72 & 7.2 & 7.6246 & 7.0343 & 8.1725 & 0.0644 & 0.9873 & 0.1623 & 0.9873 \tabularnewline
73 & 7.3 & 7.8742 & 7.1183 & 8.5636 & 0.0513 & 0.9724 & 0.3603 & 0.9935 \tabularnewline
74 & 7.1 & 7.7341 & 6.8746 & 8.5072 & 0.054 & 0.8645 & 0.2501 & 0.9686 \tabularnewline
75 & 6.8 & 7.3267 & 6.3882 & 8.1579 & 0.1071 & 0.7035 & 0.0882 & 0.7794 \tabularnewline
76 & 6.6 & 6.8418 & 5.8221 & 7.7281 & 0.2964 & 0.5368 & 0.0052 & 0.3632 \tabularnewline
77 & 6.2 & 6.4598 & 5.3653 & 7.3941 & 0.2929 & 0.3843 & 0.0046 & 0.1285 \tabularnewline
78 & 6.2 & 6.3476 & 5.2143 & 7.3071 & 0.3816 & 0.6184 & 0.0408 & 0.0913 \tabularnewline
79 & 6.8 & 7.3996 & 6.4146 & 8.268 & 0.088 & 0.9966 & 0.4104 & 0.8164 \tabularnewline
80 & 6.9 & 7.6643 & 6.6581 & 8.553 & 0.0459 & 0.9717 & 0.7892 & 0.9286 \tabularnewline
81 & 6.8 & 7.6531 & 6.5886 & 8.5867 & 0.0366 & 0.9431 & 0.9149 & 0.9149 \tabularnewline
82 & 6.7 & 7.4767 & 6.3487 & 8.4556 & 0.0599 & 0.9123 & 0.8301 & 0.8301 \tabularnewline
\hline
\end{tabular}
%Source: https://freestatistics.org/blog/index.php?pk=34120&T=1

[TABLE]
[ROW][C]Univariate ARIMA Extrapolation Forecast[/C][/ROW]
[ROW][C]time[/C][C]Y[t][/C][C]F[t][/C][C]95% LB[/C][C]95% UB[/C][C]p-value(H0: Y[t] = F[t])[/C][C]P(F[t]>Y[t-1])[/C][C]P(F[t]>Y[t-s])[/C][C]P(F[t]>Y[70])[/C][/ROW]
[ROW][C]58[/C][C]7.9[/C][C]-[/C][C]-[/C][C]-[/C][C]-[/C][C]-[/C][C]-[/C][C]-[/C][/ROW]
[ROW][C]59[/C][C]7.9[/C][C]-[/C][C]-[/C][C]-[/C][C]-[/C][C]-[/C][C]-[/C][C]-[/C][/ROW]
[ROW][C]60[/C][C]7.9[/C][C]-[/C][C]-[/C][C]-[/C][C]-[/C][C]-[/C][C]-[/C][C]-[/C][/ROW]
[ROW][C]61[/C][C]8[/C][C]-[/C][C]-[/C][C]-[/C][C]-[/C][C]-[/C][C]-[/C][C]-[/C][/ROW]
[ROW][C]62[/C][C]8[/C][C]-[/C][C]-[/C][C]-[/C][C]-[/C][C]-[/C][C]-[/C][C]-[/C][/ROW]
[ROW][C]63[/C][C]7.9[/C][C]-[/C][C]-[/C][C]-[/C][C]-[/C][C]-[/C][C]-[/C][C]-[/C][/ROW]
[ROW][C]64[/C][C]8[/C][C]-[/C][C]-[/C][C]-[/C][C]-[/C][C]-[/C][C]-[/C][C]-[/C][/ROW]
[ROW][C]65[/C][C]7.7[/C][C]-[/C][C]-[/C][C]-[/C][C]-[/C][C]-[/C][C]-[/C][C]-[/C][/ROW]
[ROW][C]66[/C][C]7.2[/C][C]-[/C][C]-[/C][C]-[/C][C]-[/C][C]-[/C][C]-[/C][C]-[/C][/ROW]
[ROW][C]67[/C][C]7.5[/C][C]-[/C][C]-[/C][C]-[/C][C]-[/C][C]-[/C][C]-[/C][C]-[/C][/ROW]
[ROW][C]68[/C][C]7.3[/C][C]-[/C][C]-[/C][C]-[/C][C]-[/C][C]-[/C][C]-[/C][C]-[/C][/ROW]
[ROW][C]69[/C][C]7[/C][C]-[/C][C]-[/C][C]-[/C][C]-[/C][C]-[/C][C]-[/C][C]-[/C][/ROW]
[ROW][C]70[/C][C]7[/C][C]-[/C][C]-[/C][C]-[/C][C]-[/C][C]-[/C][C]-[/C][C]-[/C][/ROW]
[ROW][C]71[/C][C]7[/C][C]7.2449[/C][C]6.9065[/C][C]7.5682[/C][C]0.0688[/C][C]0.9312[/C][C]0[/C][C]0.9312[/C][/ROW]
[ROW][C]72[/C][C]7.2[/C][C]7.6246[/C][C]7.0343[/C][C]8.1725[/C][C]0.0644[/C][C]0.9873[/C][C]0.1623[/C][C]0.9873[/C][/ROW]
[ROW][C]73[/C][C]7.3[/C][C]7.8742[/C][C]7.1183[/C][C]8.5636[/C][C]0.0513[/C][C]0.9724[/C][C]0.3603[/C][C]0.9935[/C][/ROW]
[ROW][C]74[/C][C]7.1[/C][C]7.7341[/C][C]6.8746[/C][C]8.5072[/C][C]0.054[/C][C]0.8645[/C][C]0.2501[/C][C]0.9686[/C][/ROW]
[ROW][C]75[/C][C]6.8[/C][C]7.3267[/C][C]6.3882[/C][C]8.1579[/C][C]0.1071[/C][C]0.7035[/C][C]0.0882[/C][C]0.7794[/C][/ROW]
[ROW][C]76[/C][C]6.6[/C][C]6.8418[/C][C]5.8221[/C][C]7.7281[/C][C]0.2964[/C][C]0.5368[/C][C]0.0052[/C][C]0.3632[/C][/ROW]
[ROW][C]77[/C][C]6.2[/C][C]6.4598[/C][C]5.3653[/C][C]7.3941[/C][C]0.2929[/C][C]0.3843[/C][C]0.0046[/C][C]0.1285[/C][/ROW]
[ROW][C]78[/C][C]6.2[/C][C]6.3476[/C][C]5.2143[/C][C]7.3071[/C][C]0.3816[/C][C]0.6184[/C][C]0.0408[/C][C]0.0913[/C][/ROW]
[ROW][C]79[/C][C]6.8[/C][C]7.3996[/C][C]6.4146[/C][C]8.268[/C][C]0.088[/C][C]0.9966[/C][C]0.4104[/C][C]0.8164[/C][/ROW]
[ROW][C]80[/C][C]6.9[/C][C]7.6643[/C][C]6.6581[/C][C]8.553[/C][C]0.0459[/C][C]0.9717[/C][C]0.7892[/C][C]0.9286[/C][/ROW]
[ROW][C]81[/C][C]6.8[/C][C]7.6531[/C][C]6.5886[/C][C]8.5867[/C][C]0.0366[/C][C]0.9431[/C][C]0.9149[/C][C]0.9149[/C][/ROW]
[ROW][C]82[/C][C]6.7[/C][C]7.4767[/C][C]6.3487[/C][C]8.4556[/C][C]0.0599[/C][C]0.9123[/C][C]0.8301[/C][C]0.8301[/C][/ROW]
[/TABLE]
Source: https://freestatistics.org/blog/index.php?pk=34120&T=1

Globally Unique Identifier (entire table): ba.freestatistics.org/blog/index.php?pk=34120&T=1

As an alternative you can also use a QR Code:  

The GUIDs for individual cells are displayed in the table below:

Univariate ARIMA Extrapolation Forecast
timeY[t]F[t]95% LB95% UBp-value(H0: Y[t] = F[t])P(F[t]>Y[t-1])P(F[t]>Y[t-s])P(F[t]>Y[70])
587.9-------
597.9-------
607.9-------
618-------
628-------
637.9-------
648-------
657.7-------
667.2-------
677.5-------
687.3-------
697-------
707-------
7177.24496.90657.56820.06880.931200.9312
727.27.62467.03438.17250.06440.98730.16230.9873
737.37.87427.11838.56360.05130.97240.36030.9935
747.17.73416.87468.50720.0540.86450.25010.9686
756.87.32676.38828.15790.10710.70350.08820.7794
766.66.84185.82217.72810.29640.53680.00520.3632
776.26.45985.36537.39410.29290.38430.00460.1285
786.26.34765.21437.30710.38160.61840.04080.0913
796.87.39966.41468.2680.0880.99660.41040.8164
806.97.66436.65818.5530.04590.97170.78920.9286
816.87.65316.58868.58670.03660.94310.91490.9149
826.77.47676.34878.45560.05990.91230.83010.8301


Univariate ARIMA Extrapolation Forecast Performance
time% S.E.PEMAPESq.EMSERMSE
710.0228-0.03380.00280.060.0050.0707
720.0367-0.05570.00460.18030.0150.1226
730.0447-0.07290.00610.32970.02750.1658
740.051-0.0820.00680.40210.03350.1831
750.0579-0.07190.0060.27740.02310.152
760.0661-0.03530.00290.05850.00490.0698
770.0738-0.04020.00340.06750.00560.075
780.0771-0.02320.00190.02180.00180.0426
790.0599-0.0810.00680.35950.030.1731
800.0592-0.09970.00830.58420.04870.2206
810.0622-0.11150.00930.72780.06070.2463
820.0668-0.10390.00870.60330.05030.2242

\begin{tabular}{lllllllll}
\hline
Univariate ARIMA Extrapolation Forecast Performance \tabularnewline
time & % S.E. & PE & MAPE & Sq.E & MSE & RMSE \tabularnewline
71 & 0.0228 & -0.0338 & 0.0028 & 0.06 & 0.005 & 0.0707 \tabularnewline
72 & 0.0367 & -0.0557 & 0.0046 & 0.1803 & 0.015 & 0.1226 \tabularnewline
73 & 0.0447 & -0.0729 & 0.0061 & 0.3297 & 0.0275 & 0.1658 \tabularnewline
74 & 0.051 & -0.082 & 0.0068 & 0.4021 & 0.0335 & 0.1831 \tabularnewline
75 & 0.0579 & -0.0719 & 0.006 & 0.2774 & 0.0231 & 0.152 \tabularnewline
76 & 0.0661 & -0.0353 & 0.0029 & 0.0585 & 0.0049 & 0.0698 \tabularnewline
77 & 0.0738 & -0.0402 & 0.0034 & 0.0675 & 0.0056 & 0.075 \tabularnewline
78 & 0.0771 & -0.0232 & 0.0019 & 0.0218 & 0.0018 & 0.0426 \tabularnewline
79 & 0.0599 & -0.081 & 0.0068 & 0.3595 & 0.03 & 0.1731 \tabularnewline
80 & 0.0592 & -0.0997 & 0.0083 & 0.5842 & 0.0487 & 0.2206 \tabularnewline
81 & 0.0622 & -0.1115 & 0.0093 & 0.7278 & 0.0607 & 0.2463 \tabularnewline
82 & 0.0668 & -0.1039 & 0.0087 & 0.6033 & 0.0503 & 0.2242 \tabularnewline
\hline
\end{tabular}
%Source: https://freestatistics.org/blog/index.php?pk=34120&T=2

[TABLE]
[ROW][C]Univariate ARIMA Extrapolation Forecast Performance[/C][/ROW]
[ROW][C]time[/C][C]% S.E.[/C][C]PE[/C][C]MAPE[/C][C]Sq.E[/C][C]MSE[/C][C]RMSE[/C][/ROW]
[ROW][C]71[/C][C]0.0228[/C][C]-0.0338[/C][C]0.0028[/C][C]0.06[/C][C]0.005[/C][C]0.0707[/C][/ROW]
[ROW][C]72[/C][C]0.0367[/C][C]-0.0557[/C][C]0.0046[/C][C]0.1803[/C][C]0.015[/C][C]0.1226[/C][/ROW]
[ROW][C]73[/C][C]0.0447[/C][C]-0.0729[/C][C]0.0061[/C][C]0.3297[/C][C]0.0275[/C][C]0.1658[/C][/ROW]
[ROW][C]74[/C][C]0.051[/C][C]-0.082[/C][C]0.0068[/C][C]0.4021[/C][C]0.0335[/C][C]0.1831[/C][/ROW]
[ROW][C]75[/C][C]0.0579[/C][C]-0.0719[/C][C]0.006[/C][C]0.2774[/C][C]0.0231[/C][C]0.152[/C][/ROW]
[ROW][C]76[/C][C]0.0661[/C][C]-0.0353[/C][C]0.0029[/C][C]0.0585[/C][C]0.0049[/C][C]0.0698[/C][/ROW]
[ROW][C]77[/C][C]0.0738[/C][C]-0.0402[/C][C]0.0034[/C][C]0.0675[/C][C]0.0056[/C][C]0.075[/C][/ROW]
[ROW][C]78[/C][C]0.0771[/C][C]-0.0232[/C][C]0.0019[/C][C]0.0218[/C][C]0.0018[/C][C]0.0426[/C][/ROW]
[ROW][C]79[/C][C]0.0599[/C][C]-0.081[/C][C]0.0068[/C][C]0.3595[/C][C]0.03[/C][C]0.1731[/C][/ROW]
[ROW][C]80[/C][C]0.0592[/C][C]-0.0997[/C][C]0.0083[/C][C]0.5842[/C][C]0.0487[/C][C]0.2206[/C][/ROW]
[ROW][C]81[/C][C]0.0622[/C][C]-0.1115[/C][C]0.0093[/C][C]0.7278[/C][C]0.0607[/C][C]0.2463[/C][/ROW]
[ROW][C]82[/C][C]0.0668[/C][C]-0.1039[/C][C]0.0087[/C][C]0.6033[/C][C]0.0503[/C][C]0.2242[/C][/ROW]
[/TABLE]
Source: https://freestatistics.org/blog/index.php?pk=34120&T=2

Globally Unique Identifier (entire table): ba.freestatistics.org/blog/index.php?pk=34120&T=2

As an alternative you can also use a QR Code:  

The GUIDs for individual cells are displayed in the table below:

Univariate ARIMA Extrapolation Forecast Performance
time% S.E.PEMAPESq.EMSERMSE
710.0228-0.03380.00280.060.0050.0707
720.0367-0.05570.00460.18030.0150.1226
730.0447-0.07290.00610.32970.02750.1658
740.051-0.0820.00680.40210.03350.1831
750.0579-0.07190.0060.27740.02310.152
760.0661-0.03530.00290.05850.00490.0698
770.0738-0.04020.00340.06750.00560.075
780.0771-0.02320.00190.02180.00180.0426
790.0599-0.0810.00680.35950.030.1731
800.0592-0.09970.00830.58420.04870.2206
810.0622-0.11150.00930.72780.06070.2463
820.0668-0.10390.00870.60330.05030.2242


Parameters (Session):
par1 = 12 ; par2 = 2.0 ; par3 = 0 ; par4 = 1 ; par5 = 12 ; par6 = 3 ; par7 = 2 ; par8 = 2 ; par9 = 1 ; par10 = FALSE ;
Parameters (R input):
par1 = 12 ; par2 = 2.0 ; par3 = 0 ; par4 = 1 ; par5 = 12 ; par6 = 3 ; par7 = 2 ; par8 = 2 ; par9 = 1 ; par10 = FALSE ;
R code (references can be found in the software module):
par1 <- as.numeric(par1) #cut off periods
par2 <- as.numeric(par2) #lambda
par3 <- as.numeric(par3) #degree of non-seasonal differencing
par4 <- as.numeric(par4) #degree of seasonal differencing
par5 <- as.numeric(par5) #seasonal period
par6 <- as.numeric(par6) #p
par7 <- as.numeric(par7) #q
par8 <- as.numeric(par8) #P
par9 <- as.numeric(par9) #Q
if (par10 == 'TRUE') par10 <- TRUE
if (par10 == 'FALSE') par10 <- FALSE
if (par2 == 0) x <- log(x)
if (par2 != 0) x <- x^par2
lx <- length(x)
first <- lx - 2*par1
nx <- lx - par1
nx1 <- nx + 1
fx <- lx - nx
if (fx < 1) {
fx <- par5
nx1 <- lx + fx - 1
first <- lx - 2*fx
}
first <- 1
if (fx < 3) fx <- round(lx/10,0)
(arima.out <- arima(x[1:nx], order=c(par6,par3,par7), seasonal=list(order=c(par8,par4,par9), period=par5), include.mean=par10, method='ML'))
(forecast <- predict(arima.out,fx))
(lb <- forecast$pred - 1.96 * forecast$se)
(ub <- forecast$pred + 1.96 * forecast$se)
if (par2 == 0) {
x <- exp(x)
forecast$pred <- exp(forecast$pred)
lb <- exp(lb)
ub <- exp(ub)
}
if (par2 != 0) {
x <- x^(1/par2)
forecast$pred <- forecast$pred^(1/par2)
lb <- lb^(1/par2)
ub <- ub^(1/par2)
}
if (par2 < 0) {
olb <- lb
lb <- ub
ub <- olb
}
(actandfor <- c(x[1:nx], forecast$pred))
(perc.se <- (ub-forecast$pred)/1.96/forecast$pred)
bitmap(file='test1.png')
opar <- par(mar=c(4,4,2,2),las=1)
ylim <- c( min(x[first:nx],lb), max(x[first:nx],ub))
plot(x,ylim=ylim,type='n',xlim=c(first,lx))
usr <- par('usr')
rect(usr[1],usr[3],nx+1,usr[4],border=NA,col='lemonchiffon')
rect(nx1,usr[3],usr[2],usr[4],border=NA,col='lavender')
abline(h= (-3:3)*2 , col ='gray', lty =3)
polygon( c(nx1:lx,lx:nx1), c(lb,rev(ub)), col = 'orange', lty=2,border=NA)
lines(nx1:lx, lb , lty=2)
lines(nx1:lx, ub , lty=2)
lines(x, lwd=2)
lines(nx1:lx, forecast$pred , lwd=2 , col ='white')
box()
par(opar)
dev.off()
prob.dec <- array(NA, dim=fx)
prob.sdec <- array(NA, dim=fx)
prob.ldec <- array(NA, dim=fx)
prob.pval <- array(NA, dim=fx)
perf.pe <- array(0, dim=fx)
perf.mape <- array(0, dim=fx)
perf.se <- array(0, dim=fx)
perf.mse <- array(0, dim=fx)
perf.rmse <- array(0, dim=fx)
for (i in 1:fx) {
locSD <- (ub[i] - forecast$pred[i]) / 1.96
perf.pe[i] = (x[nx+i] - forecast$pred[i]) / forecast$pred[i]
perf.mape[i] = perf.mape[i] + abs(perf.pe[i])
perf.se[i] = (x[nx+i] - forecast$pred[i])^2
perf.mse[i] = perf.mse[i] + perf.se[i]
prob.dec[i] = pnorm((x[nx+i-1] - forecast$pred[i]) / locSD)
prob.sdec[i] = pnorm((x[nx+i-par5] - forecast$pred[i]) / locSD)
prob.ldec[i] = pnorm((x[nx] - forecast$pred[i]) / locSD)
prob.pval[i] = pnorm(abs(x[nx+i] - forecast$pred[i]) / locSD)
}
perf.mape = perf.mape / fx
perf.mse = perf.mse / fx
perf.rmse = sqrt(perf.mse)
bitmap(file='test2.png')
plot(forecast$pred, pch=19, type='b',main='ARIMA Extrapolation Forecast', ylab='Forecast and 95% CI', xlab='time',ylim=c(min(lb),max(ub)))
dum <- forecast$pred
dum[1:12] <- x[(nx+1):lx]
lines(dum, lty=1)
lines(ub,lty=3)
lines(lb,lty=3)
dev.off()
load(file='createtable')
a<-table.start()
a<-table.row.start(a)
a<-table.element(a,'Univariate ARIMA Extrapolation Forecast',9,TRUE)
a<-table.row.end(a)
a<-table.row.start(a)
a<-table.element(a,'time',1,header=TRUE)
a<-table.element(a,'Y[t]',1,header=TRUE)
a<-table.element(a,'F[t]',1,header=TRUE)
a<-table.element(a,'95% LB',1,header=TRUE)
a<-table.element(a,'95% UB',1,header=TRUE)
a<-table.element(a,'p-value
(H0: Y[t] = F[t])',1,header=TRUE)
a<-table.element(a,'P(F[t]>Y[t-1])',1,header=TRUE)
a<-table.element(a,'P(F[t]>Y[t-s])',1,header=TRUE)
mylab <- paste('P(F[t]>Y[',nx,sep='')
mylab <- paste(mylab,'])',sep='')
a<-table.element(a,mylab,1,header=TRUE)
a<-table.row.end(a)
for (i in (nx-par5):nx) {
a<-table.row.start(a)
a<-table.element(a,i,header=TRUE)
a<-table.element(a,x[i])
a<-table.element(a,'-')
a<-table.row.end(a)
}
for (i in 1:fx) {
a<-table.row.start(a)
a<-table.element(a,nx+i,header=TRUE)
a<-table.element(a,round(x[nx+i],4))
a<-table.element(a,round(forecast$pred[i],4))
a<-table.element(a,round(lb[i],4))
a<-table.element(a,round(ub[i],4))
a<-table.element(a,round((1-prob.pval[i]),4))
a<-table.element(a,round((1-prob.dec[i]),4))
a<-table.element(a,round((1-prob.sdec[i]),4))
a<-table.element(a,round((1-prob.ldec[i]),4))
a<-table.row.end(a)
}
a<-table.end(a)
table.save(a,file='mytable.tab')
a<-table.start()
a<-table.row.start(a)
a<-table.element(a,'Univariate ARIMA Extrapolation Forecast Performance',7,TRUE)
a<-table.row.end(a)
a<-table.row.start(a)
a<-table.element(a,'time',1,header=TRUE)
a<-table.element(a,'% S.E.',1,header=TRUE)
a<-table.element(a,'PE',1,header=TRUE)
a<-table.element(a,'MAPE',1,header=TRUE)
a<-table.element(a,'Sq.E',1,header=TRUE)
a<-table.element(a,'MSE',1,header=TRUE)
a<-table.element(a,'RMSE',1,header=TRUE)
a<-table.row.end(a)
for (i in 1:fx) {
a<-table.row.start(a)
a<-table.element(a,nx+i,header=TRUE)
a<-table.element(a,round(perc.se[i],4))
a<-table.element(a,round(perf.pe[i],4))
a<-table.element(a,round(perf.mape[i],4))
a<-table.element(a,round(perf.se[i],4))
a<-table.element(a,round(perf.mse[i],4))
a<-table.element(a,round(perf.rmse[i],4))
a<-table.row.end(a)
}
a<-table.end(a)
table.save(a,file='mytable1.tab')