Free Statistics

of Irreproducible Research!

Author's title

Author*The author of this computation has been verified*
R Software Modulerwasp_arimaforecasting.wasp
Title produced by softwareARIMA Forecasting
Date of computationTue, 16 Dec 2008 12:04:44 -0700
Cite this page as followsStatistical Computations at FreeStatistics.org, Office for Research Development and Education, URL https://freestatistics.org/blog/index.php?v=date/2008/Dec/16/t12294543527cyup818p2qihri.htm/, Retrieved Wed, 15 May 2024 23:43:00 +0000
Statistical Computations at FreeStatistics.org, Office for Research Development and Education, URL https://freestatistics.org/blog/index.php?pk=34119, Retrieved Wed, 15 May 2024 23:43:00 +0000
QR Codes:

Original text written by user:
IsPrivate?No (this computation is public)
User-defined keywords
Estimated Impact238
Family? (F = Feedback message, R = changed R code, M = changed R Module, P = changed Parameters, D = changed Data)
-     [Standard Deviation-Mean Plot] [Paper SDM ] [2008-12-16 18:45:42] [7849b5cbaea5f05923be73656f726e58]
F RMP     [ARIMA Forecasting] [paper armina fore...] [2008-12-16 19:04:44] [c5d6d05aee6be5527ac4a30a8c3b8fe5] [Current]
-   PD      [ARIMA Forecasting] [Paper Armina fore...] [2008-12-24 14:03:19] [7849b5cbaea5f05923be73656f726e58]
Feedback Forum
2008-12-18 15:46:05 [Natalie De Wilde] [reply
De berekening is gemaakt in step 1, maar er is geen uitleg bij gegeven.
Vraag 2 tot 5 zijn niet opgelost!
2008-12-21 10:45:33 [Britt Severijns] [reply
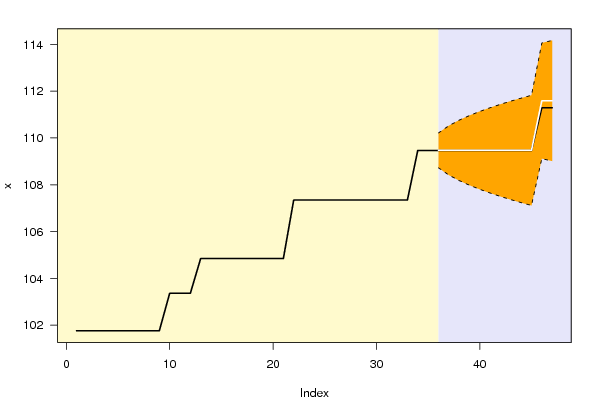
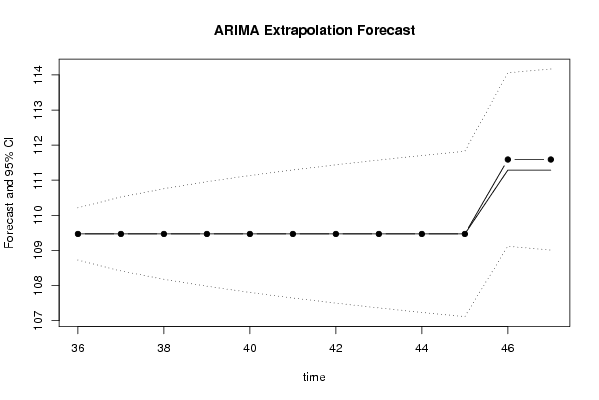
Er is enkel de output gegeven. Je had bij de eerste tabel kunnen uitleggen waarvoor elke kolom staat. Uit de tabel kun je ook afleiden dat de voorspelde waarden en de werkelijke waarden heel dicht bij elkaar liggen. de p-value is meestal 5 % dus het niet te wijten aan toeval. In de tweede tabel kun je afleiden dat de %SE van 0.0035 tot 0.0118 loopt. Er is dus maar een hele kleine afwijking. Als je de grafiekjes bekijkt zie dat zowel de bolletjes lijn (= voorspelde waarden) als de volle lijn (=de werkelijke waarden) ongeveer gelijk lopen. Je kan dus concluderen dat dit een goed model is.

Post a new message
Dataseries X:
101.76
101.76
101.76
101.76
101.76
101.76
101.76
101.76
101.76
103.36
103.36
103.36
104.85
104.85
104.85
104.85
104.85
104.85
104.85
104.85
104.85
107.35
107.35
107.35
107.35
107.35
107.35
107.35
107.35
107.35
107.35
107.35
107.35
109.47
109.47
109.47
109.47
109.47
109.47
109.47
109.47
109.47
109.47
109.47
109.47
111.29
111.29


Summary of computational transaction
Raw Inputview raw input (R code)
Raw Outputview raw output of R engine
Computing time3 seconds
R Server'Herman Ole Andreas Wold' @ 193.190.124.10:1001

\begin{tabular}{lllllllll}
\hline
Summary of computational transaction \tabularnewline
Raw Input & view raw input (R code)  \tabularnewline
Raw Output & view raw output of R engine  \tabularnewline
Computing time & 3 seconds \tabularnewline
R Server & 'Herman Ole Andreas Wold' @ 193.190.124.10:1001 \tabularnewline
\hline
\end{tabular}
%Source: https://freestatistics.org/blog/index.php?pk=34119&T=0

[TABLE]
[ROW][C]Summary of computational transaction[/C][/ROW]
[ROW][C]Raw Input[/C][C]view raw input (R code) [/C][/ROW]
[ROW][C]Raw Output[/C][C]view raw output of R engine [/C][/ROW]
[ROW][C]Computing time[/C][C]3 seconds[/C][/ROW]
[ROW][C]R Server[/C][C]'Herman Ole Andreas Wold' @ 193.190.124.10:1001[/C][/ROW]
[/TABLE]
Source: https://freestatistics.org/blog/index.php?pk=34119&T=0

Globally Unique Identifier (entire table): ba.freestatistics.org/blog/index.php?pk=34119&T=0

As an alternative you can also use a QR Code:  

The GUIDs for individual cells are displayed in the table below:

Summary of computational transaction
Raw Inputview raw input (R code)
Raw Outputview raw output of R engine
Computing time3 seconds
R Server'Herman Ole Andreas Wold' @ 193.190.124.10:1001


Univariate ARIMA Extrapolation Forecast
timeY[t]F[t]95% LB95% UBp-value(H0: Y[t] = F[t])P(F[t]>Y[t-1])P(F[t]>Y[t-s])P(F[t]>Y[35])
23107.35-------
24107.35-------
25107.35-------
26107.35-------
27107.35-------
28107.35-------
29107.35-------
30107.35-------
31107.35-------
32107.35-------
33107.35-------
34109.47-------
35109.47-------
36109.47109.47108.7255110.21450.50.510.5
37109.47109.47108.4171110.52290.50.510.5
38109.47109.47108.1804110.75960.50.50.99940.5
39109.47109.47107.9809110.95910.50.50.99740.5
40109.47109.47107.8052111.13480.50.50.99370.5
41109.47109.47107.6463111.29370.50.50.98860.5
42109.47109.47107.5002111.43980.50.50.98250.5
43109.47109.47107.3642111.57580.50.50.97580.5
44109.47109.47107.2364111.70360.50.50.96860.5
45109.47109.47107.1156111.82440.50.50.96120.5
46111.29111.59109.1207114.05930.40590.95380.95380.9538
47111.29111.59109.0109114.16910.40980.59020.94640.9464

\begin{tabular}{lllllllll}
\hline
Univariate ARIMA Extrapolation Forecast \tabularnewline
time & Y[t] & F[t] & 95% LB & 95% UB & p-value(H0: Y[t] = F[t]) & P(F[t]>Y[t-1]) & P(F[t]>Y[t-s]) & P(F[t]>Y[35]) \tabularnewline
23 & 107.35 & - & - & - & - & - & - & - \tabularnewline
24 & 107.35 & - & - & - & - & - & - & - \tabularnewline
25 & 107.35 & - & - & - & - & - & - & - \tabularnewline
26 & 107.35 & - & - & - & - & - & - & - \tabularnewline
27 & 107.35 & - & - & - & - & - & - & - \tabularnewline
28 & 107.35 & - & - & - & - & - & - & - \tabularnewline
29 & 107.35 & - & - & - & - & - & - & - \tabularnewline
30 & 107.35 & - & - & - & - & - & - & - \tabularnewline
31 & 107.35 & - & - & - & - & - & - & - \tabularnewline
32 & 107.35 & - & - & - & - & - & - & - \tabularnewline
33 & 107.35 & - & - & - & - & - & - & - \tabularnewline
34 & 109.47 & - & - & - & - & - & - & - \tabularnewline
35 & 109.47 & - & - & - & - & - & - & - \tabularnewline
36 & 109.47 & 109.47 & 108.7255 & 110.2145 & 0.5 & 0.5 & 1 & 0.5 \tabularnewline
37 & 109.47 & 109.47 & 108.4171 & 110.5229 & 0.5 & 0.5 & 1 & 0.5 \tabularnewline
38 & 109.47 & 109.47 & 108.1804 & 110.7596 & 0.5 & 0.5 & 0.9994 & 0.5 \tabularnewline
39 & 109.47 & 109.47 & 107.9809 & 110.9591 & 0.5 & 0.5 & 0.9974 & 0.5 \tabularnewline
40 & 109.47 & 109.47 & 107.8052 & 111.1348 & 0.5 & 0.5 & 0.9937 & 0.5 \tabularnewline
41 & 109.47 & 109.47 & 107.6463 & 111.2937 & 0.5 & 0.5 & 0.9886 & 0.5 \tabularnewline
42 & 109.47 & 109.47 & 107.5002 & 111.4398 & 0.5 & 0.5 & 0.9825 & 0.5 \tabularnewline
43 & 109.47 & 109.47 & 107.3642 & 111.5758 & 0.5 & 0.5 & 0.9758 & 0.5 \tabularnewline
44 & 109.47 & 109.47 & 107.2364 & 111.7036 & 0.5 & 0.5 & 0.9686 & 0.5 \tabularnewline
45 & 109.47 & 109.47 & 107.1156 & 111.8244 & 0.5 & 0.5 & 0.9612 & 0.5 \tabularnewline
46 & 111.29 & 111.59 & 109.1207 & 114.0593 & 0.4059 & 0.9538 & 0.9538 & 0.9538 \tabularnewline
47 & 111.29 & 111.59 & 109.0109 & 114.1691 & 0.4098 & 0.5902 & 0.9464 & 0.9464 \tabularnewline
\hline
\end{tabular}
%Source: https://freestatistics.org/blog/index.php?pk=34119&T=1

[TABLE]
[ROW][C]Univariate ARIMA Extrapolation Forecast[/C][/ROW]
[ROW][C]time[/C][C]Y[t][/C][C]F[t][/C][C]95% LB[/C][C]95% UB[/C][C]p-value(H0: Y[t] = F[t])[/C][C]P(F[t]>Y[t-1])[/C][C]P(F[t]>Y[t-s])[/C][C]P(F[t]>Y[35])[/C][/ROW]
[ROW][C]23[/C][C]107.35[/C][C]-[/C][C]-[/C][C]-[/C][C]-[/C][C]-[/C][C]-[/C][C]-[/C][/ROW]
[ROW][C]24[/C][C]107.35[/C][C]-[/C][C]-[/C][C]-[/C][C]-[/C][C]-[/C][C]-[/C][C]-[/C][/ROW]
[ROW][C]25[/C][C]107.35[/C][C]-[/C][C]-[/C][C]-[/C][C]-[/C][C]-[/C][C]-[/C][C]-[/C][/ROW]
[ROW][C]26[/C][C]107.35[/C][C]-[/C][C]-[/C][C]-[/C][C]-[/C][C]-[/C][C]-[/C][C]-[/C][/ROW]
[ROW][C]27[/C][C]107.35[/C][C]-[/C][C]-[/C][C]-[/C][C]-[/C][C]-[/C][C]-[/C][C]-[/C][/ROW]
[ROW][C]28[/C][C]107.35[/C][C]-[/C][C]-[/C][C]-[/C][C]-[/C][C]-[/C][C]-[/C][C]-[/C][/ROW]
[ROW][C]29[/C][C]107.35[/C][C]-[/C][C]-[/C][C]-[/C][C]-[/C][C]-[/C][C]-[/C][C]-[/C][/ROW]
[ROW][C]30[/C][C]107.35[/C][C]-[/C][C]-[/C][C]-[/C][C]-[/C][C]-[/C][C]-[/C][C]-[/C][/ROW]
[ROW][C]31[/C][C]107.35[/C][C]-[/C][C]-[/C][C]-[/C][C]-[/C][C]-[/C][C]-[/C][C]-[/C][/ROW]
[ROW][C]32[/C][C]107.35[/C][C]-[/C][C]-[/C][C]-[/C][C]-[/C][C]-[/C][C]-[/C][C]-[/C][/ROW]
[ROW][C]33[/C][C]107.35[/C][C]-[/C][C]-[/C][C]-[/C][C]-[/C][C]-[/C][C]-[/C][C]-[/C][/ROW]
[ROW][C]34[/C][C]109.47[/C][C]-[/C][C]-[/C][C]-[/C][C]-[/C][C]-[/C][C]-[/C][C]-[/C][/ROW]
[ROW][C]35[/C][C]109.47[/C][C]-[/C][C]-[/C][C]-[/C][C]-[/C][C]-[/C][C]-[/C][C]-[/C][/ROW]
[ROW][C]36[/C][C]109.47[/C][C]109.47[/C][C]108.7255[/C][C]110.2145[/C][C]0.5[/C][C]0.5[/C][C]1[/C][C]0.5[/C][/ROW]
[ROW][C]37[/C][C]109.47[/C][C]109.47[/C][C]108.4171[/C][C]110.5229[/C][C]0.5[/C][C]0.5[/C][C]1[/C][C]0.5[/C][/ROW]
[ROW][C]38[/C][C]109.47[/C][C]109.47[/C][C]108.1804[/C][C]110.7596[/C][C]0.5[/C][C]0.5[/C][C]0.9994[/C][C]0.5[/C][/ROW]
[ROW][C]39[/C][C]109.47[/C][C]109.47[/C][C]107.9809[/C][C]110.9591[/C][C]0.5[/C][C]0.5[/C][C]0.9974[/C][C]0.5[/C][/ROW]
[ROW][C]40[/C][C]109.47[/C][C]109.47[/C][C]107.8052[/C][C]111.1348[/C][C]0.5[/C][C]0.5[/C][C]0.9937[/C][C]0.5[/C][/ROW]
[ROW][C]41[/C][C]109.47[/C][C]109.47[/C][C]107.6463[/C][C]111.2937[/C][C]0.5[/C][C]0.5[/C][C]0.9886[/C][C]0.5[/C][/ROW]
[ROW][C]42[/C][C]109.47[/C][C]109.47[/C][C]107.5002[/C][C]111.4398[/C][C]0.5[/C][C]0.5[/C][C]0.9825[/C][C]0.5[/C][/ROW]
[ROW][C]43[/C][C]109.47[/C][C]109.47[/C][C]107.3642[/C][C]111.5758[/C][C]0.5[/C][C]0.5[/C][C]0.9758[/C][C]0.5[/C][/ROW]
[ROW][C]44[/C][C]109.47[/C][C]109.47[/C][C]107.2364[/C][C]111.7036[/C][C]0.5[/C][C]0.5[/C][C]0.9686[/C][C]0.5[/C][/ROW]
[ROW][C]45[/C][C]109.47[/C][C]109.47[/C][C]107.1156[/C][C]111.8244[/C][C]0.5[/C][C]0.5[/C][C]0.9612[/C][C]0.5[/C][/ROW]
[ROW][C]46[/C][C]111.29[/C][C]111.59[/C][C]109.1207[/C][C]114.0593[/C][C]0.4059[/C][C]0.9538[/C][C]0.9538[/C][C]0.9538[/C][/ROW]
[ROW][C]47[/C][C]111.29[/C][C]111.59[/C][C]109.0109[/C][C]114.1691[/C][C]0.4098[/C][C]0.5902[/C][C]0.9464[/C][C]0.9464[/C][/ROW]
[/TABLE]
Source: https://freestatistics.org/blog/index.php?pk=34119&T=1

Globally Unique Identifier (entire table): ba.freestatistics.org/blog/index.php?pk=34119&T=1

As an alternative you can also use a QR Code:  

The GUIDs for individual cells are displayed in the table below:

Univariate ARIMA Extrapolation Forecast
timeY[t]F[t]95% LB95% UBp-value(H0: Y[t] = F[t])P(F[t]>Y[t-1])P(F[t]>Y[t-s])P(F[t]>Y[35])
23107.35-------
24107.35-------
25107.35-------
26107.35-------
27107.35-------
28107.35-------
29107.35-------
30107.35-------
31107.35-------
32107.35-------
33107.35-------
34109.47-------
35109.47-------
36109.47109.47108.7255110.21450.50.510.5
37109.47109.47108.4171110.52290.50.510.5
38109.47109.47108.1804110.75960.50.50.99940.5
39109.47109.47107.9809110.95910.50.50.99740.5
40109.47109.47107.8052111.13480.50.50.99370.5
41109.47109.47107.6463111.29370.50.50.98860.5
42109.47109.47107.5002111.43980.50.50.98250.5
43109.47109.47107.3642111.57580.50.50.97580.5
44109.47109.47107.2364111.70360.50.50.96860.5
45109.47109.47107.1156111.82440.50.50.96120.5
46111.29111.59109.1207114.05930.40590.95380.95380.9538
47111.29111.59109.0109114.16910.40980.59020.94640.9464


Univariate ARIMA Extrapolation Forecast Performance
time% S.E.PEMAPESq.EMSERMSE
360.003500000
370.004900000
380.00600000
390.006900000
400.007800000
410.008500000
420.009200000
430.009800000
440.010400000
450.01100000
460.0113-0.00272e-040.090.00750.0866
470.0118-0.00272e-040.090.00750.0866

\begin{tabular}{lllllllll}
\hline
Univariate ARIMA Extrapolation Forecast Performance \tabularnewline
time & % S.E. & PE & MAPE & Sq.E & MSE & RMSE \tabularnewline
36 & 0.0035 & 0 & 0 & 0 & 0 & 0 \tabularnewline
37 & 0.0049 & 0 & 0 & 0 & 0 & 0 \tabularnewline
38 & 0.006 & 0 & 0 & 0 & 0 & 0 \tabularnewline
39 & 0.0069 & 0 & 0 & 0 & 0 & 0 \tabularnewline
40 & 0.0078 & 0 & 0 & 0 & 0 & 0 \tabularnewline
41 & 0.0085 & 0 & 0 & 0 & 0 & 0 \tabularnewline
42 & 0.0092 & 0 & 0 & 0 & 0 & 0 \tabularnewline
43 & 0.0098 & 0 & 0 & 0 & 0 & 0 \tabularnewline
44 & 0.0104 & 0 & 0 & 0 & 0 & 0 \tabularnewline
45 & 0.011 & 0 & 0 & 0 & 0 & 0 \tabularnewline
46 & 0.0113 & -0.0027 & 2e-04 & 0.09 & 0.0075 & 0.0866 \tabularnewline
47 & 0.0118 & -0.0027 & 2e-04 & 0.09 & 0.0075 & 0.0866 \tabularnewline
\hline
\end{tabular}
%Source: https://freestatistics.org/blog/index.php?pk=34119&T=2

[TABLE]
[ROW][C]Univariate ARIMA Extrapolation Forecast Performance[/C][/ROW]
[ROW][C]time[/C][C]% S.E.[/C][C]PE[/C][C]MAPE[/C][C]Sq.E[/C][C]MSE[/C][C]RMSE[/C][/ROW]
[ROW][C]36[/C][C]0.0035[/C][C]0[/C][C]0[/C][C]0[/C][C]0[/C][C]0[/C][/ROW]
[ROW][C]37[/C][C]0.0049[/C][C]0[/C][C]0[/C][C]0[/C][C]0[/C][C]0[/C][/ROW]
[ROW][C]38[/C][C]0.006[/C][C]0[/C][C]0[/C][C]0[/C][C]0[/C][C]0[/C][/ROW]
[ROW][C]39[/C][C]0.0069[/C][C]0[/C][C]0[/C][C]0[/C][C]0[/C][C]0[/C][/ROW]
[ROW][C]40[/C][C]0.0078[/C][C]0[/C][C]0[/C][C]0[/C][C]0[/C][C]0[/C][/ROW]
[ROW][C]41[/C][C]0.0085[/C][C]0[/C][C]0[/C][C]0[/C][C]0[/C][C]0[/C][/ROW]
[ROW][C]42[/C][C]0.0092[/C][C]0[/C][C]0[/C][C]0[/C][C]0[/C][C]0[/C][/ROW]
[ROW][C]43[/C][C]0.0098[/C][C]0[/C][C]0[/C][C]0[/C][C]0[/C][C]0[/C][/ROW]
[ROW][C]44[/C][C]0.0104[/C][C]0[/C][C]0[/C][C]0[/C][C]0[/C][C]0[/C][/ROW]
[ROW][C]45[/C][C]0.011[/C][C]0[/C][C]0[/C][C]0[/C][C]0[/C][C]0[/C][/ROW]
[ROW][C]46[/C][C]0.0113[/C][C]-0.0027[/C][C]2e-04[/C][C]0.09[/C][C]0.0075[/C][C]0.0866[/C][/ROW]
[ROW][C]47[/C][C]0.0118[/C][C]-0.0027[/C][C]2e-04[/C][C]0.09[/C][C]0.0075[/C][C]0.0866[/C][/ROW]
[/TABLE]
Source: https://freestatistics.org/blog/index.php?pk=34119&T=2

Globally Unique Identifier (entire table): ba.freestatistics.org/blog/index.php?pk=34119&T=2

As an alternative you can also use a QR Code:  

The GUIDs for individual cells are displayed in the table below:

Univariate ARIMA Extrapolation Forecast Performance
time% S.E.PEMAPESq.EMSERMSE
360.003500000
370.004900000
380.00600000
390.006900000
400.007800000
410.008500000
420.009200000
430.009800000
440.010400000
450.01100000
460.0113-0.00272e-040.090.00750.0866
470.0118-0.00272e-040.090.00750.0866


Parameters (Session):
par1 = 12 ; par2 = 1 ; par3 = 1 ; par4 = 1 ; par5 = 12 ; par6 = 1 ; par7 = 1 ; par8 = 0 ; par9 = 0 ; par10 = FALSE ;
Parameters (R input):
par1 = 12 ; par2 = 1 ; par3 = 1 ; par4 = 1 ; par5 = 12 ; par6 = 1 ; par7 = 1 ; par8 = 0 ; par9 = 0 ; par10 = FALSE ;
R code (references can be found in the software module):
par1 <- as.numeric(par1) #cut off periods
par2 <- as.numeric(par2) #lambda
par3 <- as.numeric(par3) #degree of non-seasonal differencing
par4 <- as.numeric(par4) #degree of seasonal differencing
par5 <- as.numeric(par5) #seasonal period
par6 <- as.numeric(par6) #p
par7 <- as.numeric(par7) #q
par8 <- as.numeric(par8) #P
par9 <- as.numeric(par9) #Q
if (par10 == 'TRUE') par10 <- TRUE
if (par10 == 'FALSE') par10 <- FALSE
if (par2 == 0) x <- log(x)
if (par2 != 0) x <- x^par2
lx <- length(x)
first <- lx - 2*par1
nx <- lx - par1
nx1 <- nx + 1
fx <- lx - nx
if (fx < 1) {
fx <- par5
nx1 <- lx + fx - 1
first <- lx - 2*fx
}
first <- 1
if (fx < 3) fx <- round(lx/10,0)
(arima.out <- arima(x[1:nx], order=c(par6,par3,par7), seasonal=list(order=c(par8,par4,par9), period=par5), include.mean=par10, method='ML'))
(forecast <- predict(arima.out,fx))
(lb <- forecast$pred - 1.96 * forecast$se)
(ub <- forecast$pred + 1.96 * forecast$se)
if (par2 == 0) {
x <- exp(x)
forecast$pred <- exp(forecast$pred)
lb <- exp(lb)
ub <- exp(ub)
}
if (par2 != 0) {
x <- x^(1/par2)
forecast$pred <- forecast$pred^(1/par2)
lb <- lb^(1/par2)
ub <- ub^(1/par2)
}
if (par2 < 0) {
olb <- lb
lb <- ub
ub <- olb
}
(actandfor <- c(x[1:nx], forecast$pred))
(perc.se <- (ub-forecast$pred)/1.96/forecast$pred)
bitmap(file='test1.png')
opar <- par(mar=c(4,4,2,2),las=1)
ylim <- c( min(x[first:nx],lb), max(x[first:nx],ub))
plot(x,ylim=ylim,type='n',xlim=c(first,lx))
usr <- par('usr')
rect(usr[1],usr[3],nx+1,usr[4],border=NA,col='lemonchiffon')
rect(nx1,usr[3],usr[2],usr[4],border=NA,col='lavender')
abline(h= (-3:3)*2 , col ='gray', lty =3)
polygon( c(nx1:lx,lx:nx1), c(lb,rev(ub)), col = 'orange', lty=2,border=NA)
lines(nx1:lx, lb , lty=2)
lines(nx1:lx, ub , lty=2)
lines(x, lwd=2)
lines(nx1:lx, forecast$pred , lwd=2 , col ='white')
box()
par(opar)
dev.off()
prob.dec <- array(NA, dim=fx)
prob.sdec <- array(NA, dim=fx)
prob.ldec <- array(NA, dim=fx)
prob.pval <- array(NA, dim=fx)
perf.pe <- array(0, dim=fx)
perf.mape <- array(0, dim=fx)
perf.se <- array(0, dim=fx)
perf.mse <- array(0, dim=fx)
perf.rmse <- array(0, dim=fx)
for (i in 1:fx) {
locSD <- (ub[i] - forecast$pred[i]) / 1.96
perf.pe[i] = (x[nx+i] - forecast$pred[i]) / forecast$pred[i]
perf.mape[i] = perf.mape[i] + abs(perf.pe[i])
perf.se[i] = (x[nx+i] - forecast$pred[i])^2
perf.mse[i] = perf.mse[i] + perf.se[i]
prob.dec[i] = pnorm((x[nx+i-1] - forecast$pred[i]) / locSD)
prob.sdec[i] = pnorm((x[nx+i-par5] - forecast$pred[i]) / locSD)
prob.ldec[i] = pnorm((x[nx] - forecast$pred[i]) / locSD)
prob.pval[i] = pnorm(abs(x[nx+i] - forecast$pred[i]) / locSD)
}
perf.mape = perf.mape / fx
perf.mse = perf.mse / fx
perf.rmse = sqrt(perf.mse)
bitmap(file='test2.png')
plot(forecast$pred, pch=19, type='b',main='ARIMA Extrapolation Forecast', ylab='Forecast and 95% CI', xlab='time',ylim=c(min(lb),max(ub)))
dum <- forecast$pred
dum[1:12] <- x[(nx+1):lx]
lines(dum, lty=1)
lines(ub,lty=3)
lines(lb,lty=3)
dev.off()
load(file='createtable')
a<-table.start()
a<-table.row.start(a)
a<-table.element(a,'Univariate ARIMA Extrapolation Forecast',9,TRUE)
a<-table.row.end(a)
a<-table.row.start(a)
a<-table.element(a,'time',1,header=TRUE)
a<-table.element(a,'Y[t]',1,header=TRUE)
a<-table.element(a,'F[t]',1,header=TRUE)
a<-table.element(a,'95% LB',1,header=TRUE)
a<-table.element(a,'95% UB',1,header=TRUE)
a<-table.element(a,'p-value
(H0: Y[t] = F[t])',1,header=TRUE)
a<-table.element(a,'P(F[t]>Y[t-1])',1,header=TRUE)
a<-table.element(a,'P(F[t]>Y[t-s])',1,header=TRUE)
mylab <- paste('P(F[t]>Y[',nx,sep='')
mylab <- paste(mylab,'])',sep='')
a<-table.element(a,mylab,1,header=TRUE)
a<-table.row.end(a)
for (i in (nx-par5):nx) {
a<-table.row.start(a)
a<-table.element(a,i,header=TRUE)
a<-table.element(a,x[i])
a<-table.element(a,'-')
a<-table.row.end(a)
}
for (i in 1:fx) {
a<-table.row.start(a)
a<-table.element(a,nx+i,header=TRUE)
a<-table.element(a,round(x[nx+i],4))
a<-table.element(a,round(forecast$pred[i],4))
a<-table.element(a,round(lb[i],4))
a<-table.element(a,round(ub[i],4))
a<-table.element(a,round((1-prob.pval[i]),4))
a<-table.element(a,round((1-prob.dec[i]),4))
a<-table.element(a,round((1-prob.sdec[i]),4))
a<-table.element(a,round((1-prob.ldec[i]),4))
a<-table.row.end(a)
}
a<-table.end(a)
table.save(a,file='mytable.tab')
a<-table.start()
a<-table.row.start(a)
a<-table.element(a,'Univariate ARIMA Extrapolation Forecast Performance',7,TRUE)
a<-table.row.end(a)
a<-table.row.start(a)
a<-table.element(a,'time',1,header=TRUE)
a<-table.element(a,'% S.E.',1,header=TRUE)
a<-table.element(a,'PE',1,header=TRUE)
a<-table.element(a,'MAPE',1,header=TRUE)
a<-table.element(a,'Sq.E',1,header=TRUE)
a<-table.element(a,'MSE',1,header=TRUE)
a<-table.element(a,'RMSE',1,header=TRUE)
a<-table.row.end(a)
for (i in 1:fx) {
a<-table.row.start(a)
a<-table.element(a,nx+i,header=TRUE)
a<-table.element(a,round(perc.se[i],4))
a<-table.element(a,round(perf.pe[i],4))
a<-table.element(a,round(perf.mape[i],4))
a<-table.element(a,round(perf.se[i],4))
a<-table.element(a,round(perf.mse[i],4))
a<-table.element(a,round(perf.rmse[i],4))
a<-table.row.end(a)
}
a<-table.end(a)
table.save(a,file='mytable1.tab')