Free Statistics

of Irreproducible Research!

Author's title

Author*Unverified author*
R Software Modulerwasp_arimaforecasting.wasp
Title produced by softwareARIMA Forecasting
Date of computationTue, 16 Dec 2008 11:58:05 -0700
Cite this page as followsStatistical Computations at FreeStatistics.org, Office for Research Development and Education, URL https://freestatistics.org/blog/index.php?v=date/2008/Dec/16/t1229453952zricrmok35odewc.htm/, Retrieved Wed, 15 May 2024 16:47:51 +0000
Statistical Computations at FreeStatistics.org, Office for Research Development and Education, URL https://freestatistics.org/blog/index.php?pk=34115, Retrieved Wed, 15 May 2024 16:47:51 +0000
QR Codes:

Original text written by user:
IsPrivate?No (this computation is public)
User-defined keywords
Estimated Impact140
Family? (F = Feedback message, R = changed R code, M = changed R Module, P = changed Parameters, D = changed Data)
F       [ARIMA Forecasting] [ARIMA ] [2008-12-16 18:58:05] [d41d8cd98f00b204e9800998ecf8427e] [Current]
Feedback Forum
2008-12-23 09:17:36 [Toon Wouters] [reply
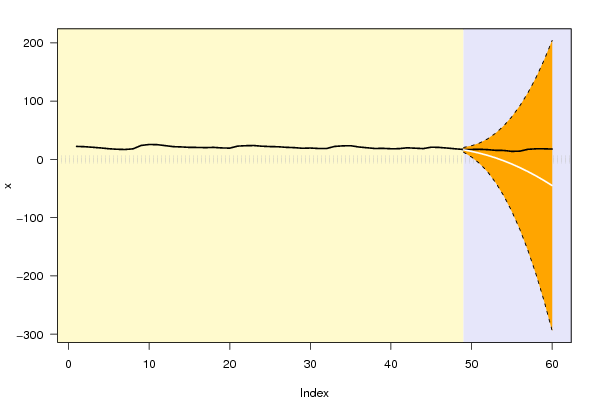
Step 1 : Bij deze stap werd er gevraagd of er explosieve voorspellingen werden gedaan. Hier kunnen we zeker niet spreken van explosieve voorspellingen, de voorspellingen vallen binnen het betrouwbaarheidsinterval (te zien op de eerste grafiek). Indien er geen explosieve voorspelling wordt gemaakt, zijn de AR-processen stabiel en zijn de MA-processen omkeerbaar.

Step 2 : In de grafiek kun je duidelijk zien dat er geen seizoenaliteit aanwezig is, hier zijn geen pieken waar te nemen. Je kan ook zien dat het patroon uit het verleden wordt verdergezet in de voorspelling.

Step 3 : Bij deze stap was het de bedoeling om te zien naar de Univariate ARIMA Extrapolation Forecast Performance-tabel. Daarin kon men de standaard fouten (SE) en de werkelijke fouten (PE) vast te stellen. Het is van belang dat de PE kleiner is dan de SE. En dit is overal het geval.

Step 4 : In deze stap had men naar de grote tabel (Univariate ARIMA Extrapolation Forecast) moeten zien.

Step 5 : Hier was het de bedoeling naar de detail grafiek van de voorspelde observaties te zien de stippelijnen geven het betrouwbaarheidsinterval weer (boven en ondergrens). We moeten dus gaan zoeken naar waar de voorspelde waarden dit interval overschrijden. We zien dat de waarden goed binnen het betrouwbaarheidsinterval liggen en dus niet significant verschillend zijn.
2008-12-23 11:35:13 [Sam De Block] [reply
STAP 1: Alles werd correct behandeld. Bij de allereerste grafiek merken we duidelijk dat de periode waarover we voorspellingen gaan doen binnen de betrouwbaarheidsgrenzen liggen. Je had er wel nog kunnen bijzeggen dat de zwarte en de witte lijn niet goed met elkaar overeen komen. Dit wil dus zeggen dat de voorspellingen niet goed overeen komen met de werkelijke waarden. Je hebt ook de tabellen goed behandeld. Zoals mijn collega hierboven ook al heeft vermeld heeft dit als gevolg dat we concluderen dat de AR-processen stabiel zijn en de MA-processen omkeerbaar.

STAP 2: Goede interpretatie. Je kon er wel nog bij vermelden dat de voorspellingen niet goed de werkelijke waarden benaderen. Ook is er in dit model geen sprake van conjunctuur en seizoenaliteit. Er zijn geen extreem hoge waarden weer te nemen die terug komen. We concluderen dat de werkelijke waarden in de toekomst een gelijkaardig verloop vertonen.

STAP 3: Redelijk goede interpretatie van de vraag. Je hebt duidelijk door we de standaardfout moeten gaan onderzoeken. Waar deze groter is dan 5%, is de voorspelling minder goed. Voorts had je er ook kunnen bijzeggen dat de p-waarde altijd kleiner moet zijn dan de standaardafwijking.

STAP 4: Ik vind geen interpretatie terug. Je moet hier kijken naar de p-waarde. Die stijgt bij elke volgende waarneming. Dit wijst erop dat de voorspellingen die gedaan worden minder en minder overeen komen met de werkelijke waarden.

STAP 5: Ook hier vind ik geen verwijzing terug. We kunnen spreken van een goed model als de witte en zwarte lijn redelijk goed overeen komen en als alles binnen het betrouwbaarheidsinterval ligt. In dit geval is dit niet zo. De voorspellingen komen niet goed overeen met de werkelijke waarden. Dit is goed te zien aan de witte lijn in die grafiek, die duidelijk afwijkt van de zwarte lijn die de werkelijke waarden weergeeft.

Post a new message
Dataseries X:
22.3
21.8
20.8
19.7
18.3
17.4
17
18.1
23.9
25.6
25.3
23.6
21.9
21.4
20.6
20.5
20.2
20.6
19.7
19.3
22.8
23.5
23.8
22.6
22
21.7
20.7
20.2
19.1
19.5
18.7
18.6
22.2
23.2
23.5
21.3
20
18.7
18.9
18.3
18.4
19.9
19.2
18.5
20.9
20.5
19.4
18.1
17
17
17.3
16.7
15.5
15.3
13.7
14.1
17.3
18.1
18.1
17.7


Summary of computational transaction
Raw Inputview raw input (R code)
Raw Outputview raw output of R engine
Computing time1 seconds
R Server'Gwilym Jenkins' @ 72.249.127.135

\begin{tabular}{lllllllll}
\hline
Summary of computational transaction \tabularnewline
Raw Input & view raw input (R code)  \tabularnewline
Raw Output & view raw output of R engine  \tabularnewline
Computing time & 1 seconds \tabularnewline
R Server & 'Gwilym Jenkins' @ 72.249.127.135 \tabularnewline
\hline
\end{tabular}
%Source: https://freestatistics.org/blog/index.php?pk=34115&T=0

[TABLE]
[ROW][C]Summary of computational transaction[/C][/ROW]
[ROW][C]Raw Input[/C][C]view raw input (R code) [/C][/ROW]
[ROW][C]Raw Output[/C][C]view raw output of R engine [/C][/ROW]
[ROW][C]Computing time[/C][C]1 seconds[/C][/ROW]
[ROW][C]R Server[/C][C]'Gwilym Jenkins' @ 72.249.127.135[/C][/ROW]
[/TABLE]
Source: https://freestatistics.org/blog/index.php?pk=34115&T=0

Globally Unique Identifier (entire table): ba.freestatistics.org/blog/index.php?pk=34115&T=0

As an alternative you can also use a QR Code:  

The GUIDs for individual cells are displayed in the table below:

Summary of computational transaction
Raw Inputview raw input (R code)
Raw Outputview raw output of R engine
Computing time1 seconds
R Server'Gwilym Jenkins' @ 72.249.127.135


Univariate ARIMA Extrapolation Forecast
timeY[t]F[t]95% LB95% UBp-value(H0: Y[t] = F[t])P(F[t]>Y[t-1])P(F[t]>Y[t-s])P(F[t]>Y[48])
4719.4-------
4818.1-------
491716.449512.396520.50250.3950.21240.21240.2124
501713.77094.090323.45150.25660.25660.25660.1904
5117.310.5892-7.021928.20020.22760.23780.23780.2016
5216.76.89-21.535335.31530.24940.23640.23640.2198
5315.52.5546-40.045445.15470.27570.25760.25760.2372
5415.3-2.4398-62.575357.69560.28160.27940.27940.2516
5513.7-8.0034-89.286673.27980.30040.28710.28710.2645
5614.1-14.1685-120.484292.14710.30110.30370.30370.276
5717.3-20.9537-156.3905114.48320.28990.3060.3060.286
5818.1-28.3473-197.1625140.46790.29490.29810.29810.2949
5918.1-36.3405-242.9917170.31070.30280.30280.30280.3028
6017.7-44.9427-294.074204.18860.31110.310.310.31

\begin{tabular}{lllllllll}
\hline
Univariate ARIMA Extrapolation Forecast \tabularnewline
time & Y[t] & F[t] & 95% LB & 95% UB & p-value(H0: Y[t] = F[t]) & P(F[t]>Y[t-1]) & P(F[t]>Y[t-s]) & P(F[t]>Y[48]) \tabularnewline
47 & 19.4 & - & - & - & - & - & - & - \tabularnewline
48 & 18.1 & - & - & - & - & - & - & - \tabularnewline
49 & 17 & 16.4495 & 12.3965 & 20.5025 & 0.395 & 0.2124 & 0.2124 & 0.2124 \tabularnewline
50 & 17 & 13.7709 & 4.0903 & 23.4515 & 0.2566 & 0.2566 & 0.2566 & 0.1904 \tabularnewline
51 & 17.3 & 10.5892 & -7.0219 & 28.2002 & 0.2276 & 0.2378 & 0.2378 & 0.2016 \tabularnewline
52 & 16.7 & 6.89 & -21.5353 & 35.3153 & 0.2494 & 0.2364 & 0.2364 & 0.2198 \tabularnewline
53 & 15.5 & 2.5546 & -40.0454 & 45.1547 & 0.2757 & 0.2576 & 0.2576 & 0.2372 \tabularnewline
54 & 15.3 & -2.4398 & -62.5753 & 57.6956 & 0.2816 & 0.2794 & 0.2794 & 0.2516 \tabularnewline
55 & 13.7 & -8.0034 & -89.2866 & 73.2798 & 0.3004 & 0.2871 & 0.2871 & 0.2645 \tabularnewline
56 & 14.1 & -14.1685 & -120.4842 & 92.1471 & 0.3011 & 0.3037 & 0.3037 & 0.276 \tabularnewline
57 & 17.3 & -20.9537 & -156.3905 & 114.4832 & 0.2899 & 0.306 & 0.306 & 0.286 \tabularnewline
58 & 18.1 & -28.3473 & -197.1625 & 140.4679 & 0.2949 & 0.2981 & 0.2981 & 0.2949 \tabularnewline
59 & 18.1 & -36.3405 & -242.9917 & 170.3107 & 0.3028 & 0.3028 & 0.3028 & 0.3028 \tabularnewline
60 & 17.7 & -44.9427 & -294.074 & 204.1886 & 0.3111 & 0.31 & 0.31 & 0.31 \tabularnewline
\hline
\end{tabular}
%Source: https://freestatistics.org/blog/index.php?pk=34115&T=1

[TABLE]
[ROW][C]Univariate ARIMA Extrapolation Forecast[/C][/ROW]
[ROW][C]time[/C][C]Y[t][/C][C]F[t][/C][C]95% LB[/C][C]95% UB[/C][C]p-value(H0: Y[t] = F[t])[/C][C]P(F[t]>Y[t-1])[/C][C]P(F[t]>Y[t-s])[/C][C]P(F[t]>Y[48])[/C][/ROW]
[ROW][C]47[/C][C]19.4[/C][C]-[/C][C]-[/C][C]-[/C][C]-[/C][C]-[/C][C]-[/C][C]-[/C][/ROW]
[ROW][C]48[/C][C]18.1[/C][C]-[/C][C]-[/C][C]-[/C][C]-[/C][C]-[/C][C]-[/C][C]-[/C][/ROW]
[ROW][C]49[/C][C]17[/C][C]16.4495[/C][C]12.3965[/C][C]20.5025[/C][C]0.395[/C][C]0.2124[/C][C]0.2124[/C][C]0.2124[/C][/ROW]
[ROW][C]50[/C][C]17[/C][C]13.7709[/C][C]4.0903[/C][C]23.4515[/C][C]0.2566[/C][C]0.2566[/C][C]0.2566[/C][C]0.1904[/C][/ROW]
[ROW][C]51[/C][C]17.3[/C][C]10.5892[/C][C]-7.0219[/C][C]28.2002[/C][C]0.2276[/C][C]0.2378[/C][C]0.2378[/C][C]0.2016[/C][/ROW]
[ROW][C]52[/C][C]16.7[/C][C]6.89[/C][C]-21.5353[/C][C]35.3153[/C][C]0.2494[/C][C]0.2364[/C][C]0.2364[/C][C]0.2198[/C][/ROW]
[ROW][C]53[/C][C]15.5[/C][C]2.5546[/C][C]-40.0454[/C][C]45.1547[/C][C]0.2757[/C][C]0.2576[/C][C]0.2576[/C][C]0.2372[/C][/ROW]
[ROW][C]54[/C][C]15.3[/C][C]-2.4398[/C][C]-62.5753[/C][C]57.6956[/C][C]0.2816[/C][C]0.2794[/C][C]0.2794[/C][C]0.2516[/C][/ROW]
[ROW][C]55[/C][C]13.7[/C][C]-8.0034[/C][C]-89.2866[/C][C]73.2798[/C][C]0.3004[/C][C]0.2871[/C][C]0.2871[/C][C]0.2645[/C][/ROW]
[ROW][C]56[/C][C]14.1[/C][C]-14.1685[/C][C]-120.4842[/C][C]92.1471[/C][C]0.3011[/C][C]0.3037[/C][C]0.3037[/C][C]0.276[/C][/ROW]
[ROW][C]57[/C][C]17.3[/C][C]-20.9537[/C][C]-156.3905[/C][C]114.4832[/C][C]0.2899[/C][C]0.306[/C][C]0.306[/C][C]0.286[/C][/ROW]
[ROW][C]58[/C][C]18.1[/C][C]-28.3473[/C][C]-197.1625[/C][C]140.4679[/C][C]0.2949[/C][C]0.2981[/C][C]0.2981[/C][C]0.2949[/C][/ROW]
[ROW][C]59[/C][C]18.1[/C][C]-36.3405[/C][C]-242.9917[/C][C]170.3107[/C][C]0.3028[/C][C]0.3028[/C][C]0.3028[/C][C]0.3028[/C][/ROW]
[ROW][C]60[/C][C]17.7[/C][C]-44.9427[/C][C]-294.074[/C][C]204.1886[/C][C]0.3111[/C][C]0.31[/C][C]0.31[/C][C]0.31[/C][/ROW]
[/TABLE]
Source: https://freestatistics.org/blog/index.php?pk=34115&T=1

Globally Unique Identifier (entire table): ba.freestatistics.org/blog/index.php?pk=34115&T=1

As an alternative you can also use a QR Code:  

The GUIDs for individual cells are displayed in the table below:

Univariate ARIMA Extrapolation Forecast
timeY[t]F[t]95% LB95% UBp-value(H0: Y[t] = F[t])P(F[t]>Y[t-1])P(F[t]>Y[t-s])P(F[t]>Y[48])
4719.4-------
4818.1-------
491716.449512.396520.50250.3950.21240.21240.2124
501713.77094.090323.45150.25660.25660.25660.1904
5117.310.5892-7.021928.20020.22760.23780.23780.2016
5216.76.89-21.535335.31530.24940.23640.23640.2198
5315.52.5546-40.045445.15470.27570.25760.25760.2372
5415.3-2.4398-62.575357.69560.28160.27940.27940.2516
5513.7-8.0034-89.286673.27980.30040.28710.28710.2645
5614.1-14.1685-120.484292.14710.30110.30370.30370.276
5717.3-20.9537-156.3905114.48320.28990.3060.3060.286
5818.1-28.3473-197.1625140.46790.29490.29810.29810.2949
5918.1-36.3405-242.9917170.31070.30280.30280.30280.3028
6017.7-44.9427-294.074204.18860.31110.310.310.31


Univariate ARIMA Extrapolation Forecast Performance
time% S.E.PEMAPESq.EMSERMSE
490.12570.03350.00280.3030.02530.1589
500.35870.23450.019510.42710.86890.9322
510.84850.63370.052845.03553.7531.9373
522.10491.42380.118696.23568.01962.8319
538.5085.06740.4223167.582513.96523.737
54-12.5751-7.27090.6059314.70226.22525.1211
55-5.1817-2.71180.226471.038239.25326.2652
56-3.8284-1.99520.1663799.109566.59258.1604
57-3.2978-1.82560.15211463.3441121.945311.0429
58-3.0384-1.63850.13652157.3528179.779413.4082
59-2.9013-1.49810.12482963.769246.980715.7156
60-2.8282-1.39380.11623924.1044327.008718.0834

\begin{tabular}{lllllllll}
\hline
Univariate ARIMA Extrapolation Forecast Performance \tabularnewline
time & % S.E. & PE & MAPE & Sq.E & MSE & RMSE \tabularnewline
49 & 0.1257 & 0.0335 & 0.0028 & 0.303 & 0.0253 & 0.1589 \tabularnewline
50 & 0.3587 & 0.2345 & 0.0195 & 10.4271 & 0.8689 & 0.9322 \tabularnewline
51 & 0.8485 & 0.6337 & 0.0528 & 45.0355 & 3.753 & 1.9373 \tabularnewline
52 & 2.1049 & 1.4238 & 0.1186 & 96.2356 & 8.0196 & 2.8319 \tabularnewline
53 & 8.508 & 5.0674 & 0.4223 & 167.5825 & 13.9652 & 3.737 \tabularnewline
54 & -12.5751 & -7.2709 & 0.6059 & 314.702 & 26.2252 & 5.1211 \tabularnewline
55 & -5.1817 & -2.7118 & 0.226 & 471.0382 & 39.2532 & 6.2652 \tabularnewline
56 & -3.8284 & -1.9952 & 0.1663 & 799.1095 & 66.5925 & 8.1604 \tabularnewline
57 & -3.2978 & -1.8256 & 0.1521 & 1463.3441 & 121.9453 & 11.0429 \tabularnewline
58 & -3.0384 & -1.6385 & 0.1365 & 2157.3528 & 179.7794 & 13.4082 \tabularnewline
59 & -2.9013 & -1.4981 & 0.1248 & 2963.769 & 246.9807 & 15.7156 \tabularnewline
60 & -2.8282 & -1.3938 & 0.1162 & 3924.1044 & 327.0087 & 18.0834 \tabularnewline
\hline
\end{tabular}
%Source: https://freestatistics.org/blog/index.php?pk=34115&T=2

[TABLE]
[ROW][C]Univariate ARIMA Extrapolation Forecast Performance[/C][/ROW]
[ROW][C]time[/C][C]% S.E.[/C][C]PE[/C][C]MAPE[/C][C]Sq.E[/C][C]MSE[/C][C]RMSE[/C][/ROW]
[ROW][C]49[/C][C]0.1257[/C][C]0.0335[/C][C]0.0028[/C][C]0.303[/C][C]0.0253[/C][C]0.1589[/C][/ROW]
[ROW][C]50[/C][C]0.3587[/C][C]0.2345[/C][C]0.0195[/C][C]10.4271[/C][C]0.8689[/C][C]0.9322[/C][/ROW]
[ROW][C]51[/C][C]0.8485[/C][C]0.6337[/C][C]0.0528[/C][C]45.0355[/C][C]3.753[/C][C]1.9373[/C][/ROW]
[ROW][C]52[/C][C]2.1049[/C][C]1.4238[/C][C]0.1186[/C][C]96.2356[/C][C]8.0196[/C][C]2.8319[/C][/ROW]
[ROW][C]53[/C][C]8.508[/C][C]5.0674[/C][C]0.4223[/C][C]167.5825[/C][C]13.9652[/C][C]3.737[/C][/ROW]
[ROW][C]54[/C][C]-12.5751[/C][C]-7.2709[/C][C]0.6059[/C][C]314.702[/C][C]26.2252[/C][C]5.1211[/C][/ROW]
[ROW][C]55[/C][C]-5.1817[/C][C]-2.7118[/C][C]0.226[/C][C]471.0382[/C][C]39.2532[/C][C]6.2652[/C][/ROW]
[ROW][C]56[/C][C]-3.8284[/C][C]-1.9952[/C][C]0.1663[/C][C]799.1095[/C][C]66.5925[/C][C]8.1604[/C][/ROW]
[ROW][C]57[/C][C]-3.2978[/C][C]-1.8256[/C][C]0.1521[/C][C]1463.3441[/C][C]121.9453[/C][C]11.0429[/C][/ROW]
[ROW][C]58[/C][C]-3.0384[/C][C]-1.6385[/C][C]0.1365[/C][C]2157.3528[/C][C]179.7794[/C][C]13.4082[/C][/ROW]
[ROW][C]59[/C][C]-2.9013[/C][C]-1.4981[/C][C]0.1248[/C][C]2963.769[/C][C]246.9807[/C][C]15.7156[/C][/ROW]
[ROW][C]60[/C][C]-2.8282[/C][C]-1.3938[/C][C]0.1162[/C][C]3924.1044[/C][C]327.0087[/C][C]18.0834[/C][/ROW]
[/TABLE]
Source: https://freestatistics.org/blog/index.php?pk=34115&T=2

Globally Unique Identifier (entire table): ba.freestatistics.org/blog/index.php?pk=34115&T=2

As an alternative you can also use a QR Code:  

The GUIDs for individual cells are displayed in the table below:

Univariate ARIMA Extrapolation Forecast Performance
time% S.E.PEMAPESq.EMSERMSE
490.12570.03350.00280.3030.02530.1589
500.35870.23450.019510.42710.86890.9322
510.84850.63370.052845.03553.7531.9373
522.10491.42380.118696.23568.01962.8319
538.5085.06740.4223167.582513.96523.737
54-12.5751-7.27090.6059314.70226.22525.1211
55-5.1817-2.71180.226471.038239.25326.2652
56-3.8284-1.99520.1663799.109566.59258.1604
57-3.2978-1.82560.15211463.3441121.945311.0429
58-3.0384-1.63850.13652157.3528179.779413.4082
59-2.9013-1.49810.12482963.769246.980715.7156
60-2.8282-1.39380.11623924.1044327.008718.0834


Parameters (Session):
par1 = 12 ; par2 = 1 ; par3 = 2 ; par4 = 1 ; par5 = 1 ; par6 = 3 ; par7 = 0 ; par8 = 0 ; par9 = 0 ; par10 = FALSE ;
Parameters (R input):
par1 = 12 ; par2 = 1 ; par3 = 2 ; par4 = 1 ; par5 = 1 ; par6 = 3 ; par7 = 0 ; par8 = 0 ; par9 = 0 ; par10 = FALSE ;
R code (references can be found in the software module):
par1 <- as.numeric(par1) #cut off periods
par2 <- as.numeric(par2) #lambda
par3 <- as.numeric(par3) #degree of non-seasonal differencing
par4 <- as.numeric(par4) #degree of seasonal differencing
par5 <- as.numeric(par5) #seasonal period
par6 <- as.numeric(par6) #p
par7 <- as.numeric(par7) #q
par8 <- as.numeric(par8) #P
par9 <- as.numeric(par9) #Q
if (par10 == 'TRUE') par10 <- TRUE
if (par10 == 'FALSE') par10 <- FALSE
if (par2 == 0) x <- log(x)
if (par2 != 0) x <- x^par2
lx <- length(x)
first <- lx - 2*par1
nx <- lx - par1
nx1 <- nx + 1
fx <- lx - nx
if (fx < 1) {
fx <- par5
nx1 <- lx + fx - 1
first <- lx - 2*fx
}
first <- 1
if (fx < 3) fx <- round(lx/10,0)
(arima.out <- arima(x[1:nx], order=c(par6,par3,par7), seasonal=list(order=c(par8,par4,par9), period=par5), include.mean=par10, method='ML'))
(forecast <- predict(arima.out,fx))
(lb <- forecast$pred - 1.96 * forecast$se)
(ub <- forecast$pred + 1.96 * forecast$se)
if (par2 == 0) {
x <- exp(x)
forecast$pred <- exp(forecast$pred)
lb <- exp(lb)
ub <- exp(ub)
}
if (par2 != 0) {
x <- x^(1/par2)
forecast$pred <- forecast$pred^(1/par2)
lb <- lb^(1/par2)
ub <- ub^(1/par2)
}
if (par2 < 0) {
olb <- lb
lb <- ub
ub <- olb
}
(actandfor <- c(x[1:nx], forecast$pred))
(perc.se <- (ub-forecast$pred)/1.96/forecast$pred)
bitmap(file='test1.png')
opar <- par(mar=c(4,4,2,2),las=1)
ylim <- c( min(x[first:nx],lb), max(x[first:nx],ub))
plot(x,ylim=ylim,type='n',xlim=c(first,lx))
usr <- par('usr')
rect(usr[1],usr[3],nx+1,usr[4],border=NA,col='lemonchiffon')
rect(nx1,usr[3],usr[2],usr[4],border=NA,col='lavender')
abline(h= (-3:3)*2 , col ='gray', lty =3)
polygon( c(nx1:lx,lx:nx1), c(lb,rev(ub)), col = 'orange', lty=2,border=NA)
lines(nx1:lx, lb , lty=2)
lines(nx1:lx, ub , lty=2)
lines(x, lwd=2)
lines(nx1:lx, forecast$pred , lwd=2 , col ='white')
box()
par(opar)
dev.off()
prob.dec <- array(NA, dim=fx)
prob.sdec <- array(NA, dim=fx)
prob.ldec <- array(NA, dim=fx)
prob.pval <- array(NA, dim=fx)
perf.pe <- array(0, dim=fx)
perf.mape <- array(0, dim=fx)
perf.se <- array(0, dim=fx)
perf.mse <- array(0, dim=fx)
perf.rmse <- array(0, dim=fx)
for (i in 1:fx) {
locSD <- (ub[i] - forecast$pred[i]) / 1.96
perf.pe[i] = (x[nx+i] - forecast$pred[i]) / forecast$pred[i]
perf.mape[i] = perf.mape[i] + abs(perf.pe[i])
perf.se[i] = (x[nx+i] - forecast$pred[i])^2
perf.mse[i] = perf.mse[i] + perf.se[i]
prob.dec[i] = pnorm((x[nx+i-1] - forecast$pred[i]) / locSD)
prob.sdec[i] = pnorm((x[nx+i-par5] - forecast$pred[i]) / locSD)
prob.ldec[i] = pnorm((x[nx] - forecast$pred[i]) / locSD)
prob.pval[i] = pnorm(abs(x[nx+i] - forecast$pred[i]) / locSD)
}
perf.mape = perf.mape / fx
perf.mse = perf.mse / fx
perf.rmse = sqrt(perf.mse)
bitmap(file='test2.png')
plot(forecast$pred, pch=19, type='b',main='ARIMA Extrapolation Forecast', ylab='Forecast and 95% CI', xlab='time',ylim=c(min(lb),max(ub)))
dum <- forecast$pred
dum[1:12] <- x[(nx+1):lx]
lines(dum, lty=1)
lines(ub,lty=3)
lines(lb,lty=3)
dev.off()
load(file='createtable')
a<-table.start()
a<-table.row.start(a)
a<-table.element(a,'Univariate ARIMA Extrapolation Forecast',9,TRUE)
a<-table.row.end(a)
a<-table.row.start(a)
a<-table.element(a,'time',1,header=TRUE)
a<-table.element(a,'Y[t]',1,header=TRUE)
a<-table.element(a,'F[t]',1,header=TRUE)
a<-table.element(a,'95% LB',1,header=TRUE)
a<-table.element(a,'95% UB',1,header=TRUE)
a<-table.element(a,'p-value
(H0: Y[t] = F[t])',1,header=TRUE)
a<-table.element(a,'P(F[t]>Y[t-1])',1,header=TRUE)
a<-table.element(a,'P(F[t]>Y[t-s])',1,header=TRUE)
mylab <- paste('P(F[t]>Y[',nx,sep='')
mylab <- paste(mylab,'])',sep='')
a<-table.element(a,mylab,1,header=TRUE)
a<-table.row.end(a)
for (i in (nx-par5):nx) {
a<-table.row.start(a)
a<-table.element(a,i,header=TRUE)
a<-table.element(a,x[i])
a<-table.element(a,'-')
a<-table.row.end(a)
}
for (i in 1:fx) {
a<-table.row.start(a)
a<-table.element(a,nx+i,header=TRUE)
a<-table.element(a,round(x[nx+i],4))
a<-table.element(a,round(forecast$pred[i],4))
a<-table.element(a,round(lb[i],4))
a<-table.element(a,round(ub[i],4))
a<-table.element(a,round((1-prob.pval[i]),4))
a<-table.element(a,round((1-prob.dec[i]),4))
a<-table.element(a,round((1-prob.sdec[i]),4))
a<-table.element(a,round((1-prob.ldec[i]),4))
a<-table.row.end(a)
}
a<-table.end(a)
table.save(a,file='mytable.tab')
a<-table.start()
a<-table.row.start(a)
a<-table.element(a,'Univariate ARIMA Extrapolation Forecast Performance',7,TRUE)
a<-table.row.end(a)
a<-table.row.start(a)
a<-table.element(a,'time',1,header=TRUE)
a<-table.element(a,'% S.E.',1,header=TRUE)
a<-table.element(a,'PE',1,header=TRUE)
a<-table.element(a,'MAPE',1,header=TRUE)
a<-table.element(a,'Sq.E',1,header=TRUE)
a<-table.element(a,'MSE',1,header=TRUE)
a<-table.element(a,'RMSE',1,header=TRUE)
a<-table.row.end(a)
for (i in 1:fx) {
a<-table.row.start(a)
a<-table.element(a,nx+i,header=TRUE)
a<-table.element(a,round(perc.se[i],4))
a<-table.element(a,round(perf.pe[i],4))
a<-table.element(a,round(perf.mape[i],4))
a<-table.element(a,round(perf.se[i],4))
a<-table.element(a,round(perf.mse[i],4))
a<-table.element(a,round(perf.rmse[i],4))
a<-table.row.end(a)
}
a<-table.end(a)
table.save(a,file='mytable1.tab')