Free Statistics

of Irreproducible Research!

Author's title

Author*The author of this computation has been verified*
R Software Modulerwasp_autocorrelation.wasp
Title produced by software(Partial) Autocorrelation Function
Date of computationTue, 16 Dec 2008 11:57:09 -0700
Cite this page as followsStatistical Computations at FreeStatistics.org, Office for Research Development and Education, URL https://freestatistics.org/blog/index.php?v=date/2008/Dec/16/t1229453949is4kzzh3nj23yny.htm/, Retrieved Wed, 15 May 2024 13:18:03 +0000
Statistical Computations at FreeStatistics.org, Office for Research Development and Education, URL https://freestatistics.org/blog/index.php?pk=34114, Retrieved Wed, 15 May 2024 13:18:03 +0000
QR Codes:

Original text written by user:
IsPrivate?No (this computation is public)
User-defined keywords
Estimated Impact198
Family? (F = Feedback message, R = changed R code, M = changed R Module, P = changed Parameters, D = changed Data)
-     [(Partial) Autocorrelation Function] [Partial Autocorre...] [2008-12-15 09:36:27] [81e1690fdaa0a4031eafff37d4d5a366]
-   P     [(Partial) Autocorrelation Function] [Partial Correlation] [2008-12-16 18:57:09] [21a82be02162ee9c644b6689eefbb825] [Current]
Feedback Forum

Post a new message
Dataseries X:
97.7
101.5
119.6
108.1
117.8
125.5
89.2
92.3
104.6
122.8
96
94.6
93.3
101.1
114.2
104.7
113.3
118.2
83.6
73.9
99.5
97.7
103
106.3
92.2
101.8
122.8
111.8
106.3
121.5
81.9
85.4
110.9
117.3
106.3
105.5
101.3
105.9
126.3
111.9
108.9
127.2
94.2
85.7
116.2
107.2
110.6
112
104.5
112
132.8
110.8
128.7
136.8
94.9
88.8
123.2
125.3
122.7
125.7
116.3
118.7
142
127.9
131.9
152.3
110.8
99.1
135
133.2
131
133.9
119.9
136.9
148.9
145.1
142.4
159.6
120.7
109
142


Summary of computational transaction
Raw Inputview raw input (R code)
Raw Outputview raw output of R engine
Computing time0 seconds
R Server'Gwilym Jenkins' @ 72.249.127.135

\begin{tabular}{lllllllll}
\hline
Summary of computational transaction \tabularnewline
Raw Input & view raw input (R code)  \tabularnewline
Raw Output & view raw output of R engine  \tabularnewline
Computing time & 0 seconds \tabularnewline
R Server & 'Gwilym Jenkins' @ 72.249.127.135 \tabularnewline
\hline
\end{tabular}
%Source: https://freestatistics.org/blog/index.php?pk=34114&T=0

[TABLE]
[ROW][C]Summary of computational transaction[/C][/ROW]
[ROW][C]Raw Input[/C][C]view raw input (R code) [/C][/ROW]
[ROW][C]Raw Output[/C][C]view raw output of R engine [/C][/ROW]
[ROW][C]Computing time[/C][C]0 seconds[/C][/ROW]
[ROW][C]R Server[/C][C]'Gwilym Jenkins' @ 72.249.127.135[/C][/ROW]
[/TABLE]
Source: https://freestatistics.org/blog/index.php?pk=34114&T=0

Globally Unique Identifier (entire table): ba.freestatistics.org/blog/index.php?pk=34114&T=0

As an alternative you can also use a QR Code:  

The GUIDs for individual cells are displayed in the table below:

Summary of computational transaction
Raw Inputview raw input (R code)
Raw Outputview raw output of R engine
Computing time0 seconds
R Server'Gwilym Jenkins' @ 72.249.127.135


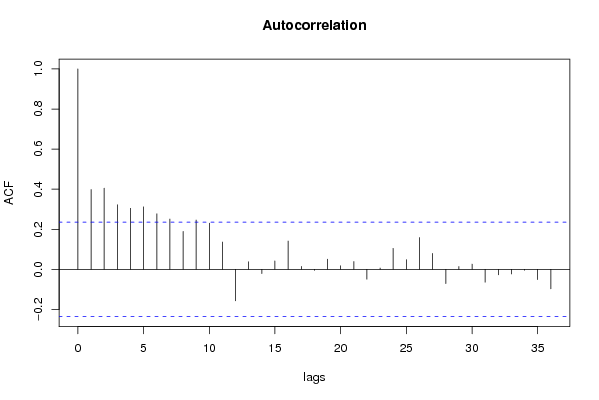
Autocorrelation Function
Time lag kACF(k)T-STATP-value
10.398393.30930.000745
20.4049263.36360.000629
30.321922.67410.004674
40.3048622.53240.006804
50.3118032.590.005849
60.2769522.30050.012223
70.2510992.08580.020349
80.1894231.57350.060093
90.2458052.04180.022498
100.2302961.9130.02995
110.1364561.13350.130466
12-0.156771-1.30220.098582
130.0374960.31150.378193
14-0.020741-0.17230.431857
150.0419840.34870.364171
160.1413551.17420.12218
170.0146310.12150.451812
18-0.004513-0.03750.485102
190.050690.42110.33751
200.0178550.14830.441265
210.0391080.32490.373137
22-0.049165-0.40840.342126
230.0064450.05350.47873
240.1047270.86990.193679
250.0483640.40170.344557
260.1584571.31620.096224
270.0796090.66130.255317
28-0.070794-0.58810.279207
290.013790.11450.454569
300.0261690.21740.414279
31-0.064076-0.53230.29813
32-0.027028-0.22450.41151
33-0.022733-0.18880.425387
34-0.004362-0.03620.485601
35-0.050915-0.42290.33683
36-0.09716-0.80710.2112

\begin{tabular}{lllllllll}
\hline
Autocorrelation Function \tabularnewline
Time lag k & ACF(k) & T-STAT & P-value \tabularnewline
1 & 0.39839 & 3.3093 & 0.000745 \tabularnewline
2 & 0.404926 & 3.3636 & 0.000629 \tabularnewline
3 & 0.32192 & 2.6741 & 0.004674 \tabularnewline
4 & 0.304862 & 2.5324 & 0.006804 \tabularnewline
5 & 0.311803 & 2.59 & 0.005849 \tabularnewline
6 & 0.276952 & 2.3005 & 0.012223 \tabularnewline
7 & 0.251099 & 2.0858 & 0.020349 \tabularnewline
8 & 0.189423 & 1.5735 & 0.060093 \tabularnewline
9 & 0.245805 & 2.0418 & 0.022498 \tabularnewline
10 & 0.230296 & 1.913 & 0.02995 \tabularnewline
11 & 0.136456 & 1.1335 & 0.130466 \tabularnewline
12 & -0.156771 & -1.3022 & 0.098582 \tabularnewline
13 & 0.037496 & 0.3115 & 0.378193 \tabularnewline
14 & -0.020741 & -0.1723 & 0.431857 \tabularnewline
15 & 0.041984 & 0.3487 & 0.364171 \tabularnewline
16 & 0.141355 & 1.1742 & 0.12218 \tabularnewline
17 & 0.014631 & 0.1215 & 0.451812 \tabularnewline
18 & -0.004513 & -0.0375 & 0.485102 \tabularnewline
19 & 0.05069 & 0.4211 & 0.33751 \tabularnewline
20 & 0.017855 & 0.1483 & 0.441265 \tabularnewline
21 & 0.039108 & 0.3249 & 0.373137 \tabularnewline
22 & -0.049165 & -0.4084 & 0.342126 \tabularnewline
23 & 0.006445 & 0.0535 & 0.47873 \tabularnewline
24 & 0.104727 & 0.8699 & 0.193679 \tabularnewline
25 & 0.048364 & 0.4017 & 0.344557 \tabularnewline
26 & 0.158457 & 1.3162 & 0.096224 \tabularnewline
27 & 0.079609 & 0.6613 & 0.255317 \tabularnewline
28 & -0.070794 & -0.5881 & 0.279207 \tabularnewline
29 & 0.01379 & 0.1145 & 0.454569 \tabularnewline
30 & 0.026169 & 0.2174 & 0.414279 \tabularnewline
31 & -0.064076 & -0.5323 & 0.29813 \tabularnewline
32 & -0.027028 & -0.2245 & 0.41151 \tabularnewline
33 & -0.022733 & -0.1888 & 0.425387 \tabularnewline
34 & -0.004362 & -0.0362 & 0.485601 \tabularnewline
35 & -0.050915 & -0.4229 & 0.33683 \tabularnewline
36 & -0.09716 & -0.8071 & 0.2112 \tabularnewline
\hline
\end{tabular}
%Source: https://freestatistics.org/blog/index.php?pk=34114&T=1

[TABLE]
[ROW][C]Autocorrelation Function[/C][/ROW]
[ROW][C]Time lag k[/C][C]ACF(k)[/C][C]T-STAT[/C][C]P-value[/C][/ROW]
[ROW][C]1[/C][C]0.39839[/C][C]3.3093[/C][C]0.000745[/C][/ROW]
[ROW][C]2[/C][C]0.404926[/C][C]3.3636[/C][C]0.000629[/C][/ROW]
[ROW][C]3[/C][C]0.32192[/C][C]2.6741[/C][C]0.004674[/C][/ROW]
[ROW][C]4[/C][C]0.304862[/C][C]2.5324[/C][C]0.006804[/C][/ROW]
[ROW][C]5[/C][C]0.311803[/C][C]2.59[/C][C]0.005849[/C][/ROW]
[ROW][C]6[/C][C]0.276952[/C][C]2.3005[/C][C]0.012223[/C][/ROW]
[ROW][C]7[/C][C]0.251099[/C][C]2.0858[/C][C]0.020349[/C][/ROW]
[ROW][C]8[/C][C]0.189423[/C][C]1.5735[/C][C]0.060093[/C][/ROW]
[ROW][C]9[/C][C]0.245805[/C][C]2.0418[/C][C]0.022498[/C][/ROW]
[ROW][C]10[/C][C]0.230296[/C][C]1.913[/C][C]0.02995[/C][/ROW]
[ROW][C]11[/C][C]0.136456[/C][C]1.1335[/C][C]0.130466[/C][/ROW]
[ROW][C]12[/C][C]-0.156771[/C][C]-1.3022[/C][C]0.098582[/C][/ROW]
[ROW][C]13[/C][C]0.037496[/C][C]0.3115[/C][C]0.378193[/C][/ROW]
[ROW][C]14[/C][C]-0.020741[/C][C]-0.1723[/C][C]0.431857[/C][/ROW]
[ROW][C]15[/C][C]0.041984[/C][C]0.3487[/C][C]0.364171[/C][/ROW]
[ROW][C]16[/C][C]0.141355[/C][C]1.1742[/C][C]0.12218[/C][/ROW]
[ROW][C]17[/C][C]0.014631[/C][C]0.1215[/C][C]0.451812[/C][/ROW]
[ROW][C]18[/C][C]-0.004513[/C][C]-0.0375[/C][C]0.485102[/C][/ROW]
[ROW][C]19[/C][C]0.05069[/C][C]0.4211[/C][C]0.33751[/C][/ROW]
[ROW][C]20[/C][C]0.017855[/C][C]0.1483[/C][C]0.441265[/C][/ROW]
[ROW][C]21[/C][C]0.039108[/C][C]0.3249[/C][C]0.373137[/C][/ROW]
[ROW][C]22[/C][C]-0.049165[/C][C]-0.4084[/C][C]0.342126[/C][/ROW]
[ROW][C]23[/C][C]0.006445[/C][C]0.0535[/C][C]0.47873[/C][/ROW]
[ROW][C]24[/C][C]0.104727[/C][C]0.8699[/C][C]0.193679[/C][/ROW]
[ROW][C]25[/C][C]0.048364[/C][C]0.4017[/C][C]0.344557[/C][/ROW]
[ROW][C]26[/C][C]0.158457[/C][C]1.3162[/C][C]0.096224[/C][/ROW]
[ROW][C]27[/C][C]0.079609[/C][C]0.6613[/C][C]0.255317[/C][/ROW]
[ROW][C]28[/C][C]-0.070794[/C][C]-0.5881[/C][C]0.279207[/C][/ROW]
[ROW][C]29[/C][C]0.01379[/C][C]0.1145[/C][C]0.454569[/C][/ROW]
[ROW][C]30[/C][C]0.026169[/C][C]0.2174[/C][C]0.414279[/C][/ROW]
[ROW][C]31[/C][C]-0.064076[/C][C]-0.5323[/C][C]0.29813[/C][/ROW]
[ROW][C]32[/C][C]-0.027028[/C][C]-0.2245[/C][C]0.41151[/C][/ROW]
[ROW][C]33[/C][C]-0.022733[/C][C]-0.1888[/C][C]0.425387[/C][/ROW]
[ROW][C]34[/C][C]-0.004362[/C][C]-0.0362[/C][C]0.485601[/C][/ROW]
[ROW][C]35[/C][C]-0.050915[/C][C]-0.4229[/C][C]0.33683[/C][/ROW]
[ROW][C]36[/C][C]-0.09716[/C][C]-0.8071[/C][C]0.2112[/C][/ROW]
[/TABLE]
Source: https://freestatistics.org/blog/index.php?pk=34114&T=1

Globally Unique Identifier (entire table): ba.freestatistics.org/blog/index.php?pk=34114&T=1

As an alternative you can also use a QR Code:  

The GUIDs for individual cells are displayed in the table below:

Autocorrelation Function
Time lag kACF(k)T-STATP-value
10.398393.30930.000745
20.4049263.36360.000629
30.321922.67410.004674
40.3048622.53240.006804
50.3118032.590.005849
60.2769522.30050.012223
70.2510992.08580.020349
80.1894231.57350.060093
90.2458052.04180.022498
100.2302961.9130.02995
110.1364561.13350.130466
12-0.156771-1.30220.098582
130.0374960.31150.378193
14-0.020741-0.17230.431857
150.0419840.34870.364171
160.1413551.17420.12218
170.0146310.12150.451812
18-0.004513-0.03750.485102
190.050690.42110.33751
200.0178550.14830.441265
210.0391080.32490.373137
22-0.049165-0.40840.342126
230.0064450.05350.47873
240.1047270.86990.193679
250.0483640.40170.344557
260.1584571.31620.096224
270.0796090.66130.255317
28-0.070794-0.58810.279207
290.013790.11450.454569
300.0261690.21740.414279
31-0.064076-0.53230.29813
32-0.027028-0.22450.41151
33-0.022733-0.18880.425387
34-0.004362-0.03620.485601
35-0.050915-0.42290.33683
36-0.09716-0.80710.2112


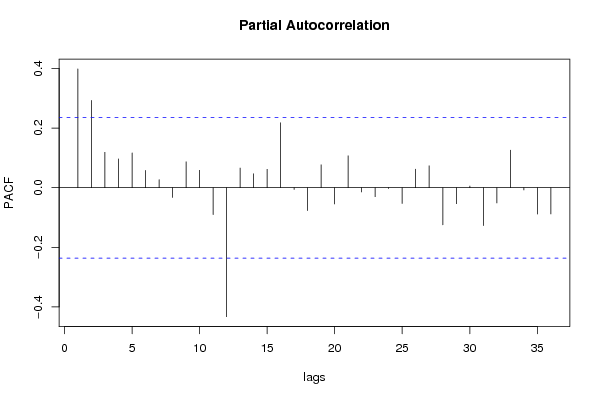
Partial Autocorrelation Function
Time lag kPACF(k)T-STATP-value
10.398393.30930.000745
20.2926612.4310.008829
30.1185870.98510.164019
40.0963860.80060.213044
50.1168180.97040.167627
60.0577810.480.316386
70.0271070.22520.411257
8-0.032458-0.26960.394129
90.0869750.72250.236225
100.05840.48510.314569
11-0.090096-0.74840.228383
12-0.43256-3.59310.000304
130.0659820.54810.292702
140.0464190.38560.350496
150.0616830.51240.305012
160.2175841.80740.03753
17-0.005967-0.04960.480305
18-0.076523-0.63560.263554
190.0766750.63690.263146
20-0.054585-0.45340.325836
210.1070960.88960.188383
22-0.014253-0.11840.45305
23-0.030075-0.24980.401733
24-0.002918-0.02420.490367
25-0.052927-0.43960.330783
260.0619970.5150.304104
270.0734620.61020.27186
28-0.124371-1.03310.152581
29-0.053399-0.44360.329371
300.0055170.04580.481791
31-0.127106-1.05580.147367
32-0.051087-0.42440.336313
330.1257821.04480.149876
34-0.007691-0.06390.474624
35-0.088367-0.7340.232708
36-0.088117-0.7320.233337

\begin{tabular}{lllllllll}
\hline
Partial Autocorrelation Function \tabularnewline
Time lag k & PACF(k) & T-STAT & P-value \tabularnewline
1 & 0.39839 & 3.3093 & 0.000745 \tabularnewline
2 & 0.292661 & 2.431 & 0.008829 \tabularnewline
3 & 0.118587 & 0.9851 & 0.164019 \tabularnewline
4 & 0.096386 & 0.8006 & 0.213044 \tabularnewline
5 & 0.116818 & 0.9704 & 0.167627 \tabularnewline
6 & 0.057781 & 0.48 & 0.316386 \tabularnewline
7 & 0.027107 & 0.2252 & 0.411257 \tabularnewline
8 & -0.032458 & -0.2696 & 0.394129 \tabularnewline
9 & 0.086975 & 0.7225 & 0.236225 \tabularnewline
10 & 0.0584 & 0.4851 & 0.314569 \tabularnewline
11 & -0.090096 & -0.7484 & 0.228383 \tabularnewline
12 & -0.43256 & -3.5931 & 0.000304 \tabularnewline
13 & 0.065982 & 0.5481 & 0.292702 \tabularnewline
14 & 0.046419 & 0.3856 & 0.350496 \tabularnewline
15 & 0.061683 & 0.5124 & 0.305012 \tabularnewline
16 & 0.217584 & 1.8074 & 0.03753 \tabularnewline
17 & -0.005967 & -0.0496 & 0.480305 \tabularnewline
18 & -0.076523 & -0.6356 & 0.263554 \tabularnewline
19 & 0.076675 & 0.6369 & 0.263146 \tabularnewline
20 & -0.054585 & -0.4534 & 0.325836 \tabularnewline
21 & 0.107096 & 0.8896 & 0.188383 \tabularnewline
22 & -0.014253 & -0.1184 & 0.45305 \tabularnewline
23 & -0.030075 & -0.2498 & 0.401733 \tabularnewline
24 & -0.002918 & -0.0242 & 0.490367 \tabularnewline
25 & -0.052927 & -0.4396 & 0.330783 \tabularnewline
26 & 0.061997 & 0.515 & 0.304104 \tabularnewline
27 & 0.073462 & 0.6102 & 0.27186 \tabularnewline
28 & -0.124371 & -1.0331 & 0.152581 \tabularnewline
29 & -0.053399 & -0.4436 & 0.329371 \tabularnewline
30 & 0.005517 & 0.0458 & 0.481791 \tabularnewline
31 & -0.127106 & -1.0558 & 0.147367 \tabularnewline
32 & -0.051087 & -0.4244 & 0.336313 \tabularnewline
33 & 0.125782 & 1.0448 & 0.149876 \tabularnewline
34 & -0.007691 & -0.0639 & 0.474624 \tabularnewline
35 & -0.088367 & -0.734 & 0.232708 \tabularnewline
36 & -0.088117 & -0.732 & 0.233337 \tabularnewline
\hline
\end{tabular}
%Source: https://freestatistics.org/blog/index.php?pk=34114&T=2

[TABLE]
[ROW][C]Partial Autocorrelation Function[/C][/ROW]
[ROW][C]Time lag k[/C][C]PACF(k)[/C][C]T-STAT[/C][C]P-value[/C][/ROW]
[ROW][C]1[/C][C]0.39839[/C][C]3.3093[/C][C]0.000745[/C][/ROW]
[ROW][C]2[/C][C]0.292661[/C][C]2.431[/C][C]0.008829[/C][/ROW]
[ROW][C]3[/C][C]0.118587[/C][C]0.9851[/C][C]0.164019[/C][/ROW]
[ROW][C]4[/C][C]0.096386[/C][C]0.8006[/C][C]0.213044[/C][/ROW]
[ROW][C]5[/C][C]0.116818[/C][C]0.9704[/C][C]0.167627[/C][/ROW]
[ROW][C]6[/C][C]0.057781[/C][C]0.48[/C][C]0.316386[/C][/ROW]
[ROW][C]7[/C][C]0.027107[/C][C]0.2252[/C][C]0.411257[/C][/ROW]
[ROW][C]8[/C][C]-0.032458[/C][C]-0.2696[/C][C]0.394129[/C][/ROW]
[ROW][C]9[/C][C]0.086975[/C][C]0.7225[/C][C]0.236225[/C][/ROW]
[ROW][C]10[/C][C]0.0584[/C][C]0.4851[/C][C]0.314569[/C][/ROW]
[ROW][C]11[/C][C]-0.090096[/C][C]-0.7484[/C][C]0.228383[/C][/ROW]
[ROW][C]12[/C][C]-0.43256[/C][C]-3.5931[/C][C]0.000304[/C][/ROW]
[ROW][C]13[/C][C]0.065982[/C][C]0.5481[/C][C]0.292702[/C][/ROW]
[ROW][C]14[/C][C]0.046419[/C][C]0.3856[/C][C]0.350496[/C][/ROW]
[ROW][C]15[/C][C]0.061683[/C][C]0.5124[/C][C]0.305012[/C][/ROW]
[ROW][C]16[/C][C]0.217584[/C][C]1.8074[/C][C]0.03753[/C][/ROW]
[ROW][C]17[/C][C]-0.005967[/C][C]-0.0496[/C][C]0.480305[/C][/ROW]
[ROW][C]18[/C][C]-0.076523[/C][C]-0.6356[/C][C]0.263554[/C][/ROW]
[ROW][C]19[/C][C]0.076675[/C][C]0.6369[/C][C]0.263146[/C][/ROW]
[ROW][C]20[/C][C]-0.054585[/C][C]-0.4534[/C][C]0.325836[/C][/ROW]
[ROW][C]21[/C][C]0.107096[/C][C]0.8896[/C][C]0.188383[/C][/ROW]
[ROW][C]22[/C][C]-0.014253[/C][C]-0.1184[/C][C]0.45305[/C][/ROW]
[ROW][C]23[/C][C]-0.030075[/C][C]-0.2498[/C][C]0.401733[/C][/ROW]
[ROW][C]24[/C][C]-0.002918[/C][C]-0.0242[/C][C]0.490367[/C][/ROW]
[ROW][C]25[/C][C]-0.052927[/C][C]-0.4396[/C][C]0.330783[/C][/ROW]
[ROW][C]26[/C][C]0.061997[/C][C]0.515[/C][C]0.304104[/C][/ROW]
[ROW][C]27[/C][C]0.073462[/C][C]0.6102[/C][C]0.27186[/C][/ROW]
[ROW][C]28[/C][C]-0.124371[/C][C]-1.0331[/C][C]0.152581[/C][/ROW]
[ROW][C]29[/C][C]-0.053399[/C][C]-0.4436[/C][C]0.329371[/C][/ROW]
[ROW][C]30[/C][C]0.005517[/C][C]0.0458[/C][C]0.481791[/C][/ROW]
[ROW][C]31[/C][C]-0.127106[/C][C]-1.0558[/C][C]0.147367[/C][/ROW]
[ROW][C]32[/C][C]-0.051087[/C][C]-0.4244[/C][C]0.336313[/C][/ROW]
[ROW][C]33[/C][C]0.125782[/C][C]1.0448[/C][C]0.149876[/C][/ROW]
[ROW][C]34[/C][C]-0.007691[/C][C]-0.0639[/C][C]0.474624[/C][/ROW]
[ROW][C]35[/C][C]-0.088367[/C][C]-0.734[/C][C]0.232708[/C][/ROW]
[ROW][C]36[/C][C]-0.088117[/C][C]-0.732[/C][C]0.233337[/C][/ROW]
[/TABLE]
Source: https://freestatistics.org/blog/index.php?pk=34114&T=2

Globally Unique Identifier (entire table): ba.freestatistics.org/blog/index.php?pk=34114&T=2

As an alternative you can also use a QR Code:  

The GUIDs for individual cells are displayed in the table below:

Partial Autocorrelation Function
Time lag kPACF(k)T-STATP-value
10.398393.30930.000745
20.2926612.4310.008829
30.1185870.98510.164019
40.0963860.80060.213044
50.1168180.97040.167627
60.0577810.480.316386
70.0271070.22520.411257
8-0.032458-0.26960.394129
90.0869750.72250.236225
100.05840.48510.314569
11-0.090096-0.74840.228383
12-0.43256-3.59310.000304
130.0659820.54810.292702
140.0464190.38560.350496
150.0616830.51240.305012
160.2175841.80740.03753
17-0.005967-0.04960.480305
18-0.076523-0.63560.263554
190.0766750.63690.263146
20-0.054585-0.45340.325836
210.1070960.88960.188383
22-0.014253-0.11840.45305
23-0.030075-0.24980.401733
24-0.002918-0.02420.490367
25-0.052927-0.43960.330783
260.0619970.5150.304104
270.0734620.61020.27186
28-0.124371-1.03310.152581
29-0.053399-0.44360.329371
300.0055170.04580.481791
31-0.127106-1.05580.147367
32-0.051087-0.42440.336313
330.1257821.04480.149876
34-0.007691-0.06390.474624
35-0.088367-0.7340.232708
36-0.088117-0.7320.233337


Parameters (Session):
par1 = 36 ; par2 = 1 ; par3 = 0 ; par4 = 1 ; par5 = 12 ;
Parameters (R input):
par1 = 36 ; par2 = 1 ; par3 = 0 ; par4 = 1 ; par5 = 12 ;
R code (references can be found in the software module):
if (par1 == 'Default') {
par1 = 10*log10(length(x))
} else {
par1 <- as.numeric(par1)
}
par2 <- as.numeric(par2)
par3 <- as.numeric(par3)
par4 <- as.numeric(par4)
par5 <- as.numeric(par5)
if (par2 == 0) {
x <- log(x)
} else {
x <- (x ^ par2 - 1) / par2
}
if (par3 > 0) x <- diff(x,lag=1,difference=par3)
if (par4 > 0) x <- diff(x,lag=par5,difference=par4)
bitmap(file='pic1.png')
racf <- acf(x,par1,main='Autocorrelation',xlab='lags',ylab='ACF')
dev.off()
bitmap(file='pic2.png')
rpacf <- pacf(x,par1,main='Partial Autocorrelation',xlab='lags',ylab='PACF')
dev.off()
(myacf <- c(racf$acf))
(mypacf <- c(rpacf$acf))
lengthx <- length(x)
sqrtn <- sqrt(lengthx)
load(file='createtable')
a<-table.start()
a<-table.row.start(a)
a<-table.element(a,'Autocorrelation Function',4,TRUE)
a<-table.row.end(a)
a<-table.row.start(a)
a<-table.element(a,'Time lag k',header=TRUE)
a<-table.element(a,hyperlink('basics.htm','ACF(k)','click here for more information about the Autocorrelation Function'),header=TRUE)
a<-table.element(a,'T-STAT',header=TRUE)
a<-table.element(a,'P-value',header=TRUE)
a<-table.row.end(a)
for (i in 2:(par1+1)) {
a<-table.row.start(a)
a<-table.element(a,i-1,header=TRUE)
a<-table.element(a,round(myacf[i],6))
mytstat <- myacf[i]*sqrtn
a<-table.element(a,round(mytstat,4))
a<-table.element(a,round(1-pt(abs(mytstat),lengthx),6))
a<-table.row.end(a)
}
a<-table.end(a)
table.save(a,file='mytable.tab')
a<-table.start()
a<-table.row.start(a)
a<-table.element(a,'Partial Autocorrelation Function',4,TRUE)
a<-table.row.end(a)
a<-table.row.start(a)
a<-table.element(a,'Time lag k',header=TRUE)
a<-table.element(a,hyperlink('basics.htm','PACF(k)','click here for more information about the Partial Autocorrelation Function'),header=TRUE)
a<-table.element(a,'T-STAT',header=TRUE)
a<-table.element(a,'P-value',header=TRUE)
a<-table.row.end(a)
for (i in 1:par1) {
a<-table.row.start(a)
a<-table.element(a,i,header=TRUE)
a<-table.element(a,round(mypacf[i],6))
mytstat <- mypacf[i]*sqrtn
a<-table.element(a,round(mytstat,4))
a<-table.element(a,round(1-pt(abs(mytstat),lengthx),6))
a<-table.row.end(a)
}
a<-table.end(a)
table.save(a,file='mytable1.tab')