Free Statistics

of Irreproducible Research!

Author's title

Author*Unverified author*
R Software Modulerwasp_arimaforecasting.wasp
Title produced by softwareARIMA Forecasting
Date of computationTue, 16 Dec 2008 11:51:55 -0700
Cite this page as followsStatistical Computations at FreeStatistics.org, Office for Research Development and Education, URL https://freestatistics.org/blog/index.php?v=date/2008/Dec/16/t1229453620aov3pk91z4y7acq.htm/, Retrieved Wed, 15 May 2024 17:02:46 +0000
Statistical Computations at FreeStatistics.org, Office for Research Development and Education, URL https://freestatistics.org/blog/index.php?pk=34109, Retrieved Wed, 15 May 2024 17:02:46 +0000
QR Codes:

Original text written by user:
IsPrivate?No (this computation is public)
User-defined keywordsK_Vanderheggen
Estimated Impact196
Family? (F = Feedback message, R = changed R code, M = changed R Module, P = changed Parameters, D = changed Data)
-     [Mean Plot] [paper werklooshei...] [2008-11-28 16:41:24] [1640119c345fbfa2091dc1243f79f7a6]
- RMPD  [Spectral Analysis] [paper spectral an...] [2008-12-12 17:39:08] [1640119c345fbfa2091dc1243f79f7a6]
F RMP       [ARIMA Forecasting] [Paper ARIMA Forec...] [2008-12-16 18:51:55] [9a6b6d9f802c100119d25349a6856aad] [Current]
Feedback Forum
2008-12-21 19:06:48 [Kelly Deckx] [reply
Je had de interpretatie van de tabellen wel mogen uitleggen:
In de eerste tabel kan je zien welke laatste 12 metingen zijn weggelaten, nl. van meting 81 tot 92. rij Y(t) stelt de werkelijke waarde voor, en F(t) de voorspelde waarde. De 2 volgende tabellen stellen de 95% ondergrens en bovengrens van het betrouwbaarheidsinterval voor. P-value geeft aan dat F(t) en Y(t) niet significant mogen verschillen van 0. kleine waardes willen zeggen dat ze significant verschillend zijn. Dit is hier niet het geval. Meting 91 is de best voorspelde meting.
De 7de tabel geeft aan wat de waarschijnlijkheid is dat F(t) groter is dan de vorige gekende waarde; wat is de waarschijnlijkheid dat er een stijging is tegenover 1 periode vroeger.
De 8ste tabel: wat is de kans dat de waarde stijgt dezelfde maand als vorig jaar.
Met andere waarden kunnen we een stijgende trend voorspellen? In dit geval is het antwoord neen.
In de laatste tabel: met de laatste gekende waarde de kans aflezen wat de waarschijnlijkheid is dat er in de toekomst de waarde ervan zal stijgen.


STEP 2
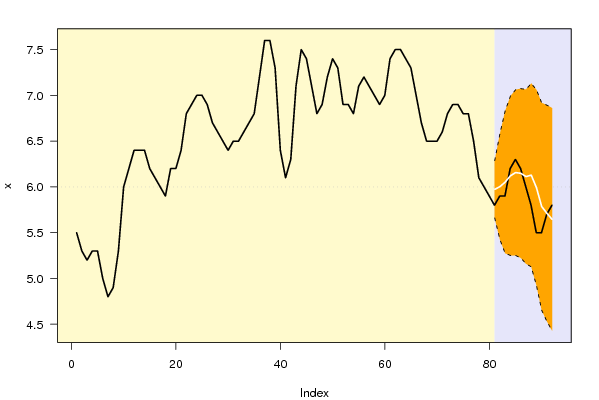
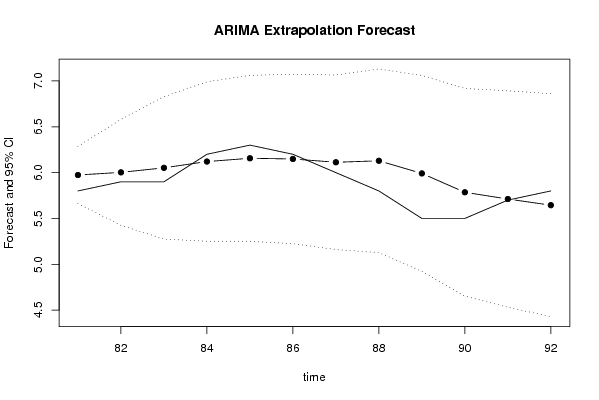
de voorspelling volgt inderdaad de conjuctuur goed en de seizoenaliteit

STEP 3
Deze vraag kan je oplossen met de 2de tabel.
In de 2de tabel wilt het % S.D. zeggen: een schatting van de gemaakte fout. Hoe verder de voorspelling hier wordt gemaakt hoe groter de fout.

STEP 4

De PE kolom geeft de kans weer dat er een stijging plaats vindt of niet. We zien hier niet echt een merkbaar patroon in.

STEP 5

Het model presteert vrij goed. De voorspelde waarden liggen zeer dicht bij de werkelijke waarden. Dit is een goed model.

2008-12-22 09:42:43 [Nicolaj Wuyts] [reply
Step 1:
De forecast vertoond inderdaad geen opvallend verloop.

Step2:
Bij de Interpolation forecast zien we dat er een dalend verloop is op lange termijn. Bij de exterpolation forecast, waarbij er ingezoomd wordt op de forecast, zien we dat deze trend wegvalt.

Step 3:
De standaardfout of SE% evolueert van 2% naar 11%. Dit wil zeggen dat we er voor 11% van onze voorspelde waarden naast zitten. We kunnen dus stellen dat 89 op 100 voorspellingen correct zullen zijn, wat toch nog betrekelijk accuraat is.

Step 4:
In de PE tabel zien we de waarschijnlijkheid dat de forecast zal dalen of stijgen. We kunnen echter geen patroon zien in deze waarden.

Step 5:
We zien dat de voorspelde waarden altijd rond de werkelijke waarden draaien. Soms zijn ze wat hoger, daarna weer wat lager. De p-value is ook altijd groter dan 0,05%. Dit wil zeggen dat het verschil tussen de voorspelde en werkelijke waarde niet significant is. We kunnen dus besluiten dat dit een goed model is.

Post a new message
Dataseries X:
5.5
5.3
5.2
5.3
5.3
5
4.8
4.9
5.3
6
6.2
6.4
6.4
6.4
6.2
6.1
6
5.9
6.2
6.2
6.4
6.8
6.9
7
7
6.9
6.7
6.6
6.5
6.4
6.5
6.5
6.6
6.7
6.8
7.2
7.6
7.6
7.3
6.4
6.1
6.3
7.1
7.5
7.4
7.1
6.8
6.9
7.2
7.4
7.3
6.9
6.9
6.8
7.1
7.2
7.1
7
6.9
7
7.4
7.5
7.5
7.4
7.3
7
6.7
6.5
6.5
6.5
6.6
6.8
6.9
6.9
6.8
6.8
6.5
6.1
6
5.9
5.8
5.9
5.9
6.2
6.3
6.2
6
5.8
5.5
5.5
5.7
5.8


Summary of computational transaction
Raw Inputview raw input (R code)
Raw Outputview raw output of R engine
Computing time1 seconds
R Server'Gwilym Jenkins' @ 72.249.127.135

\begin{tabular}{lllllllll}
\hline
Summary of computational transaction \tabularnewline
Raw Input & view raw input (R code)  \tabularnewline
Raw Output & view raw output of R engine  \tabularnewline
Computing time & 1 seconds \tabularnewline
R Server & 'Gwilym Jenkins' @ 72.249.127.135 \tabularnewline
\hline
\end{tabular}
%Source: https://freestatistics.org/blog/index.php?pk=34109&T=0

[TABLE]
[ROW][C]Summary of computational transaction[/C][/ROW]
[ROW][C]Raw Input[/C][C]view raw input (R code) [/C][/ROW]
[ROW][C]Raw Output[/C][C]view raw output of R engine [/C][/ROW]
[ROW][C]Computing time[/C][C]1 seconds[/C][/ROW]
[ROW][C]R Server[/C][C]'Gwilym Jenkins' @ 72.249.127.135[/C][/ROW]
[/TABLE]
Source: https://freestatistics.org/blog/index.php?pk=34109&T=0

Globally Unique Identifier (entire table): ba.freestatistics.org/blog/index.php?pk=34109&T=0

As an alternative you can also use a QR Code:  

The GUIDs for individual cells are displayed in the table below:

Summary of computational transaction
Raw Inputview raw input (R code)
Raw Outputview raw output of R engine
Computing time1 seconds
R Server'Gwilym Jenkins' @ 72.249.127.135


Univariate ARIMA Extrapolation Forecast
timeY[t]F[t]95% LB95% UBp-value(H0: Y[t] = F[t])P(F[t]>Y[t-1])P(F[t]>Y[t-s])P(F[t]>Y[80])
686.5-------
696.5-------
706.5-------
716.6-------
726.8-------
736.9-------
746.9-------
756.8-------
766.8-------
776.5-------
786.1-------
796-------
805.9-------
815.85.97375.66126.28620.13790.67815e-040.6781
825.96.00285.42466.5810.36370.75410.0460.6363
835.96.05215.27536.82880.35060.64940.08340.6494
846.26.12065.25126.990.42890.69050.06280.6905
856.36.15655.25157.06150.3780.46250.05370.7107
866.26.14875.22427.07320.45670.37420.05560.701
8766.11285.16057.0650.40820.42880.07860.6693
885.86.12895.12697.1310.260.59950.09470.6728
895.55.99124.92217.06020.18390.6370.17540.5664
905.55.78534.65246.91810.31080.68920.2930.4213
915.75.71174.53056.89280.49230.63730.31620.3773
925.85.64474.42856.86090.40120.46450.34040.3404

\begin{tabular}{lllllllll}
\hline
Univariate ARIMA Extrapolation Forecast \tabularnewline
time & Y[t] & F[t] & 95% LB & 95% UB & p-value(H0: Y[t] = F[t]) & P(F[t]>Y[t-1]) & P(F[t]>Y[t-s]) & P(F[t]>Y[80]) \tabularnewline
68 & 6.5 & - & - & - & - & - & - & - \tabularnewline
69 & 6.5 & - & - & - & - & - & - & - \tabularnewline
70 & 6.5 & - & - & - & - & - & - & - \tabularnewline
71 & 6.6 & - & - & - & - & - & - & - \tabularnewline
72 & 6.8 & - & - & - & - & - & - & - \tabularnewline
73 & 6.9 & - & - & - & - & - & - & - \tabularnewline
74 & 6.9 & - & - & - & - & - & - & - \tabularnewline
75 & 6.8 & - & - & - & - & - & - & - \tabularnewline
76 & 6.8 & - & - & - & - & - & - & - \tabularnewline
77 & 6.5 & - & - & - & - & - & - & - \tabularnewline
78 & 6.1 & - & - & - & - & - & - & - \tabularnewline
79 & 6 & - & - & - & - & - & - & - \tabularnewline
80 & 5.9 & - & - & - & - & - & - & - \tabularnewline
81 & 5.8 & 5.9737 & 5.6612 & 6.2862 & 0.1379 & 0.6781 & 5e-04 & 0.6781 \tabularnewline
82 & 5.9 & 6.0028 & 5.4246 & 6.581 & 0.3637 & 0.7541 & 0.046 & 0.6363 \tabularnewline
83 & 5.9 & 6.0521 & 5.2753 & 6.8288 & 0.3506 & 0.6494 & 0.0834 & 0.6494 \tabularnewline
84 & 6.2 & 6.1206 & 5.2512 & 6.99 & 0.4289 & 0.6905 & 0.0628 & 0.6905 \tabularnewline
85 & 6.3 & 6.1565 & 5.2515 & 7.0615 & 0.378 & 0.4625 & 0.0537 & 0.7107 \tabularnewline
86 & 6.2 & 6.1487 & 5.2242 & 7.0732 & 0.4567 & 0.3742 & 0.0556 & 0.701 \tabularnewline
87 & 6 & 6.1128 & 5.1605 & 7.065 & 0.4082 & 0.4288 & 0.0786 & 0.6693 \tabularnewline
88 & 5.8 & 6.1289 & 5.1269 & 7.131 & 0.26 & 0.5995 & 0.0947 & 0.6728 \tabularnewline
89 & 5.5 & 5.9912 & 4.9221 & 7.0602 & 0.1839 & 0.637 & 0.1754 & 0.5664 \tabularnewline
90 & 5.5 & 5.7853 & 4.6524 & 6.9181 & 0.3108 & 0.6892 & 0.293 & 0.4213 \tabularnewline
91 & 5.7 & 5.7117 & 4.5305 & 6.8928 & 0.4923 & 0.6373 & 0.3162 & 0.3773 \tabularnewline
92 & 5.8 & 5.6447 & 4.4285 & 6.8609 & 0.4012 & 0.4645 & 0.3404 & 0.3404 \tabularnewline
\hline
\end{tabular}
%Source: https://freestatistics.org/blog/index.php?pk=34109&T=1

[TABLE]
[ROW][C]Univariate ARIMA Extrapolation Forecast[/C][/ROW]
[ROW][C]time[/C][C]Y[t][/C][C]F[t][/C][C]95% LB[/C][C]95% UB[/C][C]p-value(H0: Y[t] = F[t])[/C][C]P(F[t]>Y[t-1])[/C][C]P(F[t]>Y[t-s])[/C][C]P(F[t]>Y[80])[/C][/ROW]
[ROW][C]68[/C][C]6.5[/C][C]-[/C][C]-[/C][C]-[/C][C]-[/C][C]-[/C][C]-[/C][C]-[/C][/ROW]
[ROW][C]69[/C][C]6.5[/C][C]-[/C][C]-[/C][C]-[/C][C]-[/C][C]-[/C][C]-[/C][C]-[/C][/ROW]
[ROW][C]70[/C][C]6.5[/C][C]-[/C][C]-[/C][C]-[/C][C]-[/C][C]-[/C][C]-[/C][C]-[/C][/ROW]
[ROW][C]71[/C][C]6.6[/C][C]-[/C][C]-[/C][C]-[/C][C]-[/C][C]-[/C][C]-[/C][C]-[/C][/ROW]
[ROW][C]72[/C][C]6.8[/C][C]-[/C][C]-[/C][C]-[/C][C]-[/C][C]-[/C][C]-[/C][C]-[/C][/ROW]
[ROW][C]73[/C][C]6.9[/C][C]-[/C][C]-[/C][C]-[/C][C]-[/C][C]-[/C][C]-[/C][C]-[/C][/ROW]
[ROW][C]74[/C][C]6.9[/C][C]-[/C][C]-[/C][C]-[/C][C]-[/C][C]-[/C][C]-[/C][C]-[/C][/ROW]
[ROW][C]75[/C][C]6.8[/C][C]-[/C][C]-[/C][C]-[/C][C]-[/C][C]-[/C][C]-[/C][C]-[/C][/ROW]
[ROW][C]76[/C][C]6.8[/C][C]-[/C][C]-[/C][C]-[/C][C]-[/C][C]-[/C][C]-[/C][C]-[/C][/ROW]
[ROW][C]77[/C][C]6.5[/C][C]-[/C][C]-[/C][C]-[/C][C]-[/C][C]-[/C][C]-[/C][C]-[/C][/ROW]
[ROW][C]78[/C][C]6.1[/C][C]-[/C][C]-[/C][C]-[/C][C]-[/C][C]-[/C][C]-[/C][C]-[/C][/ROW]
[ROW][C]79[/C][C]6[/C][C]-[/C][C]-[/C][C]-[/C][C]-[/C][C]-[/C][C]-[/C][C]-[/C][/ROW]
[ROW][C]80[/C][C]5.9[/C][C]-[/C][C]-[/C][C]-[/C][C]-[/C][C]-[/C][C]-[/C][C]-[/C][/ROW]
[ROW][C]81[/C][C]5.8[/C][C]5.9737[/C][C]5.6612[/C][C]6.2862[/C][C]0.1379[/C][C]0.6781[/C][C]5e-04[/C][C]0.6781[/C][/ROW]
[ROW][C]82[/C][C]5.9[/C][C]6.0028[/C][C]5.4246[/C][C]6.581[/C][C]0.3637[/C][C]0.7541[/C][C]0.046[/C][C]0.6363[/C][/ROW]
[ROW][C]83[/C][C]5.9[/C][C]6.0521[/C][C]5.2753[/C][C]6.8288[/C][C]0.3506[/C][C]0.6494[/C][C]0.0834[/C][C]0.6494[/C][/ROW]
[ROW][C]84[/C][C]6.2[/C][C]6.1206[/C][C]5.2512[/C][C]6.99[/C][C]0.4289[/C][C]0.6905[/C][C]0.0628[/C][C]0.6905[/C][/ROW]
[ROW][C]85[/C][C]6.3[/C][C]6.1565[/C][C]5.2515[/C][C]7.0615[/C][C]0.378[/C][C]0.4625[/C][C]0.0537[/C][C]0.7107[/C][/ROW]
[ROW][C]86[/C][C]6.2[/C][C]6.1487[/C][C]5.2242[/C][C]7.0732[/C][C]0.4567[/C][C]0.3742[/C][C]0.0556[/C][C]0.701[/C][/ROW]
[ROW][C]87[/C][C]6[/C][C]6.1128[/C][C]5.1605[/C][C]7.065[/C][C]0.4082[/C][C]0.4288[/C][C]0.0786[/C][C]0.6693[/C][/ROW]
[ROW][C]88[/C][C]5.8[/C][C]6.1289[/C][C]5.1269[/C][C]7.131[/C][C]0.26[/C][C]0.5995[/C][C]0.0947[/C][C]0.6728[/C][/ROW]
[ROW][C]89[/C][C]5.5[/C][C]5.9912[/C][C]4.9221[/C][C]7.0602[/C][C]0.1839[/C][C]0.637[/C][C]0.1754[/C][C]0.5664[/C][/ROW]
[ROW][C]90[/C][C]5.5[/C][C]5.7853[/C][C]4.6524[/C][C]6.9181[/C][C]0.3108[/C][C]0.6892[/C][C]0.293[/C][C]0.4213[/C][/ROW]
[ROW][C]91[/C][C]5.7[/C][C]5.7117[/C][C]4.5305[/C][C]6.8928[/C][C]0.4923[/C][C]0.6373[/C][C]0.3162[/C][C]0.3773[/C][/ROW]
[ROW][C]92[/C][C]5.8[/C][C]5.6447[/C][C]4.4285[/C][C]6.8609[/C][C]0.4012[/C][C]0.4645[/C][C]0.3404[/C][C]0.3404[/C][/ROW]
[/TABLE]
Source: https://freestatistics.org/blog/index.php?pk=34109&T=1

Globally Unique Identifier (entire table): ba.freestatistics.org/blog/index.php?pk=34109&T=1

As an alternative you can also use a QR Code:  

The GUIDs for individual cells are displayed in the table below:

Univariate ARIMA Extrapolation Forecast
timeY[t]F[t]95% LB95% UBp-value(H0: Y[t] = F[t])P(F[t]>Y[t-1])P(F[t]>Y[t-s])P(F[t]>Y[80])
686.5-------
696.5-------
706.5-------
716.6-------
726.8-------
736.9-------
746.9-------
756.8-------
766.8-------
776.5-------
786.1-------
796-------
805.9-------
815.85.97375.66126.28620.13790.67815e-040.6781
825.96.00285.42466.5810.36370.75410.0460.6363
835.96.05215.27536.82880.35060.64940.08340.6494
846.26.12065.25126.990.42890.69050.06280.6905
856.36.15655.25157.06150.3780.46250.05370.7107
866.26.14875.22427.07320.45670.37420.05560.701
8766.11285.16057.0650.40820.42880.07860.6693
885.86.12895.12697.1310.260.59950.09470.6728
895.55.99124.92217.06020.18390.6370.17540.5664
905.55.78534.65246.91810.31080.68920.2930.4213
915.75.71174.53056.89280.49230.63730.31620.3773
925.85.64474.42856.86090.40120.46450.34040.3404


Univariate ARIMA Extrapolation Forecast Performance
time% S.E.PEMAPESq.EMSERMSE
810.0267-0.02910.00240.03020.00250.0502
820.0491-0.01710.00140.01069e-040.0297
830.0655-0.02510.00210.02310.00190.0439
840.07250.0130.00110.00635e-040.0229
850.0750.02330.00190.02060.00170.0414
860.07670.00837e-040.00262e-040.0148
870.0795-0.01850.00150.01270.00110.0326
880.0834-0.05370.00450.10820.0090.0949
890.091-0.0820.00680.24120.02010.1418
900.0999-0.04930.00410.08140.00680.0824
910.1055-0.0022e-041e-0400.0034
920.10990.02750.00230.02410.0020.0448

\begin{tabular}{lllllllll}
\hline
Univariate ARIMA Extrapolation Forecast Performance \tabularnewline
time & % S.E. & PE & MAPE & Sq.E & MSE & RMSE \tabularnewline
81 & 0.0267 & -0.0291 & 0.0024 & 0.0302 & 0.0025 & 0.0502 \tabularnewline
82 & 0.0491 & -0.0171 & 0.0014 & 0.0106 & 9e-04 & 0.0297 \tabularnewline
83 & 0.0655 & -0.0251 & 0.0021 & 0.0231 & 0.0019 & 0.0439 \tabularnewline
84 & 0.0725 & 0.013 & 0.0011 & 0.0063 & 5e-04 & 0.0229 \tabularnewline
85 & 0.075 & 0.0233 & 0.0019 & 0.0206 & 0.0017 & 0.0414 \tabularnewline
86 & 0.0767 & 0.0083 & 7e-04 & 0.0026 & 2e-04 & 0.0148 \tabularnewline
87 & 0.0795 & -0.0185 & 0.0015 & 0.0127 & 0.0011 & 0.0326 \tabularnewline
88 & 0.0834 & -0.0537 & 0.0045 & 0.1082 & 0.009 & 0.0949 \tabularnewline
89 & 0.091 & -0.082 & 0.0068 & 0.2412 & 0.0201 & 0.1418 \tabularnewline
90 & 0.0999 & -0.0493 & 0.0041 & 0.0814 & 0.0068 & 0.0824 \tabularnewline
91 & 0.1055 & -0.002 & 2e-04 & 1e-04 & 0 & 0.0034 \tabularnewline
92 & 0.1099 & 0.0275 & 0.0023 & 0.0241 & 0.002 & 0.0448 \tabularnewline
\hline
\end{tabular}
%Source: https://freestatistics.org/blog/index.php?pk=34109&T=2

[TABLE]
[ROW][C]Univariate ARIMA Extrapolation Forecast Performance[/C][/ROW]
[ROW][C]time[/C][C]% S.E.[/C][C]PE[/C][C]MAPE[/C][C]Sq.E[/C][C]MSE[/C][C]RMSE[/C][/ROW]
[ROW][C]81[/C][C]0.0267[/C][C]-0.0291[/C][C]0.0024[/C][C]0.0302[/C][C]0.0025[/C][C]0.0502[/C][/ROW]
[ROW][C]82[/C][C]0.0491[/C][C]-0.0171[/C][C]0.0014[/C][C]0.0106[/C][C]9e-04[/C][C]0.0297[/C][/ROW]
[ROW][C]83[/C][C]0.0655[/C][C]-0.0251[/C][C]0.0021[/C][C]0.0231[/C][C]0.0019[/C][C]0.0439[/C][/ROW]
[ROW][C]84[/C][C]0.0725[/C][C]0.013[/C][C]0.0011[/C][C]0.0063[/C][C]5e-04[/C][C]0.0229[/C][/ROW]
[ROW][C]85[/C][C]0.075[/C][C]0.0233[/C][C]0.0019[/C][C]0.0206[/C][C]0.0017[/C][C]0.0414[/C][/ROW]
[ROW][C]86[/C][C]0.0767[/C][C]0.0083[/C][C]7e-04[/C][C]0.0026[/C][C]2e-04[/C][C]0.0148[/C][/ROW]
[ROW][C]87[/C][C]0.0795[/C][C]-0.0185[/C][C]0.0015[/C][C]0.0127[/C][C]0.0011[/C][C]0.0326[/C][/ROW]
[ROW][C]88[/C][C]0.0834[/C][C]-0.0537[/C][C]0.0045[/C][C]0.1082[/C][C]0.009[/C][C]0.0949[/C][/ROW]
[ROW][C]89[/C][C]0.091[/C][C]-0.082[/C][C]0.0068[/C][C]0.2412[/C][C]0.0201[/C][C]0.1418[/C][/ROW]
[ROW][C]90[/C][C]0.0999[/C][C]-0.0493[/C][C]0.0041[/C][C]0.0814[/C][C]0.0068[/C][C]0.0824[/C][/ROW]
[ROW][C]91[/C][C]0.1055[/C][C]-0.002[/C][C]2e-04[/C][C]1e-04[/C][C]0[/C][C]0.0034[/C][/ROW]
[ROW][C]92[/C][C]0.1099[/C][C]0.0275[/C][C]0.0023[/C][C]0.0241[/C][C]0.002[/C][C]0.0448[/C][/ROW]
[/TABLE]
Source: https://freestatistics.org/blog/index.php?pk=34109&T=2

Globally Unique Identifier (entire table): ba.freestatistics.org/blog/index.php?pk=34109&T=2

As an alternative you can also use a QR Code:  

The GUIDs for individual cells are displayed in the table below:

Univariate ARIMA Extrapolation Forecast Performance
time% S.E.PEMAPESq.EMSERMSE
810.0267-0.02910.00240.03020.00250.0502
820.0491-0.01710.00140.01069e-040.0297
830.0655-0.02510.00210.02310.00190.0439
840.07250.0130.00110.00635e-040.0229
850.0750.02330.00190.02060.00170.0414
860.07670.00837e-040.00262e-040.0148
870.0795-0.01850.00150.01270.00110.0326
880.0834-0.05370.00450.10820.0090.0949
890.091-0.0820.00680.24120.02010.1418
900.0999-0.04930.00410.08140.00680.0824
910.1055-0.0022e-041e-0400.0034
920.10990.02750.00230.02410.0020.0448


Parameters (Session):
par1 = 12 ; par2 = 1 ; par3 = 1 ; par4 = 0 ; par5 = 12 ; par6 = 3 ; par7 = 0 ; par8 = 2 ; par9 = 1 ; par10 = FALSE ;
Parameters (R input):
par1 = 12 ; par2 = 1 ; par3 = 1 ; par4 = 0 ; par5 = 12 ; par6 = 3 ; par7 = 0 ; par8 = 2 ; par9 = 1 ; par10 = FALSE ;
R code (references can be found in the software module):
par1 <- as.numeric(par1) #cut off periods
par2 <- as.numeric(par2) #lambda
par3 <- as.numeric(par3) #degree of non-seasonal differencing
par4 <- as.numeric(par4) #degree of seasonal differencing
par5 <- as.numeric(par5) #seasonal period
par6 <- as.numeric(par6) #p
par7 <- as.numeric(par7) #q
par8 <- as.numeric(par8) #P
par9 <- as.numeric(par9) #Q
if (par10 == 'TRUE') par10 <- TRUE
if (par10 == 'FALSE') par10 <- FALSE
if (par2 == 0) x <- log(x)
if (par2 != 0) x <- x^par2
lx <- length(x)
first <- lx - 2*par1
nx <- lx - par1
nx1 <- nx + 1
fx <- lx - nx
if (fx < 1) {
fx <- par5
nx1 <- lx + fx - 1
first <- lx - 2*fx
}
first <- 1
if (fx < 3) fx <- round(lx/10,0)
(arima.out <- arima(x[1:nx], order=c(par6,par3,par7), seasonal=list(order=c(par8,par4,par9), period=par5), include.mean=par10, method='ML'))
(forecast <- predict(arima.out,fx))
(lb <- forecast$pred - 1.96 * forecast$se)
(ub <- forecast$pred + 1.96 * forecast$se)
if (par2 == 0) {
x <- exp(x)
forecast$pred <- exp(forecast$pred)
lb <- exp(lb)
ub <- exp(ub)
}
if (par2 != 0) {
x <- x^(1/par2)
forecast$pred <- forecast$pred^(1/par2)
lb <- lb^(1/par2)
ub <- ub^(1/par2)
}
if (par2 < 0) {
olb <- lb
lb <- ub
ub <- olb
}
(actandfor <- c(x[1:nx], forecast$pred))
(perc.se <- (ub-forecast$pred)/1.96/forecast$pred)
bitmap(file='test1.png')
opar <- par(mar=c(4,4,2,2),las=1)
ylim <- c( min(x[first:nx],lb), max(x[first:nx],ub))
plot(x,ylim=ylim,type='n',xlim=c(first,lx))
usr <- par('usr')
rect(usr[1],usr[3],nx+1,usr[4],border=NA,col='lemonchiffon')
rect(nx1,usr[3],usr[2],usr[4],border=NA,col='lavender')
abline(h= (-3:3)*2 , col ='gray', lty =3)
polygon( c(nx1:lx,lx:nx1), c(lb,rev(ub)), col = 'orange', lty=2,border=NA)
lines(nx1:lx, lb , lty=2)
lines(nx1:lx, ub , lty=2)
lines(x, lwd=2)
lines(nx1:lx, forecast$pred , lwd=2 , col ='white')
box()
par(opar)
dev.off()
prob.dec <- array(NA, dim=fx)
prob.sdec <- array(NA, dim=fx)
prob.ldec <- array(NA, dim=fx)
prob.pval <- array(NA, dim=fx)
perf.pe <- array(0, dim=fx)
perf.mape <- array(0, dim=fx)
perf.se <- array(0, dim=fx)
perf.mse <- array(0, dim=fx)
perf.rmse <- array(0, dim=fx)
for (i in 1:fx) {
locSD <- (ub[i] - forecast$pred[i]) / 1.96
perf.pe[i] = (x[nx+i] - forecast$pred[i]) / forecast$pred[i]
perf.mape[i] = perf.mape[i] + abs(perf.pe[i])
perf.se[i] = (x[nx+i] - forecast$pred[i])^2
perf.mse[i] = perf.mse[i] + perf.se[i]
prob.dec[i] = pnorm((x[nx+i-1] - forecast$pred[i]) / locSD)
prob.sdec[i] = pnorm((x[nx+i-par5] - forecast$pred[i]) / locSD)
prob.ldec[i] = pnorm((x[nx] - forecast$pred[i]) / locSD)
prob.pval[i] = pnorm(abs(x[nx+i] - forecast$pred[i]) / locSD)
}
perf.mape = perf.mape / fx
perf.mse = perf.mse / fx
perf.rmse = sqrt(perf.mse)
bitmap(file='test2.png')
plot(forecast$pred, pch=19, type='b',main='ARIMA Extrapolation Forecast', ylab='Forecast and 95% CI', xlab='time',ylim=c(min(lb),max(ub)))
dum <- forecast$pred
dum[1:12] <- x[(nx+1):lx]
lines(dum, lty=1)
lines(ub,lty=3)
lines(lb,lty=3)
dev.off()
load(file='createtable')
a<-table.start()
a<-table.row.start(a)
a<-table.element(a,'Univariate ARIMA Extrapolation Forecast',9,TRUE)
a<-table.row.end(a)
a<-table.row.start(a)
a<-table.element(a,'time',1,header=TRUE)
a<-table.element(a,'Y[t]',1,header=TRUE)
a<-table.element(a,'F[t]',1,header=TRUE)
a<-table.element(a,'95% LB',1,header=TRUE)
a<-table.element(a,'95% UB',1,header=TRUE)
a<-table.element(a,'p-value
(H0: Y[t] = F[t])',1,header=TRUE)
a<-table.element(a,'P(F[t]>Y[t-1])',1,header=TRUE)
a<-table.element(a,'P(F[t]>Y[t-s])',1,header=TRUE)
mylab <- paste('P(F[t]>Y[',nx,sep='')
mylab <- paste(mylab,'])',sep='')
a<-table.element(a,mylab,1,header=TRUE)
a<-table.row.end(a)
for (i in (nx-par5):nx) {
a<-table.row.start(a)
a<-table.element(a,i,header=TRUE)
a<-table.element(a,x[i])
a<-table.element(a,'-')
a<-table.row.end(a)
}
for (i in 1:fx) {
a<-table.row.start(a)
a<-table.element(a,nx+i,header=TRUE)
a<-table.element(a,round(x[nx+i],4))
a<-table.element(a,round(forecast$pred[i],4))
a<-table.element(a,round(lb[i],4))
a<-table.element(a,round(ub[i],4))
a<-table.element(a,round((1-prob.pval[i]),4))
a<-table.element(a,round((1-prob.dec[i]),4))
a<-table.element(a,round((1-prob.sdec[i]),4))
a<-table.element(a,round((1-prob.ldec[i]),4))
a<-table.row.end(a)
}
a<-table.end(a)
table.save(a,file='mytable.tab')
a<-table.start()
a<-table.row.start(a)
a<-table.element(a,'Univariate ARIMA Extrapolation Forecast Performance',7,TRUE)
a<-table.row.end(a)
a<-table.row.start(a)
a<-table.element(a,'time',1,header=TRUE)
a<-table.element(a,'% S.E.',1,header=TRUE)
a<-table.element(a,'PE',1,header=TRUE)
a<-table.element(a,'MAPE',1,header=TRUE)
a<-table.element(a,'Sq.E',1,header=TRUE)
a<-table.element(a,'MSE',1,header=TRUE)
a<-table.element(a,'RMSE',1,header=TRUE)
a<-table.row.end(a)
for (i in 1:fx) {
a<-table.row.start(a)
a<-table.element(a,nx+i,header=TRUE)
a<-table.element(a,round(perc.se[i],4))
a<-table.element(a,round(perf.pe[i],4))
a<-table.element(a,round(perf.mape[i],4))
a<-table.element(a,round(perf.se[i],4))
a<-table.element(a,round(perf.mse[i],4))
a<-table.element(a,round(perf.rmse[i],4))
a<-table.row.end(a)
}
a<-table.end(a)
table.save(a,file='mytable1.tab')