Free Statistics

of Irreproducible Research!

Author's title

Author*Unverified author*
R Software Modulerwasp_autocorrelation.wasp
Title produced by software(Partial) Autocorrelation Function
Date of computationTue, 16 Dec 2008 11:49:34 -0700
Cite this page as followsStatistical Computations at FreeStatistics.org, Office for Research Development and Education, URL https://freestatistics.org/blog/index.php?v=date/2008/Dec/16/t12294535919tzw5i9x2jtb4cv.htm/, Retrieved Wed, 15 May 2024 21:25:25 +0000
Statistical Computations at FreeStatistics.org, Office for Research Development and Education, URL https://freestatistics.org/blog/index.php?pk=34106, Retrieved Wed, 15 May 2024 21:25:25 +0000
QR Codes:

Original text written by user:
IsPrivate?No (this computation is public)
User-defined keywords
Estimated Impact132
Family? (F = Feedback message, R = changed R code, M = changed R Module, P = changed Parameters, D = changed Data)
-       [(Partial) Autocorrelation Function] [Paper (P)ACF werk...] [2008-12-16 18:49:34] [d41d8cd98f00b204e9800998ecf8427e] [Current]
Feedback Forum

Post a new message
Dataseries X:
95.2
95
94
92.2
91
91.2
103.4
105
104.6
103.8
101.8
102.4
103.8
103.4
102
101.8
100.2
101.4
113.8
116
115.6
113
109.4
111
112.4
112.2
111
108.8
107.4
108.6
118.8
122.2
122.6
122.2
118.8
119
118.2
117.8
116.8
114.6
113.4
113.8
124.2
125.8
125.6
122.4
119
119.4
118.6
118
116
114.8
114.6
114.6
124
125.2
124
117.6
113.2
111.4
112.2
109.8
106.4
105.2
102.2
99.8
111
113
108.4
105.4
102
102.8


Summary of computational transaction
Raw Inputview raw input (R code)
Raw Outputview raw output of R engine
Computing time2 seconds
R Server'Sir Ronald Aylmer Fisher' @ 193.190.124.24

\begin{tabular}{lllllllll}
\hline
Summary of computational transaction \tabularnewline
Raw Input & view raw input (R code)  \tabularnewline
Raw Output & view raw output of R engine  \tabularnewline
Computing time & 2 seconds \tabularnewline
R Server & 'Sir Ronald Aylmer Fisher' @ 193.190.124.24 \tabularnewline
\hline
\end{tabular}
%Source: https://freestatistics.org/blog/index.php?pk=34106&T=0

[TABLE]
[ROW][C]Summary of computational transaction[/C][/ROW]
[ROW][C]Raw Input[/C][C]view raw input (R code) [/C][/ROW]
[ROW][C]Raw Output[/C][C]view raw output of R engine [/C][/ROW]
[ROW][C]Computing time[/C][C]2 seconds[/C][/ROW]
[ROW][C]R Server[/C][C]'Sir Ronald Aylmer Fisher' @ 193.190.124.24[/C][/ROW]
[/TABLE]
Source: https://freestatistics.org/blog/index.php?pk=34106&T=0

Globally Unique Identifier (entire table): ba.freestatistics.org/blog/index.php?pk=34106&T=0

As an alternative you can also use a QR Code:  

The GUIDs for individual cells are displayed in the table below:

Summary of computational transaction
Raw Inputview raw input (R code)
Raw Outputview raw output of R engine
Computing time2 seconds
R Server'Sir Ronald Aylmer Fisher' @ 193.190.124.24


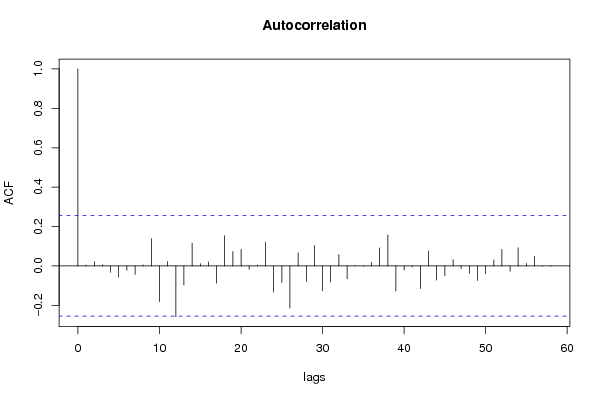
Autocorrelation Function
Time lag kACF(k)T-STATP-value
10.0043910.03370.486603
20.0220890.16970.432925
30.0060560.04650.481529
4-0.032179-0.24720.402816
5-0.056531-0.43420.332855
6-0.022048-0.16940.433048
7-0.042612-0.32730.372296
80.0053480.04110.483684
90.1381561.06120.146462
10-0.18081-1.38880.085053
110.0223510.17170.432139
12-0.257354-1.97680.026373
13-0.097089-0.74580.229389
140.1158470.88980.188583
150.0109390.0840.466661
160.0202780.15580.438378
17-0.087321-0.67070.252505
180.1537581.1810.121163
190.0728740.55980.288883
200.0835780.6420.261687
21-0.01736-0.13330.447189
220.0051260.03940.484364
230.1212620.93140.177712
24-0.13259-1.01840.156312
25-0.08443-0.64850.259583
26-0.213391-1.63910.053259
270.0664810.51070.305749
28-0.078534-0.60320.274333
290.1044420.80220.212819
30-0.126135-0.96890.168285
31-0.081025-0.62240.268049
320.0571070.43860.331259
33-0.064821-0.49790.310203
340.0027360.0210.491652
35-0.001351-0.01040.495878
360.0188430.14470.442705
370.0908220.69760.244077
380.1567911.20430.116634
39-0.127519-0.97950.165668
40-0.020409-0.15680.437983
41-0.005899-0.04530.482005
42-0.115047-0.88370.190224
430.075670.58120.281649
44-0.071734-0.5510.291859
45-0.048214-0.37030.356228
460.0315750.24250.404605
47-0.012768-0.09810.461105
48-0.036628-0.28130.389715
49-0.07448-0.57210.284716
50-0.039849-0.30610.380309
510.0305990.2350.407497
520.0839530.64490.26076
53-0.026274-0.20180.420377
540.0928160.71290.239349
550.0121720.09350.462915
560.0477570.36680.357529
57-0.001647-0.01270.494974
580.002230.01710.493195
59NANANA
60NANANA

\begin{tabular}{lllllllll}
\hline
Autocorrelation Function \tabularnewline
Time lag k & ACF(k) & T-STAT & P-value \tabularnewline
1 & 0.004391 & 0.0337 & 0.486603 \tabularnewline
2 & 0.022089 & 0.1697 & 0.432925 \tabularnewline
3 & 0.006056 & 0.0465 & 0.481529 \tabularnewline
4 & -0.032179 & -0.2472 & 0.402816 \tabularnewline
5 & -0.056531 & -0.4342 & 0.332855 \tabularnewline
6 & -0.022048 & -0.1694 & 0.433048 \tabularnewline
7 & -0.042612 & -0.3273 & 0.372296 \tabularnewline
8 & 0.005348 & 0.0411 & 0.483684 \tabularnewline
9 & 0.138156 & 1.0612 & 0.146462 \tabularnewline
10 & -0.18081 & -1.3888 & 0.085053 \tabularnewline
11 & 0.022351 & 0.1717 & 0.432139 \tabularnewline
12 & -0.257354 & -1.9768 & 0.026373 \tabularnewline
13 & -0.097089 & -0.7458 & 0.229389 \tabularnewline
14 & 0.115847 & 0.8898 & 0.188583 \tabularnewline
15 & 0.010939 & 0.084 & 0.466661 \tabularnewline
16 & 0.020278 & 0.1558 & 0.438378 \tabularnewline
17 & -0.087321 & -0.6707 & 0.252505 \tabularnewline
18 & 0.153758 & 1.181 & 0.121163 \tabularnewline
19 & 0.072874 & 0.5598 & 0.288883 \tabularnewline
20 & 0.083578 & 0.642 & 0.261687 \tabularnewline
21 & -0.01736 & -0.1333 & 0.447189 \tabularnewline
22 & 0.005126 & 0.0394 & 0.484364 \tabularnewline
23 & 0.121262 & 0.9314 & 0.177712 \tabularnewline
24 & -0.13259 & -1.0184 & 0.156312 \tabularnewline
25 & -0.08443 & -0.6485 & 0.259583 \tabularnewline
26 & -0.213391 & -1.6391 & 0.053259 \tabularnewline
27 & 0.066481 & 0.5107 & 0.305749 \tabularnewline
28 & -0.078534 & -0.6032 & 0.274333 \tabularnewline
29 & 0.104442 & 0.8022 & 0.212819 \tabularnewline
30 & -0.126135 & -0.9689 & 0.168285 \tabularnewline
31 & -0.081025 & -0.6224 & 0.268049 \tabularnewline
32 & 0.057107 & 0.4386 & 0.331259 \tabularnewline
33 & -0.064821 & -0.4979 & 0.310203 \tabularnewline
34 & 0.002736 & 0.021 & 0.491652 \tabularnewline
35 & -0.001351 & -0.0104 & 0.495878 \tabularnewline
36 & 0.018843 & 0.1447 & 0.442705 \tabularnewline
37 & 0.090822 & 0.6976 & 0.244077 \tabularnewline
38 & 0.156791 & 1.2043 & 0.116634 \tabularnewline
39 & -0.127519 & -0.9795 & 0.165668 \tabularnewline
40 & -0.020409 & -0.1568 & 0.437983 \tabularnewline
41 & -0.005899 & -0.0453 & 0.482005 \tabularnewline
42 & -0.115047 & -0.8837 & 0.190224 \tabularnewline
43 & 0.07567 & 0.5812 & 0.281649 \tabularnewline
44 & -0.071734 & -0.551 & 0.291859 \tabularnewline
45 & -0.048214 & -0.3703 & 0.356228 \tabularnewline
46 & 0.031575 & 0.2425 & 0.404605 \tabularnewline
47 & -0.012768 & -0.0981 & 0.461105 \tabularnewline
48 & -0.036628 & -0.2813 & 0.389715 \tabularnewline
49 & -0.07448 & -0.5721 & 0.284716 \tabularnewline
50 & -0.039849 & -0.3061 & 0.380309 \tabularnewline
51 & 0.030599 & 0.235 & 0.407497 \tabularnewline
52 & 0.083953 & 0.6449 & 0.26076 \tabularnewline
53 & -0.026274 & -0.2018 & 0.420377 \tabularnewline
54 & 0.092816 & 0.7129 & 0.239349 \tabularnewline
55 & 0.012172 & 0.0935 & 0.462915 \tabularnewline
56 & 0.047757 & 0.3668 & 0.357529 \tabularnewline
57 & -0.001647 & -0.0127 & 0.494974 \tabularnewline
58 & 0.00223 & 0.0171 & 0.493195 \tabularnewline
59 & NA & NA & NA \tabularnewline
60 & NA & NA & NA \tabularnewline
\hline
\end{tabular}
%Source: https://freestatistics.org/blog/index.php?pk=34106&T=1

[TABLE]
[ROW][C]Autocorrelation Function[/C][/ROW]
[ROW][C]Time lag k[/C][C]ACF(k)[/C][C]T-STAT[/C][C]P-value[/C][/ROW]
[ROW][C]1[/C][C]0.004391[/C][C]0.0337[/C][C]0.486603[/C][/ROW]
[ROW][C]2[/C][C]0.022089[/C][C]0.1697[/C][C]0.432925[/C][/ROW]
[ROW][C]3[/C][C]0.006056[/C][C]0.0465[/C][C]0.481529[/C][/ROW]
[ROW][C]4[/C][C]-0.032179[/C][C]-0.2472[/C][C]0.402816[/C][/ROW]
[ROW][C]5[/C][C]-0.056531[/C][C]-0.4342[/C][C]0.332855[/C][/ROW]
[ROW][C]6[/C][C]-0.022048[/C][C]-0.1694[/C][C]0.433048[/C][/ROW]
[ROW][C]7[/C][C]-0.042612[/C][C]-0.3273[/C][C]0.372296[/C][/ROW]
[ROW][C]8[/C][C]0.005348[/C][C]0.0411[/C][C]0.483684[/C][/ROW]
[ROW][C]9[/C][C]0.138156[/C][C]1.0612[/C][C]0.146462[/C][/ROW]
[ROW][C]10[/C][C]-0.18081[/C][C]-1.3888[/C][C]0.085053[/C][/ROW]
[ROW][C]11[/C][C]0.022351[/C][C]0.1717[/C][C]0.432139[/C][/ROW]
[ROW][C]12[/C][C]-0.257354[/C][C]-1.9768[/C][C]0.026373[/C][/ROW]
[ROW][C]13[/C][C]-0.097089[/C][C]-0.7458[/C][C]0.229389[/C][/ROW]
[ROW][C]14[/C][C]0.115847[/C][C]0.8898[/C][C]0.188583[/C][/ROW]
[ROW][C]15[/C][C]0.010939[/C][C]0.084[/C][C]0.466661[/C][/ROW]
[ROW][C]16[/C][C]0.020278[/C][C]0.1558[/C][C]0.438378[/C][/ROW]
[ROW][C]17[/C][C]-0.087321[/C][C]-0.6707[/C][C]0.252505[/C][/ROW]
[ROW][C]18[/C][C]0.153758[/C][C]1.181[/C][C]0.121163[/C][/ROW]
[ROW][C]19[/C][C]0.072874[/C][C]0.5598[/C][C]0.288883[/C][/ROW]
[ROW][C]20[/C][C]0.083578[/C][C]0.642[/C][C]0.261687[/C][/ROW]
[ROW][C]21[/C][C]-0.01736[/C][C]-0.1333[/C][C]0.447189[/C][/ROW]
[ROW][C]22[/C][C]0.005126[/C][C]0.0394[/C][C]0.484364[/C][/ROW]
[ROW][C]23[/C][C]0.121262[/C][C]0.9314[/C][C]0.177712[/C][/ROW]
[ROW][C]24[/C][C]-0.13259[/C][C]-1.0184[/C][C]0.156312[/C][/ROW]
[ROW][C]25[/C][C]-0.08443[/C][C]-0.6485[/C][C]0.259583[/C][/ROW]
[ROW][C]26[/C][C]-0.213391[/C][C]-1.6391[/C][C]0.053259[/C][/ROW]
[ROW][C]27[/C][C]0.066481[/C][C]0.5107[/C][C]0.305749[/C][/ROW]
[ROW][C]28[/C][C]-0.078534[/C][C]-0.6032[/C][C]0.274333[/C][/ROW]
[ROW][C]29[/C][C]0.104442[/C][C]0.8022[/C][C]0.212819[/C][/ROW]
[ROW][C]30[/C][C]-0.126135[/C][C]-0.9689[/C][C]0.168285[/C][/ROW]
[ROW][C]31[/C][C]-0.081025[/C][C]-0.6224[/C][C]0.268049[/C][/ROW]
[ROW][C]32[/C][C]0.057107[/C][C]0.4386[/C][C]0.331259[/C][/ROW]
[ROW][C]33[/C][C]-0.064821[/C][C]-0.4979[/C][C]0.310203[/C][/ROW]
[ROW][C]34[/C][C]0.002736[/C][C]0.021[/C][C]0.491652[/C][/ROW]
[ROW][C]35[/C][C]-0.001351[/C][C]-0.0104[/C][C]0.495878[/C][/ROW]
[ROW][C]36[/C][C]0.018843[/C][C]0.1447[/C][C]0.442705[/C][/ROW]
[ROW][C]37[/C][C]0.090822[/C][C]0.6976[/C][C]0.244077[/C][/ROW]
[ROW][C]38[/C][C]0.156791[/C][C]1.2043[/C][C]0.116634[/C][/ROW]
[ROW][C]39[/C][C]-0.127519[/C][C]-0.9795[/C][C]0.165668[/C][/ROW]
[ROW][C]40[/C][C]-0.020409[/C][C]-0.1568[/C][C]0.437983[/C][/ROW]
[ROW][C]41[/C][C]-0.005899[/C][C]-0.0453[/C][C]0.482005[/C][/ROW]
[ROW][C]42[/C][C]-0.115047[/C][C]-0.8837[/C][C]0.190224[/C][/ROW]
[ROW][C]43[/C][C]0.07567[/C][C]0.5812[/C][C]0.281649[/C][/ROW]
[ROW][C]44[/C][C]-0.071734[/C][C]-0.551[/C][C]0.291859[/C][/ROW]
[ROW][C]45[/C][C]-0.048214[/C][C]-0.3703[/C][C]0.356228[/C][/ROW]
[ROW][C]46[/C][C]0.031575[/C][C]0.2425[/C][C]0.404605[/C][/ROW]
[ROW][C]47[/C][C]-0.012768[/C][C]-0.0981[/C][C]0.461105[/C][/ROW]
[ROW][C]48[/C][C]-0.036628[/C][C]-0.2813[/C][C]0.389715[/C][/ROW]
[ROW][C]49[/C][C]-0.07448[/C][C]-0.5721[/C][C]0.284716[/C][/ROW]
[ROW][C]50[/C][C]-0.039849[/C][C]-0.3061[/C][C]0.380309[/C][/ROW]
[ROW][C]51[/C][C]0.030599[/C][C]0.235[/C][C]0.407497[/C][/ROW]
[ROW][C]52[/C][C]0.083953[/C][C]0.6449[/C][C]0.26076[/C][/ROW]
[ROW][C]53[/C][C]-0.026274[/C][C]-0.2018[/C][C]0.420377[/C][/ROW]
[ROW][C]54[/C][C]0.092816[/C][C]0.7129[/C][C]0.239349[/C][/ROW]
[ROW][C]55[/C][C]0.012172[/C][C]0.0935[/C][C]0.462915[/C][/ROW]
[ROW][C]56[/C][C]0.047757[/C][C]0.3668[/C][C]0.357529[/C][/ROW]
[ROW][C]57[/C][C]-0.001647[/C][C]-0.0127[/C][C]0.494974[/C][/ROW]
[ROW][C]58[/C][C]0.00223[/C][C]0.0171[/C][C]0.493195[/C][/ROW]
[ROW][C]59[/C][C]NA[/C][C]NA[/C][C]NA[/C][/ROW]
[ROW][C]60[/C][C]NA[/C][C]NA[/C][C]NA[/C][/ROW]
[/TABLE]
Source: https://freestatistics.org/blog/index.php?pk=34106&T=1

Globally Unique Identifier (entire table): ba.freestatistics.org/blog/index.php?pk=34106&T=1

As an alternative you can also use a QR Code:  

The GUIDs for individual cells are displayed in the table below:

Autocorrelation Function
Time lag kACF(k)T-STATP-value
10.0043910.03370.486603
20.0220890.16970.432925
30.0060560.04650.481529
4-0.032179-0.24720.402816
5-0.056531-0.43420.332855
6-0.022048-0.16940.433048
7-0.042612-0.32730.372296
80.0053480.04110.483684
90.1381561.06120.146462
10-0.18081-1.38880.085053
110.0223510.17170.432139
12-0.257354-1.97680.026373
13-0.097089-0.74580.229389
140.1158470.88980.188583
150.0109390.0840.466661
160.0202780.15580.438378
17-0.087321-0.67070.252505
180.1537581.1810.121163
190.0728740.55980.288883
200.0835780.6420.261687
21-0.01736-0.13330.447189
220.0051260.03940.484364
230.1212620.93140.177712
24-0.13259-1.01840.156312
25-0.08443-0.64850.259583
26-0.213391-1.63910.053259
270.0664810.51070.305749
28-0.078534-0.60320.274333
290.1044420.80220.212819
30-0.126135-0.96890.168285
31-0.081025-0.62240.268049
320.0571070.43860.331259
33-0.064821-0.49790.310203
340.0027360.0210.491652
35-0.001351-0.01040.495878
360.0188430.14470.442705
370.0908220.69760.244077
380.1567911.20430.116634
39-0.127519-0.97950.165668
40-0.020409-0.15680.437983
41-0.005899-0.04530.482005
42-0.115047-0.88370.190224
430.075670.58120.281649
44-0.071734-0.5510.291859
45-0.048214-0.37030.356228
460.0315750.24250.404605
47-0.012768-0.09810.461105
48-0.036628-0.28130.389715
49-0.07448-0.57210.284716
50-0.039849-0.30610.380309
510.0305990.2350.407497
520.0839530.64490.26076
53-0.026274-0.20180.420377
540.0928160.71290.239349
550.0121720.09350.462915
560.0477570.36680.357529
57-0.001647-0.01270.494974
580.002230.01710.493195
59NANANA
60NANANA


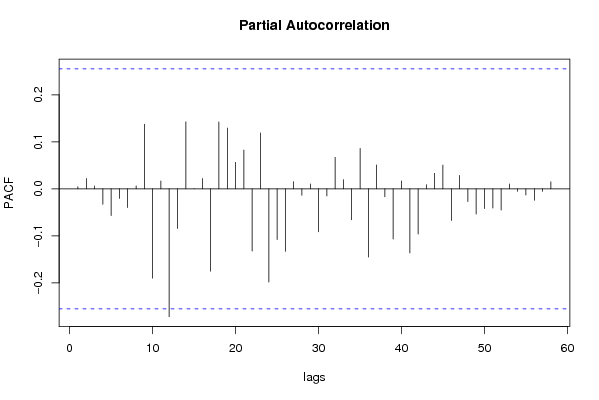
Partial Autocorrelation Function
Time lag kPACF(k)T-STATP-value
10.0043910.03370.486603
20.022070.16950.432982
30.0058670.04510.482104
4-0.032735-0.25140.401173
5-0.056609-0.43480.332639
6-0.020339-0.15620.438194
7-0.039749-0.30530.380599
80.0061460.04720.481252
90.1375011.05620.147599
10-0.190004-1.45950.074872
110.0167770.12890.448951
12-0.271913-2.08860.020534
13-0.084339-0.64780.259806
140.1426191.09550.138879
15-0.000119-9e-040.499638
160.0218410.16780.43367
17-0.175159-1.34540.091818
180.1423471.09340.139333
190.1292820.9930.162375
200.0564480.43360.333085
210.0825040.63370.264355
22-0.132266-1.0160.1569
230.1188630.9130.182478
24-0.198331-1.52340.066499
25-0.107941-0.82910.205191
26-0.132876-1.02060.155797
270.0151270.11620.453948
28-0.013699-0.10520.458277
290.0102360.07860.468799
30-0.091418-0.70220.24266
31-0.014918-0.11460.454582
320.0670540.51510.30422
330.0196460.15090.440284
34-0.065791-0.50540.307597
350.0859470.66020.255856
36-0.144997-1.11370.134954
370.0510260.39190.348258
38-0.016922-0.130.448511
39-0.106672-0.81940.207939
400.0166280.12770.449403
41-0.136222-1.04630.149835
42-0.095946-0.7370.232028
430.0088190.06770.47311
440.0329880.25340.400426
450.0505450.38820.349616
46-0.067513-0.51860.302998
470.0284960.21890.413749
48-0.027082-0.2080.417966
49-0.053579-0.41150.341081
50-0.041979-0.32240.374127
51-0.040748-0.3130.377695
52-0.044928-0.34510.365625
530.0103340.07940.468502
54-0.005311-0.04080.483799
55-0.012976-0.09970.460473
56-0.024173-0.18570.426669
57-0.00545-0.04190.483375
580.0149650.11490.454438
59NANANA
60NANANA

\begin{tabular}{lllllllll}
\hline
Partial Autocorrelation Function \tabularnewline
Time lag k & PACF(k) & T-STAT & P-value \tabularnewline
1 & 0.004391 & 0.0337 & 0.486603 \tabularnewline
2 & 0.02207 & 0.1695 & 0.432982 \tabularnewline
3 & 0.005867 & 0.0451 & 0.482104 \tabularnewline
4 & -0.032735 & -0.2514 & 0.401173 \tabularnewline
5 & -0.056609 & -0.4348 & 0.332639 \tabularnewline
6 & -0.020339 & -0.1562 & 0.438194 \tabularnewline
7 & -0.039749 & -0.3053 & 0.380599 \tabularnewline
8 & 0.006146 & 0.0472 & 0.481252 \tabularnewline
9 & 0.137501 & 1.0562 & 0.147599 \tabularnewline
10 & -0.190004 & -1.4595 & 0.074872 \tabularnewline
11 & 0.016777 & 0.1289 & 0.448951 \tabularnewline
12 & -0.271913 & -2.0886 & 0.020534 \tabularnewline
13 & -0.084339 & -0.6478 & 0.259806 \tabularnewline
14 & 0.142619 & 1.0955 & 0.138879 \tabularnewline
15 & -0.000119 & -9e-04 & 0.499638 \tabularnewline
16 & 0.021841 & 0.1678 & 0.43367 \tabularnewline
17 & -0.175159 & -1.3454 & 0.091818 \tabularnewline
18 & 0.142347 & 1.0934 & 0.139333 \tabularnewline
19 & 0.129282 & 0.993 & 0.162375 \tabularnewline
20 & 0.056448 & 0.4336 & 0.333085 \tabularnewline
21 & 0.082504 & 0.6337 & 0.264355 \tabularnewline
22 & -0.132266 & -1.016 & 0.1569 \tabularnewline
23 & 0.118863 & 0.913 & 0.182478 \tabularnewline
24 & -0.198331 & -1.5234 & 0.066499 \tabularnewline
25 & -0.107941 & -0.8291 & 0.205191 \tabularnewline
26 & -0.132876 & -1.0206 & 0.155797 \tabularnewline
27 & 0.015127 & 0.1162 & 0.453948 \tabularnewline
28 & -0.013699 & -0.1052 & 0.458277 \tabularnewline
29 & 0.010236 & 0.0786 & 0.468799 \tabularnewline
30 & -0.091418 & -0.7022 & 0.24266 \tabularnewline
31 & -0.014918 & -0.1146 & 0.454582 \tabularnewline
32 & 0.067054 & 0.5151 & 0.30422 \tabularnewline
33 & 0.019646 & 0.1509 & 0.440284 \tabularnewline
34 & -0.065791 & -0.5054 & 0.307597 \tabularnewline
35 & 0.085947 & 0.6602 & 0.255856 \tabularnewline
36 & -0.144997 & -1.1137 & 0.134954 \tabularnewline
37 & 0.051026 & 0.3919 & 0.348258 \tabularnewline
38 & -0.016922 & -0.13 & 0.448511 \tabularnewline
39 & -0.106672 & -0.8194 & 0.207939 \tabularnewline
40 & 0.016628 & 0.1277 & 0.449403 \tabularnewline
41 & -0.136222 & -1.0463 & 0.149835 \tabularnewline
42 & -0.095946 & -0.737 & 0.232028 \tabularnewline
43 & 0.008819 & 0.0677 & 0.47311 \tabularnewline
44 & 0.032988 & 0.2534 & 0.400426 \tabularnewline
45 & 0.050545 & 0.3882 & 0.349616 \tabularnewline
46 & -0.067513 & -0.5186 & 0.302998 \tabularnewline
47 & 0.028496 & 0.2189 & 0.413749 \tabularnewline
48 & -0.027082 & -0.208 & 0.417966 \tabularnewline
49 & -0.053579 & -0.4115 & 0.341081 \tabularnewline
50 & -0.041979 & -0.3224 & 0.374127 \tabularnewline
51 & -0.040748 & -0.313 & 0.377695 \tabularnewline
52 & -0.044928 & -0.3451 & 0.365625 \tabularnewline
53 & 0.010334 & 0.0794 & 0.468502 \tabularnewline
54 & -0.005311 & -0.0408 & 0.483799 \tabularnewline
55 & -0.012976 & -0.0997 & 0.460473 \tabularnewline
56 & -0.024173 & -0.1857 & 0.426669 \tabularnewline
57 & -0.00545 & -0.0419 & 0.483375 \tabularnewline
58 & 0.014965 & 0.1149 & 0.454438 \tabularnewline
59 & NA & NA & NA \tabularnewline
60 & NA & NA & NA \tabularnewline
\hline
\end{tabular}
%Source: https://freestatistics.org/blog/index.php?pk=34106&T=2

[TABLE]
[ROW][C]Partial Autocorrelation Function[/C][/ROW]
[ROW][C]Time lag k[/C][C]PACF(k)[/C][C]T-STAT[/C][C]P-value[/C][/ROW]
[ROW][C]1[/C][C]0.004391[/C][C]0.0337[/C][C]0.486603[/C][/ROW]
[ROW][C]2[/C][C]0.02207[/C][C]0.1695[/C][C]0.432982[/C][/ROW]
[ROW][C]3[/C][C]0.005867[/C][C]0.0451[/C][C]0.482104[/C][/ROW]
[ROW][C]4[/C][C]-0.032735[/C][C]-0.2514[/C][C]0.401173[/C][/ROW]
[ROW][C]5[/C][C]-0.056609[/C][C]-0.4348[/C][C]0.332639[/C][/ROW]
[ROW][C]6[/C][C]-0.020339[/C][C]-0.1562[/C][C]0.438194[/C][/ROW]
[ROW][C]7[/C][C]-0.039749[/C][C]-0.3053[/C][C]0.380599[/C][/ROW]
[ROW][C]8[/C][C]0.006146[/C][C]0.0472[/C][C]0.481252[/C][/ROW]
[ROW][C]9[/C][C]0.137501[/C][C]1.0562[/C][C]0.147599[/C][/ROW]
[ROW][C]10[/C][C]-0.190004[/C][C]-1.4595[/C][C]0.074872[/C][/ROW]
[ROW][C]11[/C][C]0.016777[/C][C]0.1289[/C][C]0.448951[/C][/ROW]
[ROW][C]12[/C][C]-0.271913[/C][C]-2.0886[/C][C]0.020534[/C][/ROW]
[ROW][C]13[/C][C]-0.084339[/C][C]-0.6478[/C][C]0.259806[/C][/ROW]
[ROW][C]14[/C][C]0.142619[/C][C]1.0955[/C][C]0.138879[/C][/ROW]
[ROW][C]15[/C][C]-0.000119[/C][C]-9e-04[/C][C]0.499638[/C][/ROW]
[ROW][C]16[/C][C]0.021841[/C][C]0.1678[/C][C]0.43367[/C][/ROW]
[ROW][C]17[/C][C]-0.175159[/C][C]-1.3454[/C][C]0.091818[/C][/ROW]
[ROW][C]18[/C][C]0.142347[/C][C]1.0934[/C][C]0.139333[/C][/ROW]
[ROW][C]19[/C][C]0.129282[/C][C]0.993[/C][C]0.162375[/C][/ROW]
[ROW][C]20[/C][C]0.056448[/C][C]0.4336[/C][C]0.333085[/C][/ROW]
[ROW][C]21[/C][C]0.082504[/C][C]0.6337[/C][C]0.264355[/C][/ROW]
[ROW][C]22[/C][C]-0.132266[/C][C]-1.016[/C][C]0.1569[/C][/ROW]
[ROW][C]23[/C][C]0.118863[/C][C]0.913[/C][C]0.182478[/C][/ROW]
[ROW][C]24[/C][C]-0.198331[/C][C]-1.5234[/C][C]0.066499[/C][/ROW]
[ROW][C]25[/C][C]-0.107941[/C][C]-0.8291[/C][C]0.205191[/C][/ROW]
[ROW][C]26[/C][C]-0.132876[/C][C]-1.0206[/C][C]0.155797[/C][/ROW]
[ROW][C]27[/C][C]0.015127[/C][C]0.1162[/C][C]0.453948[/C][/ROW]
[ROW][C]28[/C][C]-0.013699[/C][C]-0.1052[/C][C]0.458277[/C][/ROW]
[ROW][C]29[/C][C]0.010236[/C][C]0.0786[/C][C]0.468799[/C][/ROW]
[ROW][C]30[/C][C]-0.091418[/C][C]-0.7022[/C][C]0.24266[/C][/ROW]
[ROW][C]31[/C][C]-0.014918[/C][C]-0.1146[/C][C]0.454582[/C][/ROW]
[ROW][C]32[/C][C]0.067054[/C][C]0.5151[/C][C]0.30422[/C][/ROW]
[ROW][C]33[/C][C]0.019646[/C][C]0.1509[/C][C]0.440284[/C][/ROW]
[ROW][C]34[/C][C]-0.065791[/C][C]-0.5054[/C][C]0.307597[/C][/ROW]
[ROW][C]35[/C][C]0.085947[/C][C]0.6602[/C][C]0.255856[/C][/ROW]
[ROW][C]36[/C][C]-0.144997[/C][C]-1.1137[/C][C]0.134954[/C][/ROW]
[ROW][C]37[/C][C]0.051026[/C][C]0.3919[/C][C]0.348258[/C][/ROW]
[ROW][C]38[/C][C]-0.016922[/C][C]-0.13[/C][C]0.448511[/C][/ROW]
[ROW][C]39[/C][C]-0.106672[/C][C]-0.8194[/C][C]0.207939[/C][/ROW]
[ROW][C]40[/C][C]0.016628[/C][C]0.1277[/C][C]0.449403[/C][/ROW]
[ROW][C]41[/C][C]-0.136222[/C][C]-1.0463[/C][C]0.149835[/C][/ROW]
[ROW][C]42[/C][C]-0.095946[/C][C]-0.737[/C][C]0.232028[/C][/ROW]
[ROW][C]43[/C][C]0.008819[/C][C]0.0677[/C][C]0.47311[/C][/ROW]
[ROW][C]44[/C][C]0.032988[/C][C]0.2534[/C][C]0.400426[/C][/ROW]
[ROW][C]45[/C][C]0.050545[/C][C]0.3882[/C][C]0.349616[/C][/ROW]
[ROW][C]46[/C][C]-0.067513[/C][C]-0.5186[/C][C]0.302998[/C][/ROW]
[ROW][C]47[/C][C]0.028496[/C][C]0.2189[/C][C]0.413749[/C][/ROW]
[ROW][C]48[/C][C]-0.027082[/C][C]-0.208[/C][C]0.417966[/C][/ROW]
[ROW][C]49[/C][C]-0.053579[/C][C]-0.4115[/C][C]0.341081[/C][/ROW]
[ROW][C]50[/C][C]-0.041979[/C][C]-0.3224[/C][C]0.374127[/C][/ROW]
[ROW][C]51[/C][C]-0.040748[/C][C]-0.313[/C][C]0.377695[/C][/ROW]
[ROW][C]52[/C][C]-0.044928[/C][C]-0.3451[/C][C]0.365625[/C][/ROW]
[ROW][C]53[/C][C]0.010334[/C][C]0.0794[/C][C]0.468502[/C][/ROW]
[ROW][C]54[/C][C]-0.005311[/C][C]-0.0408[/C][C]0.483799[/C][/ROW]
[ROW][C]55[/C][C]-0.012976[/C][C]-0.0997[/C][C]0.460473[/C][/ROW]
[ROW][C]56[/C][C]-0.024173[/C][C]-0.1857[/C][C]0.426669[/C][/ROW]
[ROW][C]57[/C][C]-0.00545[/C][C]-0.0419[/C][C]0.483375[/C][/ROW]
[ROW][C]58[/C][C]0.014965[/C][C]0.1149[/C][C]0.454438[/C][/ROW]
[ROW][C]59[/C][C]NA[/C][C]NA[/C][C]NA[/C][/ROW]
[ROW][C]60[/C][C]NA[/C][C]NA[/C][C]NA[/C][/ROW]
[/TABLE]
Source: https://freestatistics.org/blog/index.php?pk=34106&T=2

Globally Unique Identifier (entire table): ba.freestatistics.org/blog/index.php?pk=34106&T=2

As an alternative you can also use a QR Code:  

The GUIDs for individual cells are displayed in the table below:

Partial Autocorrelation Function
Time lag kPACF(k)T-STATP-value
10.0043910.03370.486603
20.022070.16950.432982
30.0058670.04510.482104
4-0.032735-0.25140.401173
5-0.056609-0.43480.332639
6-0.020339-0.15620.438194
7-0.039749-0.30530.380599
80.0061460.04720.481252
90.1375011.05620.147599
10-0.190004-1.45950.074872
110.0167770.12890.448951
12-0.271913-2.08860.020534
13-0.084339-0.64780.259806
140.1426191.09550.138879
15-0.000119-9e-040.499638
160.0218410.16780.43367
17-0.175159-1.34540.091818
180.1423471.09340.139333
190.1292820.9930.162375
200.0564480.43360.333085
210.0825040.63370.264355
22-0.132266-1.0160.1569
230.1188630.9130.182478
24-0.198331-1.52340.066499
25-0.107941-0.82910.205191
26-0.132876-1.02060.155797
270.0151270.11620.453948
28-0.013699-0.10520.458277
290.0102360.07860.468799
30-0.091418-0.70220.24266
31-0.014918-0.11460.454582
320.0670540.51510.30422
330.0196460.15090.440284
34-0.065791-0.50540.307597
350.0859470.66020.255856
36-0.144997-1.11370.134954
370.0510260.39190.348258
38-0.016922-0.130.448511
39-0.106672-0.81940.207939
400.0166280.12770.449403
41-0.136222-1.04630.149835
42-0.095946-0.7370.232028
430.0088190.06770.47311
440.0329880.25340.400426
450.0505450.38820.349616
46-0.067513-0.51860.302998
470.0284960.21890.413749
48-0.027082-0.2080.417966
49-0.053579-0.41150.341081
50-0.041979-0.32240.374127
51-0.040748-0.3130.377695
52-0.044928-0.34510.365625
530.0103340.07940.468502
54-0.005311-0.04080.483799
55-0.012976-0.09970.460473
56-0.024173-0.18570.426669
57-0.00545-0.04190.483375
580.0149650.11490.454438
59NANANA
60NANANA


Parameters (Session):
par1 = 60 ; par2 = 1 ; par3 = 1 ; par4 = 1 ; par5 = 12 ;
Parameters (R input):
par1 = 60 ; par2 = 1 ; par3 = 1 ; par4 = 1 ; par5 = 12 ;
R code (references can be found in the software module):
if (par1 == 'Default') {
par1 = 10*log10(length(x))
} else {
par1 <- as.numeric(par1)
}
par2 <- as.numeric(par2)
par3 <- as.numeric(par3)
par4 <- as.numeric(par4)
par5 <- as.numeric(par5)
if (par2 == 0) {
x <- log(x)
} else {
x <- (x ^ par2 - 1) / par2
}
if (par3 > 0) x <- diff(x,lag=1,difference=par3)
if (par4 > 0) x <- diff(x,lag=par5,difference=par4)
bitmap(file='pic1.png')
racf <- acf(x,par1,main='Autocorrelation',xlab='lags',ylab='ACF')
dev.off()
bitmap(file='pic2.png')
rpacf <- pacf(x,par1,main='Partial Autocorrelation',xlab='lags',ylab='PACF')
dev.off()
(myacf <- c(racf$acf))
(mypacf <- c(rpacf$acf))
lengthx <- length(x)
sqrtn <- sqrt(lengthx)
load(file='createtable')
a<-table.start()
a<-table.row.start(a)
a<-table.element(a,'Autocorrelation Function',4,TRUE)
a<-table.row.end(a)
a<-table.row.start(a)
a<-table.element(a,'Time lag k',header=TRUE)
a<-table.element(a,hyperlink('basics.htm','ACF(k)','click here for more information about the Autocorrelation Function'),header=TRUE)
a<-table.element(a,'T-STAT',header=TRUE)
a<-table.element(a,'P-value',header=TRUE)
a<-table.row.end(a)
for (i in 2:(par1+1)) {
a<-table.row.start(a)
a<-table.element(a,i-1,header=TRUE)
a<-table.element(a,round(myacf[i],6))
mytstat <- myacf[i]*sqrtn
a<-table.element(a,round(mytstat,4))
a<-table.element(a,round(1-pt(abs(mytstat),lengthx),6))
a<-table.row.end(a)
}
a<-table.end(a)
table.save(a,file='mytable.tab')
a<-table.start()
a<-table.row.start(a)
a<-table.element(a,'Partial Autocorrelation Function',4,TRUE)
a<-table.row.end(a)
a<-table.row.start(a)
a<-table.element(a,'Time lag k',header=TRUE)
a<-table.element(a,hyperlink('basics.htm','PACF(k)','click here for more information about the Partial Autocorrelation Function'),header=TRUE)
a<-table.element(a,'T-STAT',header=TRUE)
a<-table.element(a,'P-value',header=TRUE)
a<-table.row.end(a)
for (i in 1:par1) {
a<-table.row.start(a)
a<-table.element(a,i,header=TRUE)
a<-table.element(a,round(mypacf[i],6))
mytstat <- mypacf[i]*sqrtn
a<-table.element(a,round(mytstat,4))
a<-table.element(a,round(1-pt(abs(mytstat),lengthx),6))
a<-table.row.end(a)
}
a<-table.end(a)
table.save(a,file='mytable1.tab')