Free Statistics

of Irreproducible Research!

Author's title

Author*Unverified author*
R Software Modulerwasp_autocorrelation.wasp
Title produced by software(Partial) Autocorrelation Function
Date of computationTue, 16 Dec 2008 11:22:34 -0700
Cite this page as followsStatistical Computations at FreeStatistics.org, Office for Research Development and Education, URL https://freestatistics.org/blog/index.php?v=date/2008/Dec/16/t1229452535cx9ub7dfb6jj0cw.htm/, Retrieved Wed, 15 May 2024 01:55:25 +0000
Statistical Computations at FreeStatistics.org, Office for Research Development and Education, URL https://freestatistics.org/blog/index.php?pk=34089, Retrieved Wed, 15 May 2024 01:55:25 +0000
QR Codes:

Original text written by user:
IsPrivate?No (this computation is public)
User-defined keywordsK_Vanderheggen
Estimated Impact211
Family? (F = Feedback message, R = changed R code, M = changed R Module, P = changed Parameters, D = changed Data)
-     [Mean Plot] [paper werklooshei...] [2008-11-28 16:41:24] [1640119c345fbfa2091dc1243f79f7a6]
- RMPD  [Spectral Analysis] [paper spectral an...] [2008-12-12 17:39:08] [1640119c345fbfa2091dc1243f79f7a6]
- RMP       [(Partial) Autocorrelation Function] [Paper] [2008-12-16 18:22:34] [9a6b6d9f802c100119d25349a6856aad] [Current]
Feedback Forum

Post a new message
Dataseries X:
5.5
5.3
5.2
5.3
5.3
5
4.8
4.9
5.3
6
6.2
6.4
6.4
6.4
6.2
6.1
6
5.9
6.2
6.2
6.4
6.8
6.9
7
7
6.9
6.7
6.6
6.5
6.4
6.5
6.5
6.6
6.7
6.8
7.2
7.6
7.6
7.3
6.4
6.1
6.3
7.1
7.5
7.4
7.1
6.8
6.9
7.2
7.4
7.3
6.9
6.9
6.8
7.1
7.2
7.1
7
6.9
7
7.4
7.5
7.5
7.4
7.3
7
6.7
6.5
6.5
6.5
6.6
6.8
6.9
6.9
6.8
6.8
6.5
6.1
6
5.9
5.8
5.9
5.9
6.2
6.3
6.2
6
5.8
5.5
5.5
5.7
5.8


Summary of computational transaction
Raw Inputview raw input (R code)
Raw Outputview raw output of R engine
Computing time1 seconds
R Server'Gwilym Jenkins' @ 72.249.127.135

\begin{tabular}{lllllllll}
\hline
Summary of computational transaction \tabularnewline
Raw Input & view raw input (R code)  \tabularnewline
Raw Output & view raw output of R engine  \tabularnewline
Computing time & 1 seconds \tabularnewline
R Server & 'Gwilym Jenkins' @ 72.249.127.135 \tabularnewline
\hline
\end{tabular}
%Source: https://freestatistics.org/blog/index.php?pk=34089&T=0

[TABLE]
[ROW][C]Summary of computational transaction[/C][/ROW]
[ROW][C]Raw Input[/C][C]view raw input (R code) [/C][/ROW]
[ROW][C]Raw Output[/C][C]view raw output of R engine [/C][/ROW]
[ROW][C]Computing time[/C][C]1 seconds[/C][/ROW]
[ROW][C]R Server[/C][C]'Gwilym Jenkins' @ 72.249.127.135[/C][/ROW]
[/TABLE]
Source: https://freestatistics.org/blog/index.php?pk=34089&T=0

Globally Unique Identifier (entire table): ba.freestatistics.org/blog/index.php?pk=34089&T=0

As an alternative you can also use a QR Code:  

The GUIDs for individual cells are displayed in the table below:

Summary of computational transaction
Raw Inputview raw input (R code)
Raw Outputview raw output of R engine
Computing time1 seconds
R Server'Gwilym Jenkins' @ 72.249.127.135


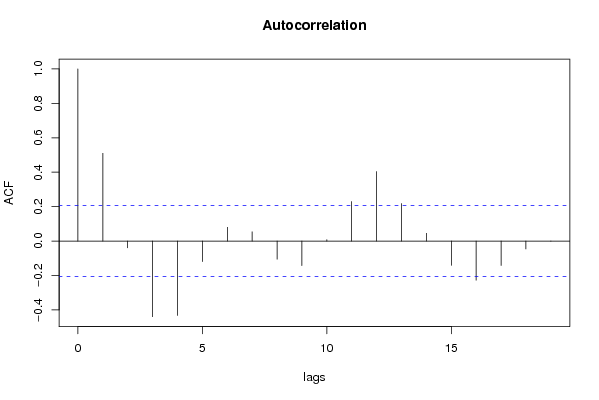
Autocorrelation Function
Time lag kACF(k)T-STATP-value
10.5101644.86672e-06
2-0.039597-0.37770.353256
3-0.439236-4.193.2e-05
4-0.431917-4.12024.2e-05
5-0.11885-1.13380.129938
60.0798120.76140.224206
70.0535390.51070.305389
8-0.105658-1.00790.158084
9-0.142572-1.36010.088587
100.0076710.07320.470912
110.2292842.18720.015644
120.4037373.85140.000109
130.2178972.07860.020234
140.045070.42990.334128
15-0.141017-1.34520.090949
16-0.227587-2.1710.016265
17-0.141331-1.34820.090469
18-0.045506-0.43410.332621
19-0.000472-0.00450.498209

\begin{tabular}{lllllllll}
\hline
Autocorrelation Function \tabularnewline
Time lag k & ACF(k) & T-STAT & P-value \tabularnewline
1 & 0.510164 & 4.8667 & 2e-06 \tabularnewline
2 & -0.039597 & -0.3777 & 0.353256 \tabularnewline
3 & -0.439236 & -4.19 & 3.2e-05 \tabularnewline
4 & -0.431917 & -4.1202 & 4.2e-05 \tabularnewline
5 & -0.11885 & -1.1338 & 0.129938 \tabularnewline
6 & 0.079812 & 0.7614 & 0.224206 \tabularnewline
7 & 0.053539 & 0.5107 & 0.305389 \tabularnewline
8 & -0.105658 & -1.0079 & 0.158084 \tabularnewline
9 & -0.142572 & -1.3601 & 0.088587 \tabularnewline
10 & 0.007671 & 0.0732 & 0.470912 \tabularnewline
11 & 0.229284 & 2.1872 & 0.015644 \tabularnewline
12 & 0.403737 & 3.8514 & 0.000109 \tabularnewline
13 & 0.217897 & 2.0786 & 0.020234 \tabularnewline
14 & 0.04507 & 0.4299 & 0.334128 \tabularnewline
15 & -0.141017 & -1.3452 & 0.090949 \tabularnewline
16 & -0.227587 & -2.171 & 0.016265 \tabularnewline
17 & -0.141331 & -1.3482 & 0.090469 \tabularnewline
18 & -0.045506 & -0.4341 & 0.332621 \tabularnewline
19 & -0.000472 & -0.0045 & 0.498209 \tabularnewline
\hline
\end{tabular}
%Source: https://freestatistics.org/blog/index.php?pk=34089&T=1

[TABLE]
[ROW][C]Autocorrelation Function[/C][/ROW]
[ROW][C]Time lag k[/C][C]ACF(k)[/C][C]T-STAT[/C][C]P-value[/C][/ROW]
[ROW][C]1[/C][C]0.510164[/C][C]4.8667[/C][C]2e-06[/C][/ROW]
[ROW][C]2[/C][C]-0.039597[/C][C]-0.3777[/C][C]0.353256[/C][/ROW]
[ROW][C]3[/C][C]-0.439236[/C][C]-4.19[/C][C]3.2e-05[/C][/ROW]
[ROW][C]4[/C][C]-0.431917[/C][C]-4.1202[/C][C]4.2e-05[/C][/ROW]
[ROW][C]5[/C][C]-0.11885[/C][C]-1.1338[/C][C]0.129938[/C][/ROW]
[ROW][C]6[/C][C]0.079812[/C][C]0.7614[/C][C]0.224206[/C][/ROW]
[ROW][C]7[/C][C]0.053539[/C][C]0.5107[/C][C]0.305389[/C][/ROW]
[ROW][C]8[/C][C]-0.105658[/C][C]-1.0079[/C][C]0.158084[/C][/ROW]
[ROW][C]9[/C][C]-0.142572[/C][C]-1.3601[/C][C]0.088587[/C][/ROW]
[ROW][C]10[/C][C]0.007671[/C][C]0.0732[/C][C]0.470912[/C][/ROW]
[ROW][C]11[/C][C]0.229284[/C][C]2.1872[/C][C]0.015644[/C][/ROW]
[ROW][C]12[/C][C]0.403737[/C][C]3.8514[/C][C]0.000109[/C][/ROW]
[ROW][C]13[/C][C]0.217897[/C][C]2.0786[/C][C]0.020234[/C][/ROW]
[ROW][C]14[/C][C]0.04507[/C][C]0.4299[/C][C]0.334128[/C][/ROW]
[ROW][C]15[/C][C]-0.141017[/C][C]-1.3452[/C][C]0.090949[/C][/ROW]
[ROW][C]16[/C][C]-0.227587[/C][C]-2.171[/C][C]0.016265[/C][/ROW]
[ROW][C]17[/C][C]-0.141331[/C][C]-1.3482[/C][C]0.090469[/C][/ROW]
[ROW][C]18[/C][C]-0.045506[/C][C]-0.4341[/C][C]0.332621[/C][/ROW]
[ROW][C]19[/C][C]-0.000472[/C][C]-0.0045[/C][C]0.498209[/C][/ROW]
[/TABLE]
Source: https://freestatistics.org/blog/index.php?pk=34089&T=1

Globally Unique Identifier (entire table): ba.freestatistics.org/blog/index.php?pk=34089&T=1

As an alternative you can also use a QR Code:  

The GUIDs for individual cells are displayed in the table below:

Autocorrelation Function
Time lag kACF(k)T-STATP-value
10.5101644.86672e-06
2-0.039597-0.37770.353256
3-0.439236-4.193.2e-05
4-0.431917-4.12024.2e-05
5-0.11885-1.13380.129938
60.0798120.76140.224206
70.0535390.51070.305389
8-0.105658-1.00790.158084
9-0.142572-1.36010.088587
100.0076710.07320.470912
110.2292842.18720.015644
120.4037373.85140.000109
130.2178972.07860.020234
140.045070.42990.334128
15-0.141017-1.34520.090949
16-0.227587-2.1710.016265
17-0.141331-1.34820.090469
18-0.045506-0.43410.332621
19-0.000472-0.00450.498209


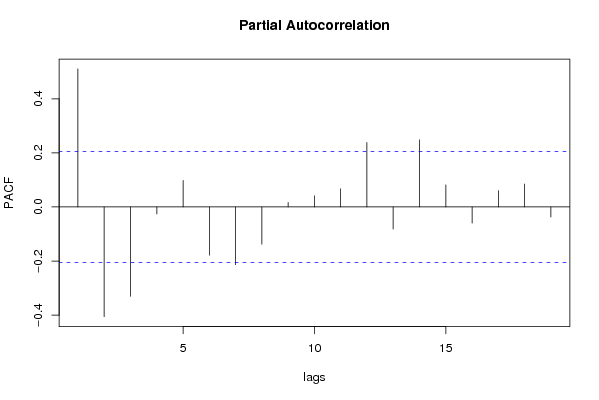
Partial Autocorrelation Function
Time lag kPACF(k)T-STATP-value
10.5101644.86672e-06
2-0.405368-3.8670.000103
3-0.33007-3.14870.001109
4-0.025524-0.24350.404089
50.0979790.93470.176217
6-0.178282-1.70070.046207
7-0.213125-2.03310.022479
8-0.137405-1.31080.096619
90.0169150.16140.436085
100.0410910.3920.347994
110.0672970.6420.261252
120.2383212.27340.012676
13-0.081757-0.77990.218734
140.2482462.36810.009998
150.081420.77670.219676
16-0.059522-0.56780.285784
170.0603360.57560.283162
180.0847390.80840.210497
19-0.03738-0.35660.361114

\begin{tabular}{lllllllll}
\hline
Partial Autocorrelation Function \tabularnewline
Time lag k & PACF(k) & T-STAT & P-value \tabularnewline
1 & 0.510164 & 4.8667 & 2e-06 \tabularnewline
2 & -0.405368 & -3.867 & 0.000103 \tabularnewline
3 & -0.33007 & -3.1487 & 0.001109 \tabularnewline
4 & -0.025524 & -0.2435 & 0.404089 \tabularnewline
5 & 0.097979 & 0.9347 & 0.176217 \tabularnewline
6 & -0.178282 & -1.7007 & 0.046207 \tabularnewline
7 & -0.213125 & -2.0331 & 0.022479 \tabularnewline
8 & -0.137405 & -1.3108 & 0.096619 \tabularnewline
9 & 0.016915 & 0.1614 & 0.436085 \tabularnewline
10 & 0.041091 & 0.392 & 0.347994 \tabularnewline
11 & 0.067297 & 0.642 & 0.261252 \tabularnewline
12 & 0.238321 & 2.2734 & 0.012676 \tabularnewline
13 & -0.081757 & -0.7799 & 0.218734 \tabularnewline
14 & 0.248246 & 2.3681 & 0.009998 \tabularnewline
15 & 0.08142 & 0.7767 & 0.219676 \tabularnewline
16 & -0.059522 & -0.5678 & 0.285784 \tabularnewline
17 & 0.060336 & 0.5756 & 0.283162 \tabularnewline
18 & 0.084739 & 0.8084 & 0.210497 \tabularnewline
19 & -0.03738 & -0.3566 & 0.361114 \tabularnewline
\hline
\end{tabular}
%Source: https://freestatistics.org/blog/index.php?pk=34089&T=2

[TABLE]
[ROW][C]Partial Autocorrelation Function[/C][/ROW]
[ROW][C]Time lag k[/C][C]PACF(k)[/C][C]T-STAT[/C][C]P-value[/C][/ROW]
[ROW][C]1[/C][C]0.510164[/C][C]4.8667[/C][C]2e-06[/C][/ROW]
[ROW][C]2[/C][C]-0.405368[/C][C]-3.867[/C][C]0.000103[/C][/ROW]
[ROW][C]3[/C][C]-0.33007[/C][C]-3.1487[/C][C]0.001109[/C][/ROW]
[ROW][C]4[/C][C]-0.025524[/C][C]-0.2435[/C][C]0.404089[/C][/ROW]
[ROW][C]5[/C][C]0.097979[/C][C]0.9347[/C][C]0.176217[/C][/ROW]
[ROW][C]6[/C][C]-0.178282[/C][C]-1.7007[/C][C]0.046207[/C][/ROW]
[ROW][C]7[/C][C]-0.213125[/C][C]-2.0331[/C][C]0.022479[/C][/ROW]
[ROW][C]8[/C][C]-0.137405[/C][C]-1.3108[/C][C]0.096619[/C][/ROW]
[ROW][C]9[/C][C]0.016915[/C][C]0.1614[/C][C]0.436085[/C][/ROW]
[ROW][C]10[/C][C]0.041091[/C][C]0.392[/C][C]0.347994[/C][/ROW]
[ROW][C]11[/C][C]0.067297[/C][C]0.642[/C][C]0.261252[/C][/ROW]
[ROW][C]12[/C][C]0.238321[/C][C]2.2734[/C][C]0.012676[/C][/ROW]
[ROW][C]13[/C][C]-0.081757[/C][C]-0.7799[/C][C]0.218734[/C][/ROW]
[ROW][C]14[/C][C]0.248246[/C][C]2.3681[/C][C]0.009998[/C][/ROW]
[ROW][C]15[/C][C]0.08142[/C][C]0.7767[/C][C]0.219676[/C][/ROW]
[ROW][C]16[/C][C]-0.059522[/C][C]-0.5678[/C][C]0.285784[/C][/ROW]
[ROW][C]17[/C][C]0.060336[/C][C]0.5756[/C][C]0.283162[/C][/ROW]
[ROW][C]18[/C][C]0.084739[/C][C]0.8084[/C][C]0.210497[/C][/ROW]
[ROW][C]19[/C][C]-0.03738[/C][C]-0.3566[/C][C]0.361114[/C][/ROW]
[/TABLE]
Source: https://freestatistics.org/blog/index.php?pk=34089&T=2

Globally Unique Identifier (entire table): ba.freestatistics.org/blog/index.php?pk=34089&T=2

As an alternative you can also use a QR Code:  

The GUIDs for individual cells are displayed in the table below:

Partial Autocorrelation Function
Time lag kPACF(k)T-STATP-value
10.5101644.86672e-06
2-0.405368-3.8670.000103
3-0.33007-3.14870.001109
4-0.025524-0.24350.404089
50.0979790.93470.176217
6-0.178282-1.70070.046207
7-0.213125-2.03310.022479
8-0.137405-1.31080.096619
90.0169150.16140.436085
100.0410910.3920.347994
110.0672970.6420.261252
120.2383212.27340.012676
13-0.081757-0.77990.218734
140.2482462.36810.009998
150.081420.77670.219676
16-0.059522-0.56780.285784
170.0603360.57560.283162
180.0847390.80840.210497
19-0.03738-0.35660.361114


Parameters (Session):
par1 = Default ; par2 = 1 ; par3 = 1 ; par4 = 0 ; par5 = 12 ;
Parameters (R input):
par1 = Default ; par2 = 1 ; par3 = 1 ; par4 = 0 ; par5 = 12 ;
R code (references can be found in the software module):
if (par1 == 'Default') {
par1 = 10*log10(length(x))
} else {
par1 <- as.numeric(par1)
}
par2 <- as.numeric(par2)
par3 <- as.numeric(par3)
par4 <- as.numeric(par4)
par5 <- as.numeric(par5)
if (par2 == 0) {
x <- log(x)
} else {
x <- (x ^ par2 - 1) / par2
}
if (par3 > 0) x <- diff(x,lag=1,difference=par3)
if (par4 > 0) x <- diff(x,lag=par5,difference=par4)
bitmap(file='pic1.png')
racf <- acf(x,par1,main='Autocorrelation',xlab='lags',ylab='ACF')
dev.off()
bitmap(file='pic2.png')
rpacf <- pacf(x,par1,main='Partial Autocorrelation',xlab='lags',ylab='PACF')
dev.off()
(myacf <- c(racf$acf))
(mypacf <- c(rpacf$acf))
lengthx <- length(x)
sqrtn <- sqrt(lengthx)
load(file='createtable')
a<-table.start()
a<-table.row.start(a)
a<-table.element(a,'Autocorrelation Function',4,TRUE)
a<-table.row.end(a)
a<-table.row.start(a)
a<-table.element(a,'Time lag k',header=TRUE)
a<-table.element(a,hyperlink('basics.htm','ACF(k)','click here for more information about the Autocorrelation Function'),header=TRUE)
a<-table.element(a,'T-STAT',header=TRUE)
a<-table.element(a,'P-value',header=TRUE)
a<-table.row.end(a)
for (i in 2:(par1+1)) {
a<-table.row.start(a)
a<-table.element(a,i-1,header=TRUE)
a<-table.element(a,round(myacf[i],6))
mytstat <- myacf[i]*sqrtn
a<-table.element(a,round(mytstat,4))
a<-table.element(a,round(1-pt(abs(mytstat),lengthx),6))
a<-table.row.end(a)
}
a<-table.end(a)
table.save(a,file='mytable.tab')
a<-table.start()
a<-table.row.start(a)
a<-table.element(a,'Partial Autocorrelation Function',4,TRUE)
a<-table.row.end(a)
a<-table.row.start(a)
a<-table.element(a,'Time lag k',header=TRUE)
a<-table.element(a,hyperlink('basics.htm','PACF(k)','click here for more information about the Partial Autocorrelation Function'),header=TRUE)
a<-table.element(a,'T-STAT',header=TRUE)
a<-table.element(a,'P-value',header=TRUE)
a<-table.row.end(a)
for (i in 1:par1) {
a<-table.row.start(a)
a<-table.element(a,i,header=TRUE)
a<-table.element(a,round(mypacf[i],6))
mytstat <- mypacf[i]*sqrtn
a<-table.element(a,round(mytstat,4))
a<-table.element(a,round(1-pt(abs(mytstat),lengthx),6))
a<-table.row.end(a)
}
a<-table.end(a)
table.save(a,file='mytable1.tab')