Free Statistics

of Irreproducible Research!

Author's title

Author*Unverified author*
R Software Modulerwasp_arimaforecasting.wasp
Title produced by softwareARIMA Forecasting
Date of computationTue, 16 Dec 2008 11:15:32 -0700
Cite this page as followsStatistical Computations at FreeStatistics.org, Office for Research Development and Education, URL https://freestatistics.org/blog/index.php?v=date/2008/Dec/16/t12294514169f1r3edn8p05ut4.htm/, Retrieved Wed, 15 May 2024 16:40:39 +0000
Statistical Computations at FreeStatistics.org, Office for Research Development and Education, URL https://freestatistics.org/blog/index.php?pk=34079, Retrieved Wed, 15 May 2024 16:40:39 +0000
QR Codes:

Original text written by user:
IsPrivate?No (this computation is public)
User-defined keywords
Estimated Impact220
Family? (F = Feedback message, R = changed R code, M = changed R Module, P = changed Parameters, D = changed Data)
F     [ARIMA Forecasting] [hfdst 21 arima fo...] [2008-12-15 08:32:33] [11edab5c4db3615abbf782b1c6e7cacf]
F R PD    [ARIMA Forecasting] [Arima Bel 20] [2008-12-16 18:15:32] [6c16737409bc392209b0ce8176e438df] [Current]
Feedback Forum
2008-12-17 21:09:03 [Julie Govaerts] [reply
step 1 --> De 12 laatste maanden van de tijdreeks worden weggelaten. Er wordt een voorspelling gemaakt van die 12 laatste maanden aan de hand van de resterende (niet weggelaten) maanden. De voorspelling wordt dan vergeleken met de werkelijke waarden. De software gaat de voorspellingen berekenen adhv differentievergelijkingen als dit mogelijk is uiteraard.

step 2 -->
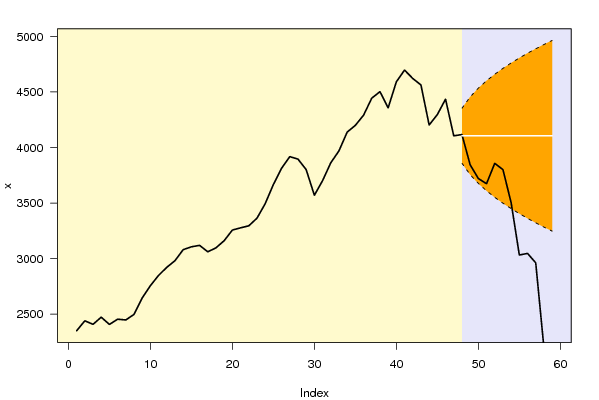
-1e grafiek = Het grijze gedeelte stelt de voorspelling voor
-Het donkeroranje oppervlak van deze grafiek geeft het 95%-betrouwbaarheidsinterval weer. De volle lijn is onze werkelijke waarde en de witte lijn is onze voorspelde waarde.
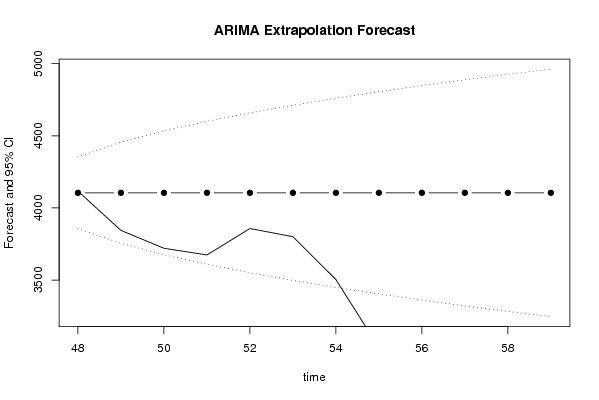
-2e grafiek = het laatste deel van de eerste grafiek wordt hier uitvergroot
-Deze toont het 95% betrouwbaarheidsinterval = de stippellijnen
-Hier is het duidelijk dat de voorspellingen (bollenlijn) hoger liggen dan onze werkelijke observaties (volle lijn) = dit zagen we ook al in de tabel.

step 3 -->
-De procentuele standaardfout = obv het model = een theoretische schatting = kolom 2
-En de procentuele werkelijke fout = kolom 3
-Hoe verder we in de toekomst gaan voorspellen hoe groter de S.E. wordt, dit valt te verklaren doordat de berekening rekening houdt met alle gegevens. Dit wil zeggen dat als maand 55 wordt berekend dat er ook rekening wordt gehouden met de voorspelling van de maand 54. Maar de maand 54 is ook slechts een voorspelling dus we houden voor het berekenen van de maand 55 rekening met de voorafgaande voorspellingen en de gegeven tijdsreeks. Daardoor is de verwachte voorspellingsfout een stijgend gegeven in de tijd.
2008-12-22 10:31:30 [Nicolaj Wuyts] [reply
Step 1:
De forecast vertoond een merkwaardig verloop naar het einde toe. De werkelijke waarde valt buiten het 95% betrouwbaarheidsinterval. Het verschil tussen de voorspelde en werkelijke waarde is dus significant.

Step 2:
Er is een zeer duidelijke dalende trend op lange termijn. Deze wordt ook bevestigd door de negatieve waarde in de PE tabel.

Step 3:
We zien dat de SE% slechts 10% is. Afgaande op dit cijfer zouden we dus kunnen stellen dat de vorspelling redelijk betrouwbaar is. Wanneer we echter naar de PE waarde gaan zien, merken we dat deze veel te groot is en dat de forecast niet accuraat genoeg is. Enkel de eerste zes periodes kunnen redelijk goed voorspeld worden

Step 4:
We zien dat de p-value na waarde 53 onder de 0,05 procent duikt. Dit bevestigd dat het verschil tussen de werkelijke en voorspelde waarde significant is. De drie daarop volgende kolommen geven aan dat de er een stijging zou moeten plaats vinden, terwijl de werkelijke waarde enkel maar daalt. Dit toont wederom aan dat de forecast niet accuraat is.

Step 5:
We zien dat ook op de extrapolation grafiek de werkelijk waarde na lag 53 buiten het 95% betrouwbaarheidsinterval duikt.

Post a new message
Dataseries X:
2350.44
2440.25
2408.64
2472.81
2407.6
2454.62
2448.05
2497.84
2645.64
2756.76
2849.27
2921.44
2981.85
3080.58
3106.22
3119.31
3061.26
3097.31
3161.69
3257.16
3277.01
3295.32
3363.99
3494.17
3667.03
3813.06
3917.96
3895.51
3801.06
3570.12
3701.61
3862.27
3970.1
4138.52
4199.75
4290.89
4443.91
4502.64
4356.98
4591.27
4696.96
4621.4
4562.84
4202.52
4296.49
4435.23
4105.18
4116.68
3844.49
3720.98
3674.4
3857.62
3801.06
3504.37
3032.6
3047.03
2962.34
2197.82
2014.45


Summary of computational transaction
Raw Inputview raw input (R code)
Raw Outputview raw output of R engine
Computing time1 seconds
R Server'George Udny Yule' @ 72.249.76.132

\begin{tabular}{lllllllll}
\hline
Summary of computational transaction \tabularnewline
Raw Input & view raw input (R code)  \tabularnewline
Raw Output & view raw output of R engine  \tabularnewline
Computing time & 1 seconds \tabularnewline
R Server & 'George Udny Yule' @ 72.249.76.132 \tabularnewline
\hline
\end{tabular}
%Source: https://freestatistics.org/blog/index.php?pk=34079&T=0

[TABLE]
[ROW][C]Summary of computational transaction[/C][/ROW]
[ROW][C]Raw Input[/C][C]view raw input (R code) [/C][/ROW]
[ROW][C]Raw Output[/C][C]view raw output of R engine [/C][/ROW]
[ROW][C]Computing time[/C][C]1 seconds[/C][/ROW]
[ROW][C]R Server[/C][C]'George Udny Yule' @ 72.249.76.132[/C][/ROW]
[/TABLE]
Source: https://freestatistics.org/blog/index.php?pk=34079&T=0

Globally Unique Identifier (entire table): ba.freestatistics.org/blog/index.php?pk=34079&T=0

As an alternative you can also use a QR Code:  

The GUIDs for individual cells are displayed in the table below:

Summary of computational transaction
Raw Inputview raw input (R code)
Raw Outputview raw output of R engine
Computing time1 seconds
R Server'George Udny Yule' @ 72.249.76.132


Univariate ARIMA Extrapolation Forecast
timeY[t]F[t]95% LB95% UBp-value(H0: Y[t] = F[t])P(F[t]>Y[t-1])P(F[t]>Y[t-s])P(F[t]>Y[47])
354199.75-------
364290.89-------
374443.91-------
384502.64-------
394356.98-------
404591.27-------
414696.96-------
424621.4-------
434562.84-------
444202.52-------
454296.49-------
464435.23-------
474105.18-------
484116.684105.183857.44024352.91980.46380.50.07090.5
493844.494105.183754.82314455.53690.07240.47440.0290.5
503720.984105.183676.08224534.27780.03960.88310.03470.5
513674.44105.183609.70054600.65950.04420.93570.15960.5
523857.624105.183551.21714659.14290.19050.93630.04270.5
533801.064105.183498.3444712.0160.1630.7880.0280.5
543504.374105.183449.72224760.63780.03620.81840.06130.5
553032.64105.183404.46624805.89380.00130.95360.10020.5
563047.034105.183361.96074848.39930.00260.99770.39870.5
572962.344105.183321.75814888.60190.00210.99590.31610.5
582197.824105.183283.52024926.839800.99680.21560.5
592014.454105.183246.98434963.3757010.50.5

\begin{tabular}{lllllllll}
\hline
Univariate ARIMA Extrapolation Forecast \tabularnewline
time & Y[t] & F[t] & 95% LB & 95% UB & p-value(H0: Y[t] = F[t]) & P(F[t]>Y[t-1]) & P(F[t]>Y[t-s]) & P(F[t]>Y[47]) \tabularnewline
35 & 4199.75 & - & - & - & - & - & - & - \tabularnewline
36 & 4290.89 & - & - & - & - & - & - & - \tabularnewline
37 & 4443.91 & - & - & - & - & - & - & - \tabularnewline
38 & 4502.64 & - & - & - & - & - & - & - \tabularnewline
39 & 4356.98 & - & - & - & - & - & - & - \tabularnewline
40 & 4591.27 & - & - & - & - & - & - & - \tabularnewline
41 & 4696.96 & - & - & - & - & - & - & - \tabularnewline
42 & 4621.4 & - & - & - & - & - & - & - \tabularnewline
43 & 4562.84 & - & - & - & - & - & - & - \tabularnewline
44 & 4202.52 & - & - & - & - & - & - & - \tabularnewline
45 & 4296.49 & - & - & - & - & - & - & - \tabularnewline
46 & 4435.23 & - & - & - & - & - & - & - \tabularnewline
47 & 4105.18 & - & - & - & - & - & - & - \tabularnewline
48 & 4116.68 & 4105.18 & 3857.4402 & 4352.9198 & 0.4638 & 0.5 & 0.0709 & 0.5 \tabularnewline
49 & 3844.49 & 4105.18 & 3754.8231 & 4455.5369 & 0.0724 & 0.4744 & 0.029 & 0.5 \tabularnewline
50 & 3720.98 & 4105.18 & 3676.0822 & 4534.2778 & 0.0396 & 0.8831 & 0.0347 & 0.5 \tabularnewline
51 & 3674.4 & 4105.18 & 3609.7005 & 4600.6595 & 0.0442 & 0.9357 & 0.1596 & 0.5 \tabularnewline
52 & 3857.62 & 4105.18 & 3551.2171 & 4659.1429 & 0.1905 & 0.9363 & 0.0427 & 0.5 \tabularnewline
53 & 3801.06 & 4105.18 & 3498.344 & 4712.016 & 0.163 & 0.788 & 0.028 & 0.5 \tabularnewline
54 & 3504.37 & 4105.18 & 3449.7222 & 4760.6378 & 0.0362 & 0.8184 & 0.0613 & 0.5 \tabularnewline
55 & 3032.6 & 4105.18 & 3404.4662 & 4805.8938 & 0.0013 & 0.9536 & 0.1002 & 0.5 \tabularnewline
56 & 3047.03 & 4105.18 & 3361.9607 & 4848.3993 & 0.0026 & 0.9977 & 0.3987 & 0.5 \tabularnewline
57 & 2962.34 & 4105.18 & 3321.7581 & 4888.6019 & 0.0021 & 0.9959 & 0.3161 & 0.5 \tabularnewline
58 & 2197.82 & 4105.18 & 3283.5202 & 4926.8398 & 0 & 0.9968 & 0.2156 & 0.5 \tabularnewline
59 & 2014.45 & 4105.18 & 3246.9843 & 4963.3757 & 0 & 1 & 0.5 & 0.5 \tabularnewline
\hline
\end{tabular}
%Source: https://freestatistics.org/blog/index.php?pk=34079&T=1

[TABLE]
[ROW][C]Univariate ARIMA Extrapolation Forecast[/C][/ROW]
[ROW][C]time[/C][C]Y[t][/C][C]F[t][/C][C]95% LB[/C][C]95% UB[/C][C]p-value(H0: Y[t] = F[t])[/C][C]P(F[t]>Y[t-1])[/C][C]P(F[t]>Y[t-s])[/C][C]P(F[t]>Y[47])[/C][/ROW]
[ROW][C]35[/C][C]4199.75[/C][C]-[/C][C]-[/C][C]-[/C][C]-[/C][C]-[/C][C]-[/C][C]-[/C][/ROW]
[ROW][C]36[/C][C]4290.89[/C][C]-[/C][C]-[/C][C]-[/C][C]-[/C][C]-[/C][C]-[/C][C]-[/C][/ROW]
[ROW][C]37[/C][C]4443.91[/C][C]-[/C][C]-[/C][C]-[/C][C]-[/C][C]-[/C][C]-[/C][C]-[/C][/ROW]
[ROW][C]38[/C][C]4502.64[/C][C]-[/C][C]-[/C][C]-[/C][C]-[/C][C]-[/C][C]-[/C][C]-[/C][/ROW]
[ROW][C]39[/C][C]4356.98[/C][C]-[/C][C]-[/C][C]-[/C][C]-[/C][C]-[/C][C]-[/C][C]-[/C][/ROW]
[ROW][C]40[/C][C]4591.27[/C][C]-[/C][C]-[/C][C]-[/C][C]-[/C][C]-[/C][C]-[/C][C]-[/C][/ROW]
[ROW][C]41[/C][C]4696.96[/C][C]-[/C][C]-[/C][C]-[/C][C]-[/C][C]-[/C][C]-[/C][C]-[/C][/ROW]
[ROW][C]42[/C][C]4621.4[/C][C]-[/C][C]-[/C][C]-[/C][C]-[/C][C]-[/C][C]-[/C][C]-[/C][/ROW]
[ROW][C]43[/C][C]4562.84[/C][C]-[/C][C]-[/C][C]-[/C][C]-[/C][C]-[/C][C]-[/C][C]-[/C][/ROW]
[ROW][C]44[/C][C]4202.52[/C][C]-[/C][C]-[/C][C]-[/C][C]-[/C][C]-[/C][C]-[/C][C]-[/C][/ROW]
[ROW][C]45[/C][C]4296.49[/C][C]-[/C][C]-[/C][C]-[/C][C]-[/C][C]-[/C][C]-[/C][C]-[/C][/ROW]
[ROW][C]46[/C][C]4435.23[/C][C]-[/C][C]-[/C][C]-[/C][C]-[/C][C]-[/C][C]-[/C][C]-[/C][/ROW]
[ROW][C]47[/C][C]4105.18[/C][C]-[/C][C]-[/C][C]-[/C][C]-[/C][C]-[/C][C]-[/C][C]-[/C][/ROW]
[ROW][C]48[/C][C]4116.68[/C][C]4105.18[/C][C]3857.4402[/C][C]4352.9198[/C][C]0.4638[/C][C]0.5[/C][C]0.0709[/C][C]0.5[/C][/ROW]
[ROW][C]49[/C][C]3844.49[/C][C]4105.18[/C][C]3754.8231[/C][C]4455.5369[/C][C]0.0724[/C][C]0.4744[/C][C]0.029[/C][C]0.5[/C][/ROW]
[ROW][C]50[/C][C]3720.98[/C][C]4105.18[/C][C]3676.0822[/C][C]4534.2778[/C][C]0.0396[/C][C]0.8831[/C][C]0.0347[/C][C]0.5[/C][/ROW]
[ROW][C]51[/C][C]3674.4[/C][C]4105.18[/C][C]3609.7005[/C][C]4600.6595[/C][C]0.0442[/C][C]0.9357[/C][C]0.1596[/C][C]0.5[/C][/ROW]
[ROW][C]52[/C][C]3857.62[/C][C]4105.18[/C][C]3551.2171[/C][C]4659.1429[/C][C]0.1905[/C][C]0.9363[/C][C]0.0427[/C][C]0.5[/C][/ROW]
[ROW][C]53[/C][C]3801.06[/C][C]4105.18[/C][C]3498.344[/C][C]4712.016[/C][C]0.163[/C][C]0.788[/C][C]0.028[/C][C]0.5[/C][/ROW]
[ROW][C]54[/C][C]3504.37[/C][C]4105.18[/C][C]3449.7222[/C][C]4760.6378[/C][C]0.0362[/C][C]0.8184[/C][C]0.0613[/C][C]0.5[/C][/ROW]
[ROW][C]55[/C][C]3032.6[/C][C]4105.18[/C][C]3404.4662[/C][C]4805.8938[/C][C]0.0013[/C][C]0.9536[/C][C]0.1002[/C][C]0.5[/C][/ROW]
[ROW][C]56[/C][C]3047.03[/C][C]4105.18[/C][C]3361.9607[/C][C]4848.3993[/C][C]0.0026[/C][C]0.9977[/C][C]0.3987[/C][C]0.5[/C][/ROW]
[ROW][C]57[/C][C]2962.34[/C][C]4105.18[/C][C]3321.7581[/C][C]4888.6019[/C][C]0.0021[/C][C]0.9959[/C][C]0.3161[/C][C]0.5[/C][/ROW]
[ROW][C]58[/C][C]2197.82[/C][C]4105.18[/C][C]3283.5202[/C][C]4926.8398[/C][C]0[/C][C]0.9968[/C][C]0.2156[/C][C]0.5[/C][/ROW]
[ROW][C]59[/C][C]2014.45[/C][C]4105.18[/C][C]3246.9843[/C][C]4963.3757[/C][C]0[/C][C]1[/C][C]0.5[/C][C]0.5[/C][/ROW]
[/TABLE]
Source: https://freestatistics.org/blog/index.php?pk=34079&T=1

Globally Unique Identifier (entire table): ba.freestatistics.org/blog/index.php?pk=34079&T=1

As an alternative you can also use a QR Code:  

The GUIDs for individual cells are displayed in the table below:

Univariate ARIMA Extrapolation Forecast
timeY[t]F[t]95% LB95% UBp-value(H0: Y[t] = F[t])P(F[t]>Y[t-1])P(F[t]>Y[t-s])P(F[t]>Y[47])
354199.75-------
364290.89-------
374443.91-------
384502.64-------
394356.98-------
404591.27-------
414696.96-------
424621.4-------
434562.84-------
444202.52-------
454296.49-------
464435.23-------
474105.18-------
484116.684105.183857.44024352.91980.46380.50.07090.5
493844.494105.183754.82314455.53690.07240.47440.0290.5
503720.984105.183676.08224534.27780.03960.88310.03470.5
513674.44105.183609.70054600.65950.04420.93570.15960.5
523857.624105.183551.21714659.14290.19050.93630.04270.5
533801.064105.183498.3444712.0160.1630.7880.0280.5
543504.374105.183449.72224760.63780.03620.81840.06130.5
553032.64105.183404.46624805.89380.00130.95360.10020.5
563047.034105.183361.96074848.39930.00260.99770.39870.5
572962.344105.183321.75814888.60190.00210.99590.31610.5
582197.824105.183283.52024926.839800.99680.21560.5
592014.454105.183246.98434963.3757010.50.5


Univariate ARIMA Extrapolation Forecast Performance
time% S.E.PEMAPESq.EMSERMSE
480.03080.00282e-04132.2511.02083.3198
490.0435-0.06350.005367959.27615663.27375.2547
500.0533-0.09360.0078147609.6412300.8033110.909
510.0616-0.10490.0087185571.408415464.284124.3555
520.0688-0.06030.00561285.95365107.162871.4644
530.0754-0.07410.006292488.97447707.414587.7919
540.0815-0.14640.0122360972.656130081.0547173.4389
550.0871-0.26130.02181150427.856495868.988309.6272
560.0924-0.25780.02151119681.422593306.7852305.4616
570.0974-0.27840.02321306083.2656108840.2721329.9095
580.1021-0.46460.03873638022.1696303168.5141550.6074
590.1067-0.50930.04244371151.9329364262.6611603.5418

\begin{tabular}{lllllllll}
\hline
Univariate ARIMA Extrapolation Forecast Performance \tabularnewline
time & % S.E. & PE & MAPE & Sq.E & MSE & RMSE \tabularnewline
48 & 0.0308 & 0.0028 & 2e-04 & 132.25 & 11.0208 & 3.3198 \tabularnewline
49 & 0.0435 & -0.0635 & 0.0053 & 67959.2761 & 5663.273 & 75.2547 \tabularnewline
50 & 0.0533 & -0.0936 & 0.0078 & 147609.64 & 12300.8033 & 110.909 \tabularnewline
51 & 0.0616 & -0.1049 & 0.0087 & 185571.4084 & 15464.284 & 124.3555 \tabularnewline
52 & 0.0688 & -0.0603 & 0.005 & 61285.9536 & 5107.1628 & 71.4644 \tabularnewline
53 & 0.0754 & -0.0741 & 0.0062 & 92488.9744 & 7707.4145 & 87.7919 \tabularnewline
54 & 0.0815 & -0.1464 & 0.0122 & 360972.6561 & 30081.0547 & 173.4389 \tabularnewline
55 & 0.0871 & -0.2613 & 0.0218 & 1150427.8564 & 95868.988 & 309.6272 \tabularnewline
56 & 0.0924 & -0.2578 & 0.0215 & 1119681.4225 & 93306.7852 & 305.4616 \tabularnewline
57 & 0.0974 & -0.2784 & 0.0232 & 1306083.2656 & 108840.2721 & 329.9095 \tabularnewline
58 & 0.1021 & -0.4646 & 0.0387 & 3638022.1696 & 303168.5141 & 550.6074 \tabularnewline
59 & 0.1067 & -0.5093 & 0.0424 & 4371151.9329 & 364262.6611 & 603.5418 \tabularnewline
\hline
\end{tabular}
%Source: https://freestatistics.org/blog/index.php?pk=34079&T=2

[TABLE]
[ROW][C]Univariate ARIMA Extrapolation Forecast Performance[/C][/ROW]
[ROW][C]time[/C][C]% S.E.[/C][C]PE[/C][C]MAPE[/C][C]Sq.E[/C][C]MSE[/C][C]RMSE[/C][/ROW]
[ROW][C]48[/C][C]0.0308[/C][C]0.0028[/C][C]2e-04[/C][C]132.25[/C][C]11.0208[/C][C]3.3198[/C][/ROW]
[ROW][C]49[/C][C]0.0435[/C][C]-0.0635[/C][C]0.0053[/C][C]67959.2761[/C][C]5663.273[/C][C]75.2547[/C][/ROW]
[ROW][C]50[/C][C]0.0533[/C][C]-0.0936[/C][C]0.0078[/C][C]147609.64[/C][C]12300.8033[/C][C]110.909[/C][/ROW]
[ROW][C]51[/C][C]0.0616[/C][C]-0.1049[/C][C]0.0087[/C][C]185571.4084[/C][C]15464.284[/C][C]124.3555[/C][/ROW]
[ROW][C]52[/C][C]0.0688[/C][C]-0.0603[/C][C]0.005[/C][C]61285.9536[/C][C]5107.1628[/C][C]71.4644[/C][/ROW]
[ROW][C]53[/C][C]0.0754[/C][C]-0.0741[/C][C]0.0062[/C][C]92488.9744[/C][C]7707.4145[/C][C]87.7919[/C][/ROW]
[ROW][C]54[/C][C]0.0815[/C][C]-0.1464[/C][C]0.0122[/C][C]360972.6561[/C][C]30081.0547[/C][C]173.4389[/C][/ROW]
[ROW][C]55[/C][C]0.0871[/C][C]-0.2613[/C][C]0.0218[/C][C]1150427.8564[/C][C]95868.988[/C][C]309.6272[/C][/ROW]
[ROW][C]56[/C][C]0.0924[/C][C]-0.2578[/C][C]0.0215[/C][C]1119681.4225[/C][C]93306.7852[/C][C]305.4616[/C][/ROW]
[ROW][C]57[/C][C]0.0974[/C][C]-0.2784[/C][C]0.0232[/C][C]1306083.2656[/C][C]108840.2721[/C][C]329.9095[/C][/ROW]
[ROW][C]58[/C][C]0.1021[/C][C]-0.4646[/C][C]0.0387[/C][C]3638022.1696[/C][C]303168.5141[/C][C]550.6074[/C][/ROW]
[ROW][C]59[/C][C]0.1067[/C][C]-0.5093[/C][C]0.0424[/C][C]4371151.9329[/C][C]364262.6611[/C][C]603.5418[/C][/ROW]
[/TABLE]
Source: https://freestatistics.org/blog/index.php?pk=34079&T=2

Globally Unique Identifier (entire table): ba.freestatistics.org/blog/index.php?pk=34079&T=2

As an alternative you can also use a QR Code:  

The GUIDs for individual cells are displayed in the table below:

Univariate ARIMA Extrapolation Forecast Performance
time% S.E.PEMAPESq.EMSERMSE
480.03080.00282e-04132.2511.02083.3198
490.0435-0.06350.005367959.27615663.27375.2547
500.0533-0.09360.0078147609.6412300.8033110.909
510.0616-0.10490.0087185571.408415464.284124.3555
520.0688-0.06030.00561285.95365107.162871.4644
530.0754-0.07410.006292488.97447707.414587.7919
540.0815-0.14640.0122360972.656130081.0547173.4389
550.0871-0.26130.02181150427.856495868.988309.6272
560.0924-0.25780.02151119681.422593306.7852305.4616
570.0974-0.27840.02321306083.2656108840.2721329.9095
580.1021-0.46460.03873638022.1696303168.5141550.6074
590.1067-0.50930.04244371151.9329364262.6611603.5418


Parameters (Session):
par1 = 12 ; par2 = 1 ; par3 = 1 ; par4 = 0 ; par5 = 12 ; par6 = 0 ; par7 = 0 ; par8 = 0 ; par9 = 0 ; par10 = FALSE ;
Parameters (R input):
par1 = 12 ; par2 = 1 ; par3 = 1 ; par4 = 0 ; par5 = 12 ; par6 = 0 ; par7 = 0 ; par8 = 0 ; par9 = 0 ; par10 = FALSE ;
R code (references can be found in the software module):
par1 <- as.numeric(par1) #cut off periods
par2 <- as.numeric(par2) #lambda
par3 <- as.numeric(par3) #degree of non-seasonal differencing
par4 <- as.numeric(par4) #degree of seasonal differencing
par5 <- as.numeric(par5) #seasonal period
par6 <- as.numeric(par6) #p
par7 <- as.numeric(par7) #q
par8 <- as.numeric(par8) #P
par9 <- as.numeric(par9) #Q
if (par10 == 'TRUE') par10 <- TRUE
if (par10 == 'FALSE') par10 <- FALSE
if (par2 == 0) x <- log(x)
if (par2 != 0) x <- x^par2
lx <- length(x)
first <- lx - 2*par1
nx <- lx - par1
nx1 <- nx + 1
fx <- lx - nx
if (fx < 1) {
fx <- par5
nx1 <- lx + fx - 1
first <- lx - 2*fx
}
first <- 1
if (fx < 3) fx <- round(lx/10,0)
(arima.out <- arima(x[1:nx], order=c(par6,par3,par7), seasonal=list(order=c(par8,par4,par9), period=par5), include.mean=par10, method='ML'))
(forecast <- predict(arima.out,fx))
(lb <- forecast$pred - 1.96 * forecast$se)
(ub <- forecast$pred + 1.96 * forecast$se)
if (par2 == 0) {
x <- exp(x)
forecast$pred <- exp(forecast$pred)
lb <- exp(lb)
ub <- exp(ub)
}
if (par2 != 0) {
x <- x^(1/par2)
forecast$pred <- forecast$pred^(1/par2)
lb <- lb^(1/par2)
ub <- ub^(1/par2)
}
if (par2 < 0) {
olb <- lb
lb <- ub
ub <- olb
}
(actandfor <- c(x[1:nx], forecast$pred))
(perc.se <- (ub-forecast$pred)/1.96/forecast$pred)
bitmap(file='test1.png')
opar <- par(mar=c(4,4,2,2),las=1)
ylim <- c( min(x[first:nx],lb), max(x[first:nx],ub))
plot(x,ylim=ylim,type='n',xlim=c(first,lx))
usr <- par('usr')
rect(usr[1],usr[3],nx+1,usr[4],border=NA,col='lemonchiffon')
rect(nx1,usr[3],usr[2],usr[4],border=NA,col='lavender')
abline(h= (-3:3)*2 , col ='gray', lty =3)
polygon( c(nx1:lx,lx:nx1), c(lb,rev(ub)), col = 'orange', lty=2,border=NA)
lines(nx1:lx, lb , lty=2)
lines(nx1:lx, ub , lty=2)
lines(x, lwd=2)
lines(nx1:lx, forecast$pred , lwd=2 , col ='white')
box()
par(opar)
dev.off()
prob.dec <- array(NA, dim=fx)
prob.sdec <- array(NA, dim=fx)
prob.ldec <- array(NA, dim=fx)
prob.pval <- array(NA, dim=fx)
perf.pe <- array(0, dim=fx)
perf.mape <- array(0, dim=fx)
perf.se <- array(0, dim=fx)
perf.mse <- array(0, dim=fx)
perf.rmse <- array(0, dim=fx)
for (i in 1:fx) {
locSD <- (ub[i] - forecast$pred[i]) / 1.96
perf.pe[i] = (x[nx+i] - forecast$pred[i]) / forecast$pred[i]
perf.mape[i] = perf.mape[i] + abs(perf.pe[i])
perf.se[i] = (x[nx+i] - forecast$pred[i])^2
perf.mse[i] = perf.mse[i] + perf.se[i]
prob.dec[i] = pnorm((x[nx+i-1] - forecast$pred[i]) / locSD)
prob.sdec[i] = pnorm((x[nx+i-par5] - forecast$pred[i]) / locSD)
prob.ldec[i] = pnorm((x[nx] - forecast$pred[i]) / locSD)
prob.pval[i] = pnorm(abs(x[nx+i] - forecast$pred[i]) / locSD)
}
perf.mape = perf.mape / fx
perf.mse = perf.mse / fx
perf.rmse = sqrt(perf.mse)
bitmap(file='test2.png')
plot(forecast$pred, pch=19, type='b',main='ARIMA Extrapolation Forecast', ylab='Forecast and 95% CI', xlab='time',ylim=c(min(lb),max(ub)))
dum <- forecast$pred
dum[1:12] <- x[(nx+1):lx]
lines(dum, lty=1)
lines(ub,lty=3)
lines(lb,lty=3)
dev.off()
load(file='createtable')
a<-table.start()
a<-table.row.start(a)
a<-table.element(a,'Univariate ARIMA Extrapolation Forecast',9,TRUE)
a<-table.row.end(a)
a<-table.row.start(a)
a<-table.element(a,'time',1,header=TRUE)
a<-table.element(a,'Y[t]',1,header=TRUE)
a<-table.element(a,'F[t]',1,header=TRUE)
a<-table.element(a,'95% LB',1,header=TRUE)
a<-table.element(a,'95% UB',1,header=TRUE)
a<-table.element(a,'p-value
(H0: Y[t] = F[t])',1,header=TRUE)
a<-table.element(a,'P(F[t]>Y[t-1])',1,header=TRUE)
a<-table.element(a,'P(F[t]>Y[t-s])',1,header=TRUE)
mylab <- paste('P(F[t]>Y[',nx,sep='')
mylab <- paste(mylab,'])',sep='')
a<-table.element(a,mylab,1,header=TRUE)
a<-table.row.end(a)
for (i in (nx-par5):nx) {
a<-table.row.start(a)
a<-table.element(a,i,header=TRUE)
a<-table.element(a,x[i])
a<-table.element(a,'-')
a<-table.row.end(a)
}
for (i in 1:fx) {
a<-table.row.start(a)
a<-table.element(a,nx+i,header=TRUE)
a<-table.element(a,round(x[nx+i],4))
a<-table.element(a,round(forecast$pred[i],4))
a<-table.element(a,round(lb[i],4))
a<-table.element(a,round(ub[i],4))
a<-table.element(a,round((1-prob.pval[i]),4))
a<-table.element(a,round((1-prob.dec[i]),4))
a<-table.element(a,round((1-prob.sdec[i]),4))
a<-table.element(a,round((1-prob.ldec[i]),4))
a<-table.row.end(a)
}
a<-table.end(a)
table.save(a,file='mytable.tab')
a<-table.start()
a<-table.row.start(a)
a<-table.element(a,'Univariate ARIMA Extrapolation Forecast Performance',7,TRUE)
a<-table.row.end(a)
a<-table.row.start(a)
a<-table.element(a,'time',1,header=TRUE)
a<-table.element(a,'% S.E.',1,header=TRUE)
a<-table.element(a,'PE',1,header=TRUE)
a<-table.element(a,'MAPE',1,header=TRUE)
a<-table.element(a,'Sq.E',1,header=TRUE)
a<-table.element(a,'MSE',1,header=TRUE)
a<-table.element(a,'RMSE',1,header=TRUE)
a<-table.row.end(a)
for (i in 1:fx) {
a<-table.row.start(a)
a<-table.element(a,nx+i,header=TRUE)
a<-table.element(a,round(perc.se[i],4))
a<-table.element(a,round(perf.pe[i],4))
a<-table.element(a,round(perf.mape[i],4))
a<-table.element(a,round(perf.se[i],4))
a<-table.element(a,round(perf.mse[i],4))
a<-table.element(a,round(perf.rmse[i],4))
a<-table.row.end(a)
}
a<-table.end(a)
table.save(a,file='mytable1.tab')