Free Statistics

of Irreproducible Research!

Author's title

Author*The author of this computation has been verified*
R Software Modulerwasp_arimaforecasting.wasp
Title produced by softwareARIMA Forecasting
Date of computationTue, 16 Dec 2008 11:07:14 -0700
Cite this page as followsStatistical Computations at FreeStatistics.org, Office for Research Development and Education, URL https://freestatistics.org/blog/index.php?v=date/2008/Dec/16/t12294509711fetrd6vy9fkt8q.htm/, Retrieved Wed, 15 May 2024 02:02:32 +0000
Statistical Computations at FreeStatistics.org, Office for Research Development and Education, URL https://freestatistics.org/blog/index.php?pk=34071, Retrieved Wed, 15 May 2024 02:02:32 +0000
QR Codes:

Original text written by user:
IsPrivate?No (this computation is public)
User-defined keywords
Estimated Impact213
Family? (F = Feedback message, R = changed R code, M = changed R Module, P = changed Parameters, D = changed Data)
F     [Univariate Data Series] [Airline data] [2007-10-18 09:58:47] [42daae401fd3def69a25014f2252b4c2]
- RMPD  [ARIMA Forecasting] [workshop 9] [2008-12-14 15:09:05] [4e6222b6603c6cf58bf3d7a9b1dc61c3]
F   PD      [ARIMA Forecasting] [Forecast Suiker] [2008-12-16 18:07:14] [3fc0b50a130253095e963177b0139835] [Current]
Feedback Forum
2008-12-23 14:47:29 [Anna Hayan] [reply
Stap 1: correct besproken
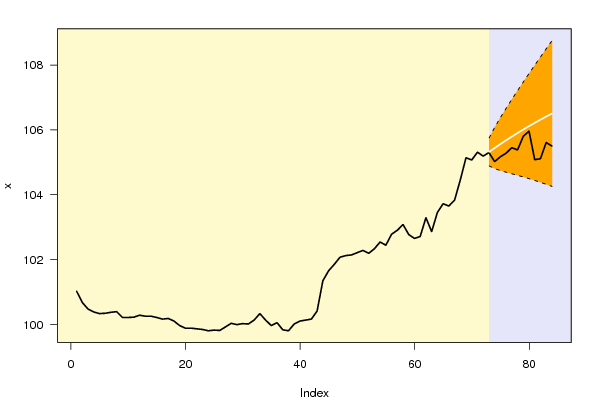
Bij de bovenstaande grafiek worden de laatste 12 maanden grijs gekleurd, omdat het hier gaat over de periode waarvoor we voorspellingen gaan doen, deze periode wordt in stap 2 uitvergroot.
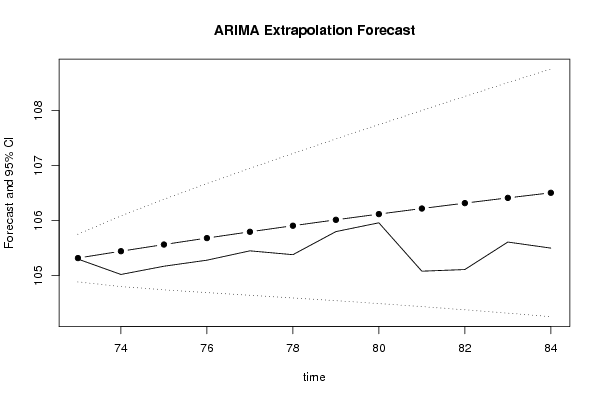
Stap 2:De lijn met de bolletjes stelt de voorspelde waarden voor, de volle lijn de waarden uit de dataset en de stippellijntjes het 95% betrouwbaarheidsinterval. Ik neem hier ook geen enkel patroon waar ook niet echt iets wat op seizoenaliteit wijst.
Stap 3:
je hebt de juiste kolom met de standaardfout aangeduid. We zien inderdaad dat de voorspelbaarheid verslechterd naarmate we verder in de toekomst belanden. Dit is ook logisch dat het moeilijker te voorspellen wordt naarmate we verder in de toekomst zitten.
Stap 4 en 5 vrij goed besproken. Het is wel zeer moeilijk om te concluderen of dit wel een goed model is.

Post a new message
Dataseries X:
101.02
100.67
100.47
100.38
100.33
100.34
100.37
100.39
100.21
100.21
100.22
100.28
100.25
100.25
100.21
100.16
100.18
100.1
99.96
99.88
99.88
99.86
99.84
99.8
99.82
99.81
99.92
100.03
99.99
100.02
100.01
100.13
100.33
100.13
99.96
100.05
99.83
99.8
100.01
100.1
100.13
100.16
100.41
101.34
101.65
101.85
102.07
102.12
102.14
102.21
102.28
102.19
102.33
102.54
102.44
102.78
102.9
103.08
102.77
102.65
102.71
103.29
102.86
103.45
103.72
103.65
103.83
104.45
105.14
105.07
105.31
105.19
105.3
105.02
105.17
105.28
105.45
105.38
105.8
105.96
105.08
105.11
105.61
105.5


Summary of computational transaction
Raw Inputview raw input (R code)
Raw Outputview raw output of R engine
Computing time2 seconds
R Server'George Udny Yule' @ 72.249.76.132

\begin{tabular}{lllllllll}
\hline
Summary of computational transaction \tabularnewline
Raw Input & view raw input (R code)  \tabularnewline
Raw Output & view raw output of R engine  \tabularnewline
Computing time & 2 seconds \tabularnewline
R Server & 'George Udny Yule' @ 72.249.76.132 \tabularnewline
\hline
\end{tabular}
%Source: https://freestatistics.org/blog/index.php?pk=34071&T=0

[TABLE]
[ROW][C]Summary of computational transaction[/C][/ROW]
[ROW][C]Raw Input[/C][C]view raw input (R code) [/C][/ROW]
[ROW][C]Raw Output[/C][C]view raw output of R engine [/C][/ROW]
[ROW][C]Computing time[/C][C]2 seconds[/C][/ROW]
[ROW][C]R Server[/C][C]'George Udny Yule' @ 72.249.76.132[/C][/ROW]
[/TABLE]
Source: https://freestatistics.org/blog/index.php?pk=34071&T=0

Globally Unique Identifier (entire table): ba.freestatistics.org/blog/index.php?pk=34071&T=0

As an alternative you can also use a QR Code:  

The GUIDs for individual cells are displayed in the table below:

Summary of computational transaction
Raw Inputview raw input (R code)
Raw Outputview raw output of R engine
Computing time2 seconds
R Server'George Udny Yule' @ 72.249.76.132


Univariate ARIMA Extrapolation Forecast
timeY[t]F[t]95% LB95% UBp-value(H0: Y[t] = F[t])P(F[t]>Y[t-1])P(F[t]>Y[t-s])P(F[t]>Y[72])
60102.65-------
61102.71-------
62103.29-------
63102.86-------
64103.45-------
65103.72-------
66103.65-------
67103.83-------
68104.45-------
69105.14-------
70105.07-------
71105.31-------
72105.19-------
73105.3105.3186104.8852105.75210.46640.719610.7196
74105.02105.4435104.8008106.08620.09830.669110.7802
75105.17105.5646104.7414106.38790.17370.902610.8138
76105.28105.6822104.6903106.6740.21340.844310.8346
77105.45105.7963104.6418106.95070.27830.80960.99980.8483
78105.38105.907104.5931107.22080.21590.75230.99960.8576
79105.8106.0144104.5429107.48590.38760.80090.99820.8639
80105.96106.1187104.4905107.74690.42430.64940.97770.8682
81105.08106.2198104.4354108.00430.10530.61230.88220.871
82105.11106.318104.3774108.25860.11120.89440.89630.8727
83105.61106.4133104.3165108.510.22640.88840.84880.8736
84105.5106.5057104.2527108.75880.19080.78210.87380.8738

\begin{tabular}{lllllllll}
\hline
Univariate ARIMA Extrapolation Forecast \tabularnewline
time & Y[t] & F[t] & 95% LB & 95% UB & p-value(H0: Y[t] = F[t]) & P(F[t]>Y[t-1]) & P(F[t]>Y[t-s]) & P(F[t]>Y[72]) \tabularnewline
60 & 102.65 & - & - & - & - & - & - & - \tabularnewline
61 & 102.71 & - & - & - & - & - & - & - \tabularnewline
62 & 103.29 & - & - & - & - & - & - & - \tabularnewline
63 & 102.86 & - & - & - & - & - & - & - \tabularnewline
64 & 103.45 & - & - & - & - & - & - & - \tabularnewline
65 & 103.72 & - & - & - & - & - & - & - \tabularnewline
66 & 103.65 & - & - & - & - & - & - & - \tabularnewline
67 & 103.83 & - & - & - & - & - & - & - \tabularnewline
68 & 104.45 & - & - & - & - & - & - & - \tabularnewline
69 & 105.14 & - & - & - & - & - & - & - \tabularnewline
70 & 105.07 & - & - & - & - & - & - & - \tabularnewline
71 & 105.31 & - & - & - & - & - & - & - \tabularnewline
72 & 105.19 & - & - & - & - & - & - & - \tabularnewline
73 & 105.3 & 105.3186 & 104.8852 & 105.7521 & 0.4664 & 0.7196 & 1 & 0.7196 \tabularnewline
74 & 105.02 & 105.4435 & 104.8008 & 106.0862 & 0.0983 & 0.6691 & 1 & 0.7802 \tabularnewline
75 & 105.17 & 105.5646 & 104.7414 & 106.3879 & 0.1737 & 0.9026 & 1 & 0.8138 \tabularnewline
76 & 105.28 & 105.6822 & 104.6903 & 106.674 & 0.2134 & 0.8443 & 1 & 0.8346 \tabularnewline
77 & 105.45 & 105.7963 & 104.6418 & 106.9507 & 0.2783 & 0.8096 & 0.9998 & 0.8483 \tabularnewline
78 & 105.38 & 105.907 & 104.5931 & 107.2208 & 0.2159 & 0.7523 & 0.9996 & 0.8576 \tabularnewline
79 & 105.8 & 106.0144 & 104.5429 & 107.4859 & 0.3876 & 0.8009 & 0.9982 & 0.8639 \tabularnewline
80 & 105.96 & 106.1187 & 104.4905 & 107.7469 & 0.4243 & 0.6494 & 0.9777 & 0.8682 \tabularnewline
81 & 105.08 & 106.2198 & 104.4354 & 108.0043 & 0.1053 & 0.6123 & 0.8822 & 0.871 \tabularnewline
82 & 105.11 & 106.318 & 104.3774 & 108.2586 & 0.1112 & 0.8944 & 0.8963 & 0.8727 \tabularnewline
83 & 105.61 & 106.4133 & 104.3165 & 108.51 & 0.2264 & 0.8884 & 0.8488 & 0.8736 \tabularnewline
84 & 105.5 & 106.5057 & 104.2527 & 108.7588 & 0.1908 & 0.7821 & 0.8738 & 0.8738 \tabularnewline
\hline
\end{tabular}
%Source: https://freestatistics.org/blog/index.php?pk=34071&T=1

[TABLE]
[ROW][C]Univariate ARIMA Extrapolation Forecast[/C][/ROW]
[ROW][C]time[/C][C]Y[t][/C][C]F[t][/C][C]95% LB[/C][C]95% UB[/C][C]p-value(H0: Y[t] = F[t])[/C][C]P(F[t]>Y[t-1])[/C][C]P(F[t]>Y[t-s])[/C][C]P(F[t]>Y[72])[/C][/ROW]
[ROW][C]60[/C][C]102.65[/C][C]-[/C][C]-[/C][C]-[/C][C]-[/C][C]-[/C][C]-[/C][C]-[/C][/ROW]
[ROW][C]61[/C][C]102.71[/C][C]-[/C][C]-[/C][C]-[/C][C]-[/C][C]-[/C][C]-[/C][C]-[/C][/ROW]
[ROW][C]62[/C][C]103.29[/C][C]-[/C][C]-[/C][C]-[/C][C]-[/C][C]-[/C][C]-[/C][C]-[/C][/ROW]
[ROW][C]63[/C][C]102.86[/C][C]-[/C][C]-[/C][C]-[/C][C]-[/C][C]-[/C][C]-[/C][C]-[/C][/ROW]
[ROW][C]64[/C][C]103.45[/C][C]-[/C][C]-[/C][C]-[/C][C]-[/C][C]-[/C][C]-[/C][C]-[/C][/ROW]
[ROW][C]65[/C][C]103.72[/C][C]-[/C][C]-[/C][C]-[/C][C]-[/C][C]-[/C][C]-[/C][C]-[/C][/ROW]
[ROW][C]66[/C][C]103.65[/C][C]-[/C][C]-[/C][C]-[/C][C]-[/C][C]-[/C][C]-[/C][C]-[/C][/ROW]
[ROW][C]67[/C][C]103.83[/C][C]-[/C][C]-[/C][C]-[/C][C]-[/C][C]-[/C][C]-[/C][C]-[/C][/ROW]
[ROW][C]68[/C][C]104.45[/C][C]-[/C][C]-[/C][C]-[/C][C]-[/C][C]-[/C][C]-[/C][C]-[/C][/ROW]
[ROW][C]69[/C][C]105.14[/C][C]-[/C][C]-[/C][C]-[/C][C]-[/C][C]-[/C][C]-[/C][C]-[/C][/ROW]
[ROW][C]70[/C][C]105.07[/C][C]-[/C][C]-[/C][C]-[/C][C]-[/C][C]-[/C][C]-[/C][C]-[/C][/ROW]
[ROW][C]71[/C][C]105.31[/C][C]-[/C][C]-[/C][C]-[/C][C]-[/C][C]-[/C][C]-[/C][C]-[/C][/ROW]
[ROW][C]72[/C][C]105.19[/C][C]-[/C][C]-[/C][C]-[/C][C]-[/C][C]-[/C][C]-[/C][C]-[/C][/ROW]
[ROW][C]73[/C][C]105.3[/C][C]105.3186[/C][C]104.8852[/C][C]105.7521[/C][C]0.4664[/C][C]0.7196[/C][C]1[/C][C]0.7196[/C][/ROW]
[ROW][C]74[/C][C]105.02[/C][C]105.4435[/C][C]104.8008[/C][C]106.0862[/C][C]0.0983[/C][C]0.6691[/C][C]1[/C][C]0.7802[/C][/ROW]
[ROW][C]75[/C][C]105.17[/C][C]105.5646[/C][C]104.7414[/C][C]106.3879[/C][C]0.1737[/C][C]0.9026[/C][C]1[/C][C]0.8138[/C][/ROW]
[ROW][C]76[/C][C]105.28[/C][C]105.6822[/C][C]104.6903[/C][C]106.674[/C][C]0.2134[/C][C]0.8443[/C][C]1[/C][C]0.8346[/C][/ROW]
[ROW][C]77[/C][C]105.45[/C][C]105.7963[/C][C]104.6418[/C][C]106.9507[/C][C]0.2783[/C][C]0.8096[/C][C]0.9998[/C][C]0.8483[/C][/ROW]
[ROW][C]78[/C][C]105.38[/C][C]105.907[/C][C]104.5931[/C][C]107.2208[/C][C]0.2159[/C][C]0.7523[/C][C]0.9996[/C][C]0.8576[/C][/ROW]
[ROW][C]79[/C][C]105.8[/C][C]106.0144[/C][C]104.5429[/C][C]107.4859[/C][C]0.3876[/C][C]0.8009[/C][C]0.9982[/C][C]0.8639[/C][/ROW]
[ROW][C]80[/C][C]105.96[/C][C]106.1187[/C][C]104.4905[/C][C]107.7469[/C][C]0.4243[/C][C]0.6494[/C][C]0.9777[/C][C]0.8682[/C][/ROW]
[ROW][C]81[/C][C]105.08[/C][C]106.2198[/C][C]104.4354[/C][C]108.0043[/C][C]0.1053[/C][C]0.6123[/C][C]0.8822[/C][C]0.871[/C][/ROW]
[ROW][C]82[/C][C]105.11[/C][C]106.318[/C][C]104.3774[/C][C]108.2586[/C][C]0.1112[/C][C]0.8944[/C][C]0.8963[/C][C]0.8727[/C][/ROW]
[ROW][C]83[/C][C]105.61[/C][C]106.4133[/C][C]104.3165[/C][C]108.51[/C][C]0.2264[/C][C]0.8884[/C][C]0.8488[/C][C]0.8736[/C][/ROW]
[ROW][C]84[/C][C]105.5[/C][C]106.5057[/C][C]104.2527[/C][C]108.7588[/C][C]0.1908[/C][C]0.7821[/C][C]0.8738[/C][C]0.8738[/C][/ROW]
[/TABLE]
Source: https://freestatistics.org/blog/index.php?pk=34071&T=1

Globally Unique Identifier (entire table): ba.freestatistics.org/blog/index.php?pk=34071&T=1

As an alternative you can also use a QR Code:  

The GUIDs for individual cells are displayed in the table below:

Univariate ARIMA Extrapolation Forecast
timeY[t]F[t]95% LB95% UBp-value(H0: Y[t] = F[t])P(F[t]>Y[t-1])P(F[t]>Y[t-s])P(F[t]>Y[72])
60102.65-------
61102.71-------
62103.29-------
63102.86-------
64103.45-------
65103.72-------
66103.65-------
67103.83-------
68104.45-------
69105.14-------
70105.07-------
71105.31-------
72105.19-------
73105.3105.3186104.8852105.75210.46640.719610.7196
74105.02105.4435104.8008106.08620.09830.669110.7802
75105.17105.5646104.7414106.38790.17370.902610.8138
76105.28105.6822104.6903106.6740.21340.844310.8346
77105.45105.7963104.6418106.95070.27830.80960.99980.8483
78105.38105.907104.5931107.22080.21590.75230.99960.8576
79105.8106.0144104.5429107.48590.38760.80090.99820.8639
80105.96106.1187104.4905107.74690.42430.64940.97770.8682
81105.08106.2198104.4354108.00430.10530.61230.88220.871
82105.11106.318104.3774108.25860.11120.89440.89630.8727
83105.61106.4133104.3165108.510.22640.88840.84880.8736
84105.5106.5057104.2527108.75880.19080.78210.87380.8738


Univariate ARIMA Extrapolation Forecast Performance
time% S.E.PEMAPESq.EMSERMSE
730.0021-2e-0403e-0400.0054
740.0031-0.0043e-040.17930.01490.1222
750.004-0.00373e-040.15570.0130.1139
760.0048-0.00383e-040.16170.01350.1161
770.0056-0.00333e-040.11990.010.1
780.0063-0.0054e-040.27770.02310.1521
790.0071-0.0022e-040.0460.00380.0619
800.0078-0.00151e-040.02520.00210.0458
810.0086-0.01079e-041.29920.10830.329
820.0093-0.01149e-041.45930.12160.3487
830.0101-0.00756e-040.64530.05380.2319
840.0108-0.00948e-041.01150.08430.2903

\begin{tabular}{lllllllll}
\hline
Univariate ARIMA Extrapolation Forecast Performance \tabularnewline
time & % S.E. & PE & MAPE & Sq.E & MSE & RMSE \tabularnewline
73 & 0.0021 & -2e-04 & 0 & 3e-04 & 0 & 0.0054 \tabularnewline
74 & 0.0031 & -0.004 & 3e-04 & 0.1793 & 0.0149 & 0.1222 \tabularnewline
75 & 0.004 & -0.0037 & 3e-04 & 0.1557 & 0.013 & 0.1139 \tabularnewline
76 & 0.0048 & -0.0038 & 3e-04 & 0.1617 & 0.0135 & 0.1161 \tabularnewline
77 & 0.0056 & -0.0033 & 3e-04 & 0.1199 & 0.01 & 0.1 \tabularnewline
78 & 0.0063 & -0.005 & 4e-04 & 0.2777 & 0.0231 & 0.1521 \tabularnewline
79 & 0.0071 & -0.002 & 2e-04 & 0.046 & 0.0038 & 0.0619 \tabularnewline
80 & 0.0078 & -0.0015 & 1e-04 & 0.0252 & 0.0021 & 0.0458 \tabularnewline
81 & 0.0086 & -0.0107 & 9e-04 & 1.2992 & 0.1083 & 0.329 \tabularnewline
82 & 0.0093 & -0.0114 & 9e-04 & 1.4593 & 0.1216 & 0.3487 \tabularnewline
83 & 0.0101 & -0.0075 & 6e-04 & 0.6453 & 0.0538 & 0.2319 \tabularnewline
84 & 0.0108 & -0.0094 & 8e-04 & 1.0115 & 0.0843 & 0.2903 \tabularnewline
\hline
\end{tabular}
%Source: https://freestatistics.org/blog/index.php?pk=34071&T=2

[TABLE]
[ROW][C]Univariate ARIMA Extrapolation Forecast Performance[/C][/ROW]
[ROW][C]time[/C][C]% S.E.[/C][C]PE[/C][C]MAPE[/C][C]Sq.E[/C][C]MSE[/C][C]RMSE[/C][/ROW]
[ROW][C]73[/C][C]0.0021[/C][C]-2e-04[/C][C]0[/C][C]3e-04[/C][C]0[/C][C]0.0054[/C][/ROW]
[ROW][C]74[/C][C]0.0031[/C][C]-0.004[/C][C]3e-04[/C][C]0.1793[/C][C]0.0149[/C][C]0.1222[/C][/ROW]
[ROW][C]75[/C][C]0.004[/C][C]-0.0037[/C][C]3e-04[/C][C]0.1557[/C][C]0.013[/C][C]0.1139[/C][/ROW]
[ROW][C]76[/C][C]0.0048[/C][C]-0.0038[/C][C]3e-04[/C][C]0.1617[/C][C]0.0135[/C][C]0.1161[/C][/ROW]
[ROW][C]77[/C][C]0.0056[/C][C]-0.0033[/C][C]3e-04[/C][C]0.1199[/C][C]0.01[/C][C]0.1[/C][/ROW]
[ROW][C]78[/C][C]0.0063[/C][C]-0.005[/C][C]4e-04[/C][C]0.2777[/C][C]0.0231[/C][C]0.1521[/C][/ROW]
[ROW][C]79[/C][C]0.0071[/C][C]-0.002[/C][C]2e-04[/C][C]0.046[/C][C]0.0038[/C][C]0.0619[/C][/ROW]
[ROW][C]80[/C][C]0.0078[/C][C]-0.0015[/C][C]1e-04[/C][C]0.0252[/C][C]0.0021[/C][C]0.0458[/C][/ROW]
[ROW][C]81[/C][C]0.0086[/C][C]-0.0107[/C][C]9e-04[/C][C]1.2992[/C][C]0.1083[/C][C]0.329[/C][/ROW]
[ROW][C]82[/C][C]0.0093[/C][C]-0.0114[/C][C]9e-04[/C][C]1.4593[/C][C]0.1216[/C][C]0.3487[/C][/ROW]
[ROW][C]83[/C][C]0.0101[/C][C]-0.0075[/C][C]6e-04[/C][C]0.6453[/C][C]0.0538[/C][C]0.2319[/C][/ROW]
[ROW][C]84[/C][C]0.0108[/C][C]-0.0094[/C][C]8e-04[/C][C]1.0115[/C][C]0.0843[/C][C]0.2903[/C][/ROW]
[/TABLE]
Source: https://freestatistics.org/blog/index.php?pk=34071&T=2

Globally Unique Identifier (entire table): ba.freestatistics.org/blog/index.php?pk=34071&T=2

As an alternative you can also use a QR Code:  

The GUIDs for individual cells are displayed in the table below:

Univariate ARIMA Extrapolation Forecast Performance
time% S.E.PEMAPESq.EMSERMSE
730.0021-2e-0403e-0400.0054
740.0031-0.0043e-040.17930.01490.1222
750.004-0.00373e-040.15570.0130.1139
760.0048-0.00383e-040.16170.01350.1161
770.0056-0.00333e-040.11990.010.1
780.0063-0.0054e-040.27770.02310.1521
790.0071-0.0022e-040.0460.00380.0619
800.0078-0.00151e-040.02520.00210.0458
810.0086-0.01079e-041.29920.10830.329
820.0093-0.01149e-041.45930.12160.3487
830.0101-0.00756e-040.64530.05380.2319
840.0108-0.00948e-041.01150.08430.2903


Parameters (Session):
par1 = 12 ; par2 = 1 ; par3 = 1 ; par4 = 0 ; par5 = 12 ; par6 = 1 ; par7 = 1 ; par8 = 0 ; par9 = 0 ; par10 = FALSE ;
Parameters (R input):
par1 = 12 ; par2 = 1 ; par3 = 1 ; par4 = 0 ; par5 = 12 ; par6 = 1 ; par7 = 1 ; par8 = 0 ; par9 = 0 ; par10 = FALSE ;
R code (references can be found in the software module):
par1 <- as.numeric(par1) #cut off periods
par2 <- as.numeric(par2) #lambda
par3 <- as.numeric(par3) #degree of non-seasonal differencing
par4 <- as.numeric(par4) #degree of seasonal differencing
par5 <- as.numeric(par5) #seasonal period
par6 <- as.numeric(par6) #p
par7 <- as.numeric(par7) #q
par8 <- as.numeric(par8) #P
par9 <- as.numeric(par9) #Q
if (par10 == 'TRUE') par10 <- TRUE
if (par10 == 'FALSE') par10 <- FALSE
if (par2 == 0) x <- log(x)
if (par2 != 0) x <- x^par2
lx <- length(x)
first <- lx - 2*par1
nx <- lx - par1
nx1 <- nx + 1
fx <- lx - nx
if (fx < 1) {
fx <- par5
nx1 <- lx + fx - 1
first <- lx - 2*fx
}
first <- 1
if (fx < 3) fx <- round(lx/10,0)
(arima.out <- arima(x[1:nx], order=c(par6,par3,par7), seasonal=list(order=c(par8,par4,par9), period=par5), include.mean=par10, method='ML'))
(forecast <- predict(arima.out,fx))
(lb <- forecast$pred - 1.96 * forecast$se)
(ub <- forecast$pred + 1.96 * forecast$se)
if (par2 == 0) {
x <- exp(x)
forecast$pred <- exp(forecast$pred)
lb <- exp(lb)
ub <- exp(ub)
}
if (par2 != 0) {
x <- x^(1/par2)
forecast$pred <- forecast$pred^(1/par2)
lb <- lb^(1/par2)
ub <- ub^(1/par2)
}
if (par2 < 0) {
olb <- lb
lb <- ub
ub <- olb
}
(actandfor <- c(x[1:nx], forecast$pred))
(perc.se <- (ub-forecast$pred)/1.96/forecast$pred)
bitmap(file='test1.png')
opar <- par(mar=c(4,4,2,2),las=1)
ylim <- c( min(x[first:nx],lb), max(x[first:nx],ub))
plot(x,ylim=ylim,type='n',xlim=c(first,lx))
usr <- par('usr')
rect(usr[1],usr[3],nx+1,usr[4],border=NA,col='lemonchiffon')
rect(nx1,usr[3],usr[2],usr[4],border=NA,col='lavender')
abline(h= (-3:3)*2 , col ='gray', lty =3)
polygon( c(nx1:lx,lx:nx1), c(lb,rev(ub)), col = 'orange', lty=2,border=NA)
lines(nx1:lx, lb , lty=2)
lines(nx1:lx, ub , lty=2)
lines(x, lwd=2)
lines(nx1:lx, forecast$pred , lwd=2 , col ='white')
box()
par(opar)
dev.off()
prob.dec <- array(NA, dim=fx)
prob.sdec <- array(NA, dim=fx)
prob.ldec <- array(NA, dim=fx)
prob.pval <- array(NA, dim=fx)
perf.pe <- array(0, dim=fx)
perf.mape <- array(0, dim=fx)
perf.se <- array(0, dim=fx)
perf.mse <- array(0, dim=fx)
perf.rmse <- array(0, dim=fx)
for (i in 1:fx) {
locSD <- (ub[i] - forecast$pred[i]) / 1.96
perf.pe[i] = (x[nx+i] - forecast$pred[i]) / forecast$pred[i]
perf.mape[i] = perf.mape[i] + abs(perf.pe[i])
perf.se[i] = (x[nx+i] - forecast$pred[i])^2
perf.mse[i] = perf.mse[i] + perf.se[i]
prob.dec[i] = pnorm((x[nx+i-1] - forecast$pred[i]) / locSD)
prob.sdec[i] = pnorm((x[nx+i-par5] - forecast$pred[i]) / locSD)
prob.ldec[i] = pnorm((x[nx] - forecast$pred[i]) / locSD)
prob.pval[i] = pnorm(abs(x[nx+i] - forecast$pred[i]) / locSD)
}
perf.mape = perf.mape / fx
perf.mse = perf.mse / fx
perf.rmse = sqrt(perf.mse)
bitmap(file='test2.png')
plot(forecast$pred, pch=19, type='b',main='ARIMA Extrapolation Forecast', ylab='Forecast and 95% CI', xlab='time',ylim=c(min(lb),max(ub)))
dum <- forecast$pred
dum[1:12] <- x[(nx+1):lx]
lines(dum, lty=1)
lines(ub,lty=3)
lines(lb,lty=3)
dev.off()
load(file='createtable')
a<-table.start()
a<-table.row.start(a)
a<-table.element(a,'Univariate ARIMA Extrapolation Forecast',9,TRUE)
a<-table.row.end(a)
a<-table.row.start(a)
a<-table.element(a,'time',1,header=TRUE)
a<-table.element(a,'Y[t]',1,header=TRUE)
a<-table.element(a,'F[t]',1,header=TRUE)
a<-table.element(a,'95% LB',1,header=TRUE)
a<-table.element(a,'95% UB',1,header=TRUE)
a<-table.element(a,'p-value
(H0: Y[t] = F[t])',1,header=TRUE)
a<-table.element(a,'P(F[t]>Y[t-1])',1,header=TRUE)
a<-table.element(a,'P(F[t]>Y[t-s])',1,header=TRUE)
mylab <- paste('P(F[t]>Y[',nx,sep='')
mylab <- paste(mylab,'])',sep='')
a<-table.element(a,mylab,1,header=TRUE)
a<-table.row.end(a)
for (i in (nx-par5):nx) {
a<-table.row.start(a)
a<-table.element(a,i,header=TRUE)
a<-table.element(a,x[i])
a<-table.element(a,'-')
a<-table.row.end(a)
}
for (i in 1:fx) {
a<-table.row.start(a)
a<-table.element(a,nx+i,header=TRUE)
a<-table.element(a,round(x[nx+i],4))
a<-table.element(a,round(forecast$pred[i],4))
a<-table.element(a,round(lb[i],4))
a<-table.element(a,round(ub[i],4))
a<-table.element(a,round((1-prob.pval[i]),4))
a<-table.element(a,round((1-prob.dec[i]),4))
a<-table.element(a,round((1-prob.sdec[i]),4))
a<-table.element(a,round((1-prob.ldec[i]),4))
a<-table.row.end(a)
}
a<-table.end(a)
table.save(a,file='mytable.tab')
a<-table.start()
a<-table.row.start(a)
a<-table.element(a,'Univariate ARIMA Extrapolation Forecast Performance',7,TRUE)
a<-table.row.end(a)
a<-table.row.start(a)
a<-table.element(a,'time',1,header=TRUE)
a<-table.element(a,'% S.E.',1,header=TRUE)
a<-table.element(a,'PE',1,header=TRUE)
a<-table.element(a,'MAPE',1,header=TRUE)
a<-table.element(a,'Sq.E',1,header=TRUE)
a<-table.element(a,'MSE',1,header=TRUE)
a<-table.element(a,'RMSE',1,header=TRUE)
a<-table.row.end(a)
for (i in 1:fx) {
a<-table.row.start(a)
a<-table.element(a,nx+i,header=TRUE)
a<-table.element(a,round(perc.se[i],4))
a<-table.element(a,round(perf.pe[i],4))
a<-table.element(a,round(perf.mape[i],4))
a<-table.element(a,round(perf.se[i],4))
a<-table.element(a,round(perf.mse[i],4))
a<-table.element(a,round(perf.rmse[i],4))
a<-table.row.end(a)
}
a<-table.end(a)
table.save(a,file='mytable1.tab')