Free Statistics

of Irreproducible Research!

Author's title

Author*The author of this computation has been verified*
R Software Modulerwasp_autocorrelation.wasp
Title produced by software(Partial) Autocorrelation Function
Date of computationTue, 16 Dec 2008 10:42:25 -0700
Cite this page as followsStatistical Computations at FreeStatistics.org, Office for Research Development and Education, URL https://freestatistics.org/blog/index.php?v=date/2008/Dec/16/t12294495206awmpx37vowh453.htm/, Retrieved Wed, 15 May 2024 16:29:19 +0000
Statistical Computations at FreeStatistics.org, Office for Research Development and Education, URL https://freestatistics.org/blog/index.php?pk=34057, Retrieved Wed, 15 May 2024 16:29:19 +0000
QR Codes:

Original text written by user:
IsPrivate?No (this computation is public)
User-defined keywords
Estimated Impact196
Family? (F = Feedback message, R = changed R code, M = changed R Module, P = changed Parameters, D = changed Data)
-     [Univariate Data Series] [data set] [2008-12-01 19:54:57] [b98453cac15ba1066b407e146608df68]
F RMP   [Standard Deviation-Mean Plot] [Standard Deviatio...] [2008-12-08 13:56:16] [98f6eecc397b06503dbf024e1e936f30]
- RM D    [Variance Reduction Matrix] [Variance Reductio...] [2008-12-15 11:34:27] [98f6eecc397b06503dbf024e1e936f30]
- RMPD        [(Partial) Autocorrelation Function] [(partial) autocor...] [2008-12-16 17:42:25] [52d1f7c78552cd0e785e1b7a3cade101] [Current]
Feedback Forum

Post a new message
Dataseries X:
87
96.3
107.1
115.2
106.1
89.5
91.3
97.6
100.7
104.6
94.7
101.8
102.5
105.3
110.3
109.8
117.3
118.8
131.3
125.9
133.1
147
145.8
164.4
149.8
137.7
151.7
156.8
180
180.4
170.4
191.6
199.5
218.2
217.5
205
194
199.3
219.3
211.1
215.2
240.2
242.2
240.7
255.4
253
218.2
203.7
205.6
215.6


Summary of computational transaction
Raw Inputview raw input (R code)
Raw Outputview raw output of R engine
Computing time2 seconds
R Server'Sir Ronald Aylmer Fisher' @ 193.190.124.24

\begin{tabular}{lllllllll}
\hline
Summary of computational transaction \tabularnewline
Raw Input & view raw input (R code)  \tabularnewline
Raw Output & view raw output of R engine  \tabularnewline
Computing time & 2 seconds \tabularnewline
R Server & 'Sir Ronald Aylmer Fisher' @ 193.190.124.24 \tabularnewline
\hline
\end{tabular}
%Source: https://freestatistics.org/blog/index.php?pk=34057&T=0

[TABLE]
[ROW][C]Summary of computational transaction[/C][/ROW]
[ROW][C]Raw Input[/C][C]view raw input (R code) [/C][/ROW]
[ROW][C]Raw Output[/C][C]view raw output of R engine [/C][/ROW]
[ROW][C]Computing time[/C][C]2 seconds[/C][/ROW]
[ROW][C]R Server[/C][C]'Sir Ronald Aylmer Fisher' @ 193.190.124.24[/C][/ROW]
[/TABLE]
Source: https://freestatistics.org/blog/index.php?pk=34057&T=0

Globally Unique Identifier (entire table): ba.freestatistics.org/blog/index.php?pk=34057&T=0

As an alternative you can also use a QR Code:  

The GUIDs for individual cells are displayed in the table below:

Summary of computational transaction
Raw Inputview raw input (R code)
Raw Outputview raw output of R engine
Computing time2 seconds
R Server'Sir Ronald Aylmer Fisher' @ 193.190.124.24


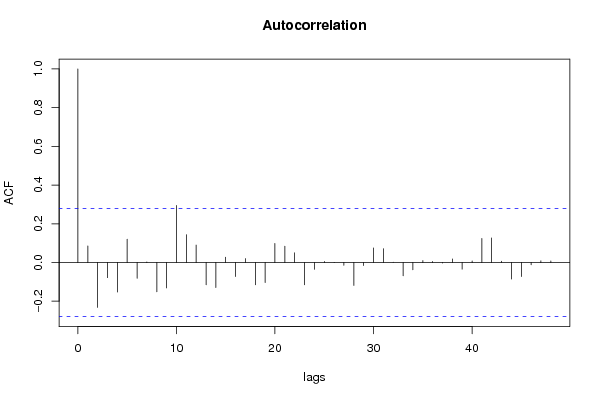
Autocorrelation Function
Time lag kACF(k)T-STATP-value
10.0851270.59590.276996
2-0.232085-1.62460.055332
3-0.078582-0.55010.292383
4-0.152467-1.06730.145541
50.1196850.83780.203107
6-0.081473-0.57030.285537
70.0020880.01460.494199
8-0.151776-1.06240.146625
9-0.131553-0.92090.180816
100.2946642.06260.022234
110.143151.00210.160621
120.0899060.62930.266025
13-0.115357-0.80750.21164
14-0.129435-0.9060.184673
150.0266370.18650.426427
16-0.073123-0.51190.305524
170.0199240.13950.444826
18-0.114892-0.80420.212571
19-0.103875-0.72710.235305
200.0977440.68420.248534
210.0843420.59040.27882
220.0495920.34710.364984
23-0.115378-0.80760.211599
24-0.034986-0.24490.403778
250.0053120.03720.485244
26-0.000658-0.00460.498173
27-0.014564-0.10190.459608
28-0.118418-0.82890.205582
29-0.015509-0.10860.456995
300.0750770.52550.30079
310.070680.49480.311491
32-0.000185-0.00130.499485
33-0.068725-0.48110.316302
34-0.037333-0.26130.397467
350.0095230.06670.473561
360.0049280.03450.486312
37-0.003028-0.02120.491587
380.0185590.12990.448583
39-0.034608-0.24230.404797
400.0081010.05670.477504
410.1240090.86810.194797
420.1266960.88690.189739
430.0065260.04570.481874
44-0.085518-0.59860.27609
45-0.072492-0.50740.307059
46-0.012053-0.08440.466552
470.0083720.05860.476754
480.0074320.0520.479362

\begin{tabular}{lllllllll}
\hline
Autocorrelation Function \tabularnewline
Time lag k & ACF(k) & T-STAT & P-value \tabularnewline
1 & 0.085127 & 0.5959 & 0.276996 \tabularnewline
2 & -0.232085 & -1.6246 & 0.055332 \tabularnewline
3 & -0.078582 & -0.5501 & 0.292383 \tabularnewline
4 & -0.152467 & -1.0673 & 0.145541 \tabularnewline
5 & 0.119685 & 0.8378 & 0.203107 \tabularnewline
6 & -0.081473 & -0.5703 & 0.285537 \tabularnewline
7 & 0.002088 & 0.0146 & 0.494199 \tabularnewline
8 & -0.151776 & -1.0624 & 0.146625 \tabularnewline
9 & -0.131553 & -0.9209 & 0.180816 \tabularnewline
10 & 0.294664 & 2.0626 & 0.022234 \tabularnewline
11 & 0.14315 & 1.0021 & 0.160621 \tabularnewline
12 & 0.089906 & 0.6293 & 0.266025 \tabularnewline
13 & -0.115357 & -0.8075 & 0.21164 \tabularnewline
14 & -0.129435 & -0.906 & 0.184673 \tabularnewline
15 & 0.026637 & 0.1865 & 0.426427 \tabularnewline
16 & -0.073123 & -0.5119 & 0.305524 \tabularnewline
17 & 0.019924 & 0.1395 & 0.444826 \tabularnewline
18 & -0.114892 & -0.8042 & 0.212571 \tabularnewline
19 & -0.103875 & -0.7271 & 0.235305 \tabularnewline
20 & 0.097744 & 0.6842 & 0.248534 \tabularnewline
21 & 0.084342 & 0.5904 & 0.27882 \tabularnewline
22 & 0.049592 & 0.3471 & 0.364984 \tabularnewline
23 & -0.115378 & -0.8076 & 0.211599 \tabularnewline
24 & -0.034986 & -0.2449 & 0.403778 \tabularnewline
25 & 0.005312 & 0.0372 & 0.485244 \tabularnewline
26 & -0.000658 & -0.0046 & 0.498173 \tabularnewline
27 & -0.014564 & -0.1019 & 0.459608 \tabularnewline
28 & -0.118418 & -0.8289 & 0.205582 \tabularnewline
29 & -0.015509 & -0.1086 & 0.456995 \tabularnewline
30 & 0.075077 & 0.5255 & 0.30079 \tabularnewline
31 & 0.07068 & 0.4948 & 0.311491 \tabularnewline
32 & -0.000185 & -0.0013 & 0.499485 \tabularnewline
33 & -0.068725 & -0.4811 & 0.316302 \tabularnewline
34 & -0.037333 & -0.2613 & 0.397467 \tabularnewline
35 & 0.009523 & 0.0667 & 0.473561 \tabularnewline
36 & 0.004928 & 0.0345 & 0.486312 \tabularnewline
37 & -0.003028 & -0.0212 & 0.491587 \tabularnewline
38 & 0.018559 & 0.1299 & 0.448583 \tabularnewline
39 & -0.034608 & -0.2423 & 0.404797 \tabularnewline
40 & 0.008101 & 0.0567 & 0.477504 \tabularnewline
41 & 0.124009 & 0.8681 & 0.194797 \tabularnewline
42 & 0.126696 & 0.8869 & 0.189739 \tabularnewline
43 & 0.006526 & 0.0457 & 0.481874 \tabularnewline
44 & -0.085518 & -0.5986 & 0.27609 \tabularnewline
45 & -0.072492 & -0.5074 & 0.307059 \tabularnewline
46 & -0.012053 & -0.0844 & 0.466552 \tabularnewline
47 & 0.008372 & 0.0586 & 0.476754 \tabularnewline
48 & 0.007432 & 0.052 & 0.479362 \tabularnewline
\hline
\end{tabular}
%Source: https://freestatistics.org/blog/index.php?pk=34057&T=1

[TABLE]
[ROW][C]Autocorrelation Function[/C][/ROW]
[ROW][C]Time lag k[/C][C]ACF(k)[/C][C]T-STAT[/C][C]P-value[/C][/ROW]
[ROW][C]1[/C][C]0.085127[/C][C]0.5959[/C][C]0.276996[/C][/ROW]
[ROW][C]2[/C][C]-0.232085[/C][C]-1.6246[/C][C]0.055332[/C][/ROW]
[ROW][C]3[/C][C]-0.078582[/C][C]-0.5501[/C][C]0.292383[/C][/ROW]
[ROW][C]4[/C][C]-0.152467[/C][C]-1.0673[/C][C]0.145541[/C][/ROW]
[ROW][C]5[/C][C]0.119685[/C][C]0.8378[/C][C]0.203107[/C][/ROW]
[ROW][C]6[/C][C]-0.081473[/C][C]-0.5703[/C][C]0.285537[/C][/ROW]
[ROW][C]7[/C][C]0.002088[/C][C]0.0146[/C][C]0.494199[/C][/ROW]
[ROW][C]8[/C][C]-0.151776[/C][C]-1.0624[/C][C]0.146625[/C][/ROW]
[ROW][C]9[/C][C]-0.131553[/C][C]-0.9209[/C][C]0.180816[/C][/ROW]
[ROW][C]10[/C][C]0.294664[/C][C]2.0626[/C][C]0.022234[/C][/ROW]
[ROW][C]11[/C][C]0.14315[/C][C]1.0021[/C][C]0.160621[/C][/ROW]
[ROW][C]12[/C][C]0.089906[/C][C]0.6293[/C][C]0.266025[/C][/ROW]
[ROW][C]13[/C][C]-0.115357[/C][C]-0.8075[/C][C]0.21164[/C][/ROW]
[ROW][C]14[/C][C]-0.129435[/C][C]-0.906[/C][C]0.184673[/C][/ROW]
[ROW][C]15[/C][C]0.026637[/C][C]0.1865[/C][C]0.426427[/C][/ROW]
[ROW][C]16[/C][C]-0.073123[/C][C]-0.5119[/C][C]0.305524[/C][/ROW]
[ROW][C]17[/C][C]0.019924[/C][C]0.1395[/C][C]0.444826[/C][/ROW]
[ROW][C]18[/C][C]-0.114892[/C][C]-0.8042[/C][C]0.212571[/C][/ROW]
[ROW][C]19[/C][C]-0.103875[/C][C]-0.7271[/C][C]0.235305[/C][/ROW]
[ROW][C]20[/C][C]0.097744[/C][C]0.6842[/C][C]0.248534[/C][/ROW]
[ROW][C]21[/C][C]0.084342[/C][C]0.5904[/C][C]0.27882[/C][/ROW]
[ROW][C]22[/C][C]0.049592[/C][C]0.3471[/C][C]0.364984[/C][/ROW]
[ROW][C]23[/C][C]-0.115378[/C][C]-0.8076[/C][C]0.211599[/C][/ROW]
[ROW][C]24[/C][C]-0.034986[/C][C]-0.2449[/C][C]0.403778[/C][/ROW]
[ROW][C]25[/C][C]0.005312[/C][C]0.0372[/C][C]0.485244[/C][/ROW]
[ROW][C]26[/C][C]-0.000658[/C][C]-0.0046[/C][C]0.498173[/C][/ROW]
[ROW][C]27[/C][C]-0.014564[/C][C]-0.1019[/C][C]0.459608[/C][/ROW]
[ROW][C]28[/C][C]-0.118418[/C][C]-0.8289[/C][C]0.205582[/C][/ROW]
[ROW][C]29[/C][C]-0.015509[/C][C]-0.1086[/C][C]0.456995[/C][/ROW]
[ROW][C]30[/C][C]0.075077[/C][C]0.5255[/C][C]0.30079[/C][/ROW]
[ROW][C]31[/C][C]0.07068[/C][C]0.4948[/C][C]0.311491[/C][/ROW]
[ROW][C]32[/C][C]-0.000185[/C][C]-0.0013[/C][C]0.499485[/C][/ROW]
[ROW][C]33[/C][C]-0.068725[/C][C]-0.4811[/C][C]0.316302[/C][/ROW]
[ROW][C]34[/C][C]-0.037333[/C][C]-0.2613[/C][C]0.397467[/C][/ROW]
[ROW][C]35[/C][C]0.009523[/C][C]0.0667[/C][C]0.473561[/C][/ROW]
[ROW][C]36[/C][C]0.004928[/C][C]0.0345[/C][C]0.486312[/C][/ROW]
[ROW][C]37[/C][C]-0.003028[/C][C]-0.0212[/C][C]0.491587[/C][/ROW]
[ROW][C]38[/C][C]0.018559[/C][C]0.1299[/C][C]0.448583[/C][/ROW]
[ROW][C]39[/C][C]-0.034608[/C][C]-0.2423[/C][C]0.404797[/C][/ROW]
[ROW][C]40[/C][C]0.008101[/C][C]0.0567[/C][C]0.477504[/C][/ROW]
[ROW][C]41[/C][C]0.124009[/C][C]0.8681[/C][C]0.194797[/C][/ROW]
[ROW][C]42[/C][C]0.126696[/C][C]0.8869[/C][C]0.189739[/C][/ROW]
[ROW][C]43[/C][C]0.006526[/C][C]0.0457[/C][C]0.481874[/C][/ROW]
[ROW][C]44[/C][C]-0.085518[/C][C]-0.5986[/C][C]0.27609[/C][/ROW]
[ROW][C]45[/C][C]-0.072492[/C][C]-0.5074[/C][C]0.307059[/C][/ROW]
[ROW][C]46[/C][C]-0.012053[/C][C]-0.0844[/C][C]0.466552[/C][/ROW]
[ROW][C]47[/C][C]0.008372[/C][C]0.0586[/C][C]0.476754[/C][/ROW]
[ROW][C]48[/C][C]0.007432[/C][C]0.052[/C][C]0.479362[/C][/ROW]
[/TABLE]
Source: https://freestatistics.org/blog/index.php?pk=34057&T=1

Globally Unique Identifier (entire table): ba.freestatistics.org/blog/index.php?pk=34057&T=1

As an alternative you can also use a QR Code:  

The GUIDs for individual cells are displayed in the table below:

Autocorrelation Function
Time lag kACF(k)T-STATP-value
10.0851270.59590.276996
2-0.232085-1.62460.055332
3-0.078582-0.55010.292383
4-0.152467-1.06730.145541
50.1196850.83780.203107
6-0.081473-0.57030.285537
70.0020880.01460.494199
8-0.151776-1.06240.146625
9-0.131553-0.92090.180816
100.2946642.06260.022234
110.143151.00210.160621
120.0899060.62930.266025
13-0.115357-0.80750.21164
14-0.129435-0.9060.184673
150.0266370.18650.426427
16-0.073123-0.51190.305524
170.0199240.13950.444826
18-0.114892-0.80420.212571
19-0.103875-0.72710.235305
200.0977440.68420.248534
210.0843420.59040.27882
220.0495920.34710.364984
23-0.115378-0.80760.211599
24-0.034986-0.24490.403778
250.0053120.03720.485244
26-0.000658-0.00460.498173
27-0.014564-0.10190.459608
28-0.118418-0.82890.205582
29-0.015509-0.10860.456995
300.0750770.52550.30079
310.070680.49480.311491
32-0.000185-0.00130.499485
33-0.068725-0.48110.316302
34-0.037333-0.26130.397467
350.0095230.06670.473561
360.0049280.03450.486312
37-0.003028-0.02120.491587
380.0185590.12990.448583
39-0.034608-0.24230.404797
400.0081010.05670.477504
410.1240090.86810.194797
420.1266960.88690.189739
430.0065260.04570.481874
44-0.085518-0.59860.27609
45-0.072492-0.50740.307059
46-0.012053-0.08440.466552
470.0083720.05860.476754
480.0074320.0520.479362


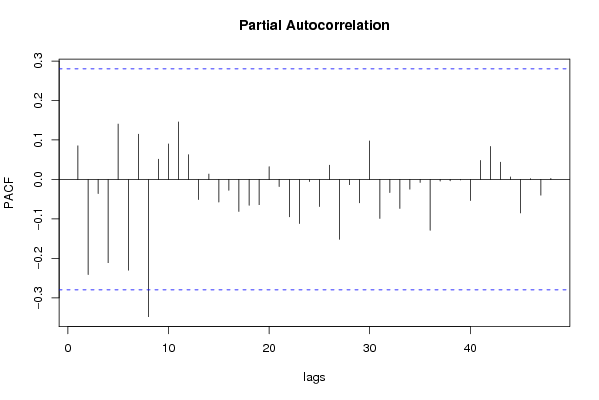
Partial Autocorrelation Function
Time lag kPACF(k)T-STATP-value
10.0851270.59590.276996
2-0.241079-1.68760.048927
3-0.03587-0.25110.401398
4-0.210806-1.47560.073218
50.1402030.98140.165603
6-0.229772-1.60840.057086
70.1147490.80320.212857
8-0.347617-2.43330.009328
90.0511680.35820.360876
100.0900220.63020.265762
110.1454131.01790.156865
120.0624810.43740.331883
13-0.050679-0.35480.362149
140.0135390.09480.462442
15-0.057376-0.40160.34485
16-0.027492-0.19240.424095
17-0.08093-0.56650.286816
18-0.065589-0.45910.324088
19-0.063904-0.44730.328306
200.0324190.22690.410709
21-0.018066-0.12650.449943
22-0.094733-0.66310.255177
23-0.111819-0.78270.218776
24-0.005045-0.03530.485986
25-0.068525-0.47970.316796
260.0359310.25150.401233
27-0.151678-1.06170.146777
28-0.013106-0.09170.463639
29-0.059086-0.41360.340485
300.0974650.68230.249144
31-0.098753-0.69130.24633
32-0.033096-0.23170.408879
33-0.073402-0.51380.304847
34-0.024627-0.17240.431922
35-0.007509-0.05260.479147
36-0.128802-0.90160.185836
37-0.004221-0.02950.488275
38-0.003214-0.02250.491071
39-0.00121-0.00850.496638
40-0.053501-0.37450.354822
410.0480540.33640.369011
420.0836330.58540.280471
430.0434770.30430.381078
440.00650.04550.481948
45-0.084678-0.59270.278038
460.0018630.0130.494825
47-0.039785-0.27850.390903
480.002640.01850.492665

\begin{tabular}{lllllllll}
\hline
Partial Autocorrelation Function \tabularnewline
Time lag k & PACF(k) & T-STAT & P-value \tabularnewline
1 & 0.085127 & 0.5959 & 0.276996 \tabularnewline
2 & -0.241079 & -1.6876 & 0.048927 \tabularnewline
3 & -0.03587 & -0.2511 & 0.401398 \tabularnewline
4 & -0.210806 & -1.4756 & 0.073218 \tabularnewline
5 & 0.140203 & 0.9814 & 0.165603 \tabularnewline
6 & -0.229772 & -1.6084 & 0.057086 \tabularnewline
7 & 0.114749 & 0.8032 & 0.212857 \tabularnewline
8 & -0.347617 & -2.4333 & 0.009328 \tabularnewline
9 & 0.051168 & 0.3582 & 0.360876 \tabularnewline
10 & 0.090022 & 0.6302 & 0.265762 \tabularnewline
11 & 0.145413 & 1.0179 & 0.156865 \tabularnewline
12 & 0.062481 & 0.4374 & 0.331883 \tabularnewline
13 & -0.050679 & -0.3548 & 0.362149 \tabularnewline
14 & 0.013539 & 0.0948 & 0.462442 \tabularnewline
15 & -0.057376 & -0.4016 & 0.34485 \tabularnewline
16 & -0.027492 & -0.1924 & 0.424095 \tabularnewline
17 & -0.08093 & -0.5665 & 0.286816 \tabularnewline
18 & -0.065589 & -0.4591 & 0.324088 \tabularnewline
19 & -0.063904 & -0.4473 & 0.328306 \tabularnewline
20 & 0.032419 & 0.2269 & 0.410709 \tabularnewline
21 & -0.018066 & -0.1265 & 0.449943 \tabularnewline
22 & -0.094733 & -0.6631 & 0.255177 \tabularnewline
23 & -0.111819 & -0.7827 & 0.218776 \tabularnewline
24 & -0.005045 & -0.0353 & 0.485986 \tabularnewline
25 & -0.068525 & -0.4797 & 0.316796 \tabularnewline
26 & 0.035931 & 0.2515 & 0.401233 \tabularnewline
27 & -0.151678 & -1.0617 & 0.146777 \tabularnewline
28 & -0.013106 & -0.0917 & 0.463639 \tabularnewline
29 & -0.059086 & -0.4136 & 0.340485 \tabularnewline
30 & 0.097465 & 0.6823 & 0.249144 \tabularnewline
31 & -0.098753 & -0.6913 & 0.24633 \tabularnewline
32 & -0.033096 & -0.2317 & 0.408879 \tabularnewline
33 & -0.073402 & -0.5138 & 0.304847 \tabularnewline
34 & -0.024627 & -0.1724 & 0.431922 \tabularnewline
35 & -0.007509 & -0.0526 & 0.479147 \tabularnewline
36 & -0.128802 & -0.9016 & 0.185836 \tabularnewline
37 & -0.004221 & -0.0295 & 0.488275 \tabularnewline
38 & -0.003214 & -0.0225 & 0.491071 \tabularnewline
39 & -0.00121 & -0.0085 & 0.496638 \tabularnewline
40 & -0.053501 & -0.3745 & 0.354822 \tabularnewline
41 & 0.048054 & 0.3364 & 0.369011 \tabularnewline
42 & 0.083633 & 0.5854 & 0.280471 \tabularnewline
43 & 0.043477 & 0.3043 & 0.381078 \tabularnewline
44 & 0.0065 & 0.0455 & 0.481948 \tabularnewline
45 & -0.084678 & -0.5927 & 0.278038 \tabularnewline
46 & 0.001863 & 0.013 & 0.494825 \tabularnewline
47 & -0.039785 & -0.2785 & 0.390903 \tabularnewline
48 & 0.00264 & 0.0185 & 0.492665 \tabularnewline
\hline
\end{tabular}
%Source: https://freestatistics.org/blog/index.php?pk=34057&T=2

[TABLE]
[ROW][C]Partial Autocorrelation Function[/C][/ROW]
[ROW][C]Time lag k[/C][C]PACF(k)[/C][C]T-STAT[/C][C]P-value[/C][/ROW]
[ROW][C]1[/C][C]0.085127[/C][C]0.5959[/C][C]0.276996[/C][/ROW]
[ROW][C]2[/C][C]-0.241079[/C][C]-1.6876[/C][C]0.048927[/C][/ROW]
[ROW][C]3[/C][C]-0.03587[/C][C]-0.2511[/C][C]0.401398[/C][/ROW]
[ROW][C]4[/C][C]-0.210806[/C][C]-1.4756[/C][C]0.073218[/C][/ROW]
[ROW][C]5[/C][C]0.140203[/C][C]0.9814[/C][C]0.165603[/C][/ROW]
[ROW][C]6[/C][C]-0.229772[/C][C]-1.6084[/C][C]0.057086[/C][/ROW]
[ROW][C]7[/C][C]0.114749[/C][C]0.8032[/C][C]0.212857[/C][/ROW]
[ROW][C]8[/C][C]-0.347617[/C][C]-2.4333[/C][C]0.009328[/C][/ROW]
[ROW][C]9[/C][C]0.051168[/C][C]0.3582[/C][C]0.360876[/C][/ROW]
[ROW][C]10[/C][C]0.090022[/C][C]0.6302[/C][C]0.265762[/C][/ROW]
[ROW][C]11[/C][C]0.145413[/C][C]1.0179[/C][C]0.156865[/C][/ROW]
[ROW][C]12[/C][C]0.062481[/C][C]0.4374[/C][C]0.331883[/C][/ROW]
[ROW][C]13[/C][C]-0.050679[/C][C]-0.3548[/C][C]0.362149[/C][/ROW]
[ROW][C]14[/C][C]0.013539[/C][C]0.0948[/C][C]0.462442[/C][/ROW]
[ROW][C]15[/C][C]-0.057376[/C][C]-0.4016[/C][C]0.34485[/C][/ROW]
[ROW][C]16[/C][C]-0.027492[/C][C]-0.1924[/C][C]0.424095[/C][/ROW]
[ROW][C]17[/C][C]-0.08093[/C][C]-0.5665[/C][C]0.286816[/C][/ROW]
[ROW][C]18[/C][C]-0.065589[/C][C]-0.4591[/C][C]0.324088[/C][/ROW]
[ROW][C]19[/C][C]-0.063904[/C][C]-0.4473[/C][C]0.328306[/C][/ROW]
[ROW][C]20[/C][C]0.032419[/C][C]0.2269[/C][C]0.410709[/C][/ROW]
[ROW][C]21[/C][C]-0.018066[/C][C]-0.1265[/C][C]0.449943[/C][/ROW]
[ROW][C]22[/C][C]-0.094733[/C][C]-0.6631[/C][C]0.255177[/C][/ROW]
[ROW][C]23[/C][C]-0.111819[/C][C]-0.7827[/C][C]0.218776[/C][/ROW]
[ROW][C]24[/C][C]-0.005045[/C][C]-0.0353[/C][C]0.485986[/C][/ROW]
[ROW][C]25[/C][C]-0.068525[/C][C]-0.4797[/C][C]0.316796[/C][/ROW]
[ROW][C]26[/C][C]0.035931[/C][C]0.2515[/C][C]0.401233[/C][/ROW]
[ROW][C]27[/C][C]-0.151678[/C][C]-1.0617[/C][C]0.146777[/C][/ROW]
[ROW][C]28[/C][C]-0.013106[/C][C]-0.0917[/C][C]0.463639[/C][/ROW]
[ROW][C]29[/C][C]-0.059086[/C][C]-0.4136[/C][C]0.340485[/C][/ROW]
[ROW][C]30[/C][C]0.097465[/C][C]0.6823[/C][C]0.249144[/C][/ROW]
[ROW][C]31[/C][C]-0.098753[/C][C]-0.6913[/C][C]0.24633[/C][/ROW]
[ROW][C]32[/C][C]-0.033096[/C][C]-0.2317[/C][C]0.408879[/C][/ROW]
[ROW][C]33[/C][C]-0.073402[/C][C]-0.5138[/C][C]0.304847[/C][/ROW]
[ROW][C]34[/C][C]-0.024627[/C][C]-0.1724[/C][C]0.431922[/C][/ROW]
[ROW][C]35[/C][C]-0.007509[/C][C]-0.0526[/C][C]0.479147[/C][/ROW]
[ROW][C]36[/C][C]-0.128802[/C][C]-0.9016[/C][C]0.185836[/C][/ROW]
[ROW][C]37[/C][C]-0.004221[/C][C]-0.0295[/C][C]0.488275[/C][/ROW]
[ROW][C]38[/C][C]-0.003214[/C][C]-0.0225[/C][C]0.491071[/C][/ROW]
[ROW][C]39[/C][C]-0.00121[/C][C]-0.0085[/C][C]0.496638[/C][/ROW]
[ROW][C]40[/C][C]-0.053501[/C][C]-0.3745[/C][C]0.354822[/C][/ROW]
[ROW][C]41[/C][C]0.048054[/C][C]0.3364[/C][C]0.369011[/C][/ROW]
[ROW][C]42[/C][C]0.083633[/C][C]0.5854[/C][C]0.280471[/C][/ROW]
[ROW][C]43[/C][C]0.043477[/C][C]0.3043[/C][C]0.381078[/C][/ROW]
[ROW][C]44[/C][C]0.0065[/C][C]0.0455[/C][C]0.481948[/C][/ROW]
[ROW][C]45[/C][C]-0.084678[/C][C]-0.5927[/C][C]0.278038[/C][/ROW]
[ROW][C]46[/C][C]0.001863[/C][C]0.013[/C][C]0.494825[/C][/ROW]
[ROW][C]47[/C][C]-0.039785[/C][C]-0.2785[/C][C]0.390903[/C][/ROW]
[ROW][C]48[/C][C]0.00264[/C][C]0.0185[/C][C]0.492665[/C][/ROW]
[/TABLE]
Source: https://freestatistics.org/blog/index.php?pk=34057&T=2

Globally Unique Identifier (entire table): ba.freestatistics.org/blog/index.php?pk=34057&T=2

As an alternative you can also use a QR Code:  

The GUIDs for individual cells are displayed in the table below:

Partial Autocorrelation Function
Time lag kPACF(k)T-STATP-value
10.0851270.59590.276996
2-0.241079-1.68760.048927
3-0.03587-0.25110.401398
4-0.210806-1.47560.073218
50.1402030.98140.165603
6-0.229772-1.60840.057086
70.1147490.80320.212857
8-0.347617-2.43330.009328
90.0511680.35820.360876
100.0900220.63020.265762
110.1454131.01790.156865
120.0624810.43740.331883
13-0.050679-0.35480.362149
140.0135390.09480.462442
15-0.057376-0.40160.34485
16-0.027492-0.19240.424095
17-0.08093-0.56650.286816
18-0.065589-0.45910.324088
19-0.063904-0.44730.328306
200.0324190.22690.410709
21-0.018066-0.12650.449943
22-0.094733-0.66310.255177
23-0.111819-0.78270.218776
24-0.005045-0.03530.485986
25-0.068525-0.47970.316796
260.0359310.25150.401233
27-0.151678-1.06170.146777
28-0.013106-0.09170.463639
29-0.059086-0.41360.340485
300.0974650.68230.249144
31-0.098753-0.69130.24633
32-0.033096-0.23170.408879
33-0.073402-0.51380.304847
34-0.024627-0.17240.431922
35-0.007509-0.05260.479147
36-0.128802-0.90160.185836
37-0.004221-0.02950.488275
38-0.003214-0.02250.491071
39-0.00121-0.00850.496638
40-0.053501-0.37450.354822
410.0480540.33640.369011
420.0836330.58540.280471
430.0434770.30430.381078
440.00650.04550.481948
45-0.084678-0.59270.278038
460.0018630.0130.494825
47-0.039785-0.27850.390903
480.002640.01850.492665


Parameters (Session):
par1 = 48 ; par2 = 1 ; par3 = 1 ; par4 = 0 ; par5 = 12 ;
Parameters (R input):
par1 = 48 ; par2 = 1 ; par3 = 1 ; par4 = 0 ; par5 = 12 ;
R code (references can be found in the software module):
if (par1 == 'Default') {
par1 = 10*log10(length(x))
} else {
par1 <- as.numeric(par1)
}
par2 <- as.numeric(par2)
par3 <- as.numeric(par3)
par4 <- as.numeric(par4)
par5 <- as.numeric(par5)
if (par2 == 0) {
x <- log(x)
} else {
x <- (x ^ par2 - 1) / par2
}
if (par3 > 0) x <- diff(x,lag=1,difference=par3)
if (par4 > 0) x <- diff(x,lag=par5,difference=par4)
bitmap(file='pic1.png')
racf <- acf(x,par1,main='Autocorrelation',xlab='lags',ylab='ACF')
dev.off()
bitmap(file='pic2.png')
rpacf <- pacf(x,par1,main='Partial Autocorrelation',xlab='lags',ylab='PACF')
dev.off()
(myacf <- c(racf$acf))
(mypacf <- c(rpacf$acf))
lengthx <- length(x)
sqrtn <- sqrt(lengthx)
load(file='createtable')
a<-table.start()
a<-table.row.start(a)
a<-table.element(a,'Autocorrelation Function',4,TRUE)
a<-table.row.end(a)
a<-table.row.start(a)
a<-table.element(a,'Time lag k',header=TRUE)
a<-table.element(a,hyperlink('basics.htm','ACF(k)','click here for more information about the Autocorrelation Function'),header=TRUE)
a<-table.element(a,'T-STAT',header=TRUE)
a<-table.element(a,'P-value',header=TRUE)
a<-table.row.end(a)
for (i in 2:(par1+1)) {
a<-table.row.start(a)
a<-table.element(a,i-1,header=TRUE)
a<-table.element(a,round(myacf[i],6))
mytstat <- myacf[i]*sqrtn
a<-table.element(a,round(mytstat,4))
a<-table.element(a,round(1-pt(abs(mytstat),lengthx),6))
a<-table.row.end(a)
}
a<-table.end(a)
table.save(a,file='mytable.tab')
a<-table.start()
a<-table.row.start(a)
a<-table.element(a,'Partial Autocorrelation Function',4,TRUE)
a<-table.row.end(a)
a<-table.row.start(a)
a<-table.element(a,'Time lag k',header=TRUE)
a<-table.element(a,hyperlink('basics.htm','PACF(k)','click here for more information about the Partial Autocorrelation Function'),header=TRUE)
a<-table.element(a,'T-STAT',header=TRUE)
a<-table.element(a,'P-value',header=TRUE)
a<-table.row.end(a)
for (i in 1:par1) {
a<-table.row.start(a)
a<-table.element(a,i,header=TRUE)
a<-table.element(a,round(mypacf[i],6))
mytstat <- mypacf[i]*sqrtn
a<-table.element(a,round(mytstat,4))
a<-table.element(a,round(1-pt(abs(mytstat),lengthx),6))
a<-table.row.end(a)
}
a<-table.end(a)
table.save(a,file='mytable1.tab')