Free Statistics

of Irreproducible Research!

Author's title

Author*The author of this computation has been verified*
R Software Modulerwasp_centraltendency.wasp
Title produced by softwareCentral Tendency
Date of computationTue, 16 Dec 2008 09:49:56 -0700
Cite this page as followsStatistical Computations at FreeStatistics.org, Office for Research Development and Education, URL https://freestatistics.org/blog/index.php?v=date/2008/Dec/16/t1229446236hd3j3sg09ihlvnr.htm/, Retrieved Thu, 16 May 2024 03:05:03 +0000
Statistical Computations at FreeStatistics.org, Office for Research Development and Education, URL https://freestatistics.org/blog/index.php?pk=34033, Retrieved Thu, 16 May 2024 03:05:03 +0000
QR Codes:

Original text written by user:
IsPrivate?No (this computation is public)
User-defined keywords
Estimated Impact205
Family? (F = Feedback message, R = changed R code, M = changed R Module, P = changed Parameters, D = changed Data)
-     [Central Tendency] [Paper: Central Te...] [2008-12-16 15:47:28] [9e54d1454d464f1bf9ee4a54d5d56945]
-    D  [Central Tendency] [Paper: Central Te...] [2008-12-16 15:59:22] [9e54d1454d464f1bf9ee4a54d5d56945]
-    D    [Central Tendency] [Paper: Central Te...] [2008-12-16 16:45:52] [9e54d1454d464f1bf9ee4a54d5d56945]
-    D        [Central Tendency] [Paper: Central Te...] [2008-12-16 16:49:56] [8da7502cfecb272886bc60b3f290b8b8] [Current]
Feedback Forum

Post a new message
Dataseries X:
0,9922
0,9778
0,9808
0,9811
1,0014
1,0183
1,0622
1,0773
1,0807
1,0848
1,1582
1,1663
1,1372
1,1139
1,1222
1,1692
1,1702
1,2286
1,2613
1,2646
1,2262
1,1985
1,2007
1,2138
1,2266
1,2176
1,2218
1,249
1,2991
1,3408
1,3119
1,3014
1,3201
1,2938
1,2694
1,2165
1,2037
1,2292
1,2256
1,2015
1,1786
1,1856
1,2103
1,1938
1,202
1,2271
1,277
1,265
1,2684
1,2811
1,2727
1,2611
1,2881
1,3213
1,2999
1,3074
1,3242
1,3516
1,3511
1,3419
1,3716
1,3622
1,3896
1,4227
1,4684
1,457
1,4718
1,4748
1,5527
1,575
1,5557
1,5553
1,577


Summary of computational transaction
Raw Inputview raw input (R code)
Raw Outputview raw output of R engine
Computing time3 seconds
R Server'Herman Ole Andreas Wold' @ 193.190.124.10:1001

\begin{tabular}{lllllllll}
\hline
Summary of computational transaction \tabularnewline
Raw Input & view raw input (R code)  \tabularnewline
Raw Output & view raw output of R engine  \tabularnewline
Computing time & 3 seconds \tabularnewline
R Server & 'Herman Ole Andreas Wold' @ 193.190.124.10:1001 \tabularnewline
\hline
\end{tabular}
%Source: https://freestatistics.org/blog/index.php?pk=34033&T=0

[TABLE]
[ROW][C]Summary of computational transaction[/C][/ROW]
[ROW][C]Raw Input[/C][C]view raw input (R code) [/C][/ROW]
[ROW][C]Raw Output[/C][C]view raw output of R engine [/C][/ROW]
[ROW][C]Computing time[/C][C]3 seconds[/C][/ROW]
[ROW][C]R Server[/C][C]'Herman Ole Andreas Wold' @ 193.190.124.10:1001[/C][/ROW]
[/TABLE]
Source: https://freestatistics.org/blog/index.php?pk=34033&T=0

Globally Unique Identifier (entire table): ba.freestatistics.org/blog/index.php?pk=34033&T=0

As an alternative you can also use a QR Code:  

The GUIDs for individual cells are displayed in the table below:

Summary of computational transaction
Raw Inputview raw input (R code)
Raw Outputview raw output of R engine
Computing time3 seconds
R Server'Herman Ole Andreas Wold' @ 193.190.124.10:1001


Central Tendency - Ungrouped Data
MeasureValueS.E.Value/S.E.
Arithmetic Mean1.255582191780820.016672173672659875.3100475338625
Geometric Mean1.24763752904235
Harmonic Mean1.23969126073737
Quadratic Mean1.2635267544912
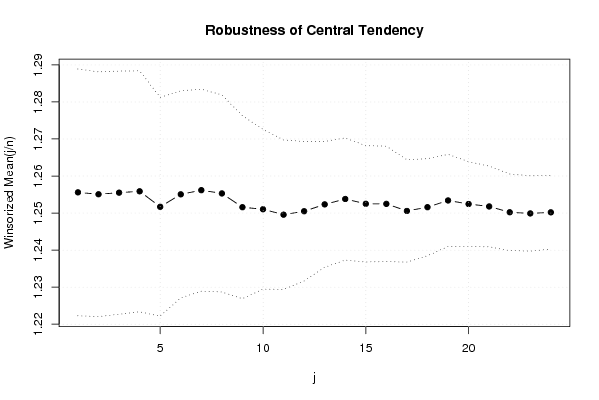
Winsorized Mean ( 1 / 24 )1.255595890410960.016655393497784575.3867442746385
Winsorized Mean ( 2 / 24 )1.255075342465750.016516234550653575.9904043876694
Winsorized Mean ( 3 / 24 )1.255515068493150.01640868239553476.5152885666718
Winsorized Mean ( 4 / 24 )1.255876712328770.016261581228490477.2296798621565
Winsorized Mean ( 5 / 24 )1.251698630136990.014767061114580784.7628800629183
Winsorized Mean ( 6 / 24 )1.255060273972600.013971334365089189.8310956689069
Winsorized Mean ( 7 / 24 )1.256182191780820.013630110975323892.1622864300254
Winsorized Mean ( 8 / 24 )1.255305479452050.013295434278065494.4162825522023
Winsorized Mean ( 9 / 24 )1.251582191780820.0123480971645937101.358304449494
Winsorized Mean ( 10 / 24 )1.251034246575340.0107771312115331116.082306322535
Winsorized Mean ( 11 / 24 )1.249572602739730.0100863790751346123.887134662649
Winsorized Mean ( 12 / 24 )1.250493150684930.00940621340211272132.943310684835
Winsorized Mean ( 13 / 24 )1.252345205479450.00849537815097519147.414886450428
Winsorized Mean ( 14 / 24 )1.253802739726030.0082456390329467152.056467026542
Winsorized Mean ( 15 / 24 )1.252508219178080.00785335819777693159.486959289929
Winsorized Mean ( 16 / 24 )1.252486301369860.00778306402863144160.924578901363
Winsorized Mean ( 17 / 24 )1.250576712328770.00690582070917205181.090237496001
Winsorized Mean ( 18 / 24 )1.251587671232880.00655434631763281190.955376871954
Winsorized Mean ( 19 / 24 )1.253409589041100.00621649104394761201.626541433116
Winsorized Mean ( 20 / 24 )1.252450684931510.00571646268898964219.095400962526
Winsorized Mean ( 21 / 24 )1.251789041095890.00544847965948872229.750154048177
Winsorized Mean ( 22 / 24 )1.250221917808220.00516428036164142242.090248835919
Winsorized Mean ( 23 / 24 )1.249906849315070.00507880789982102246.102407094215
Winsorized Mean ( 24 / 24 )1.250202739726030.00496992820363891251.553480955851
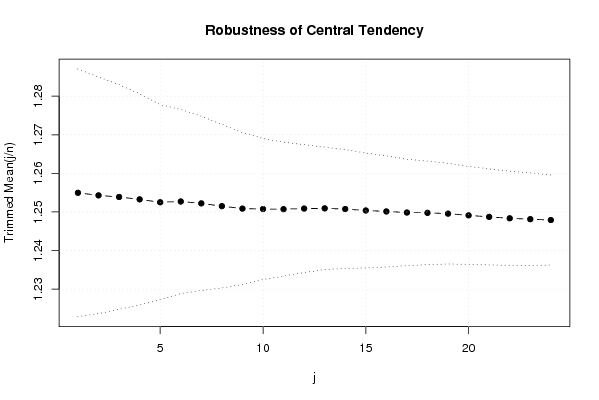
Trimmed Mean ( 1 / 24 )1.254967605633800.016051136940450078.1855896121101
Trimmed Mean ( 2 / 24 )1.254302898550720.015331285674138981.8132885402107
Trimmed Mean ( 3 / 24 )1.253882089552240.014559371877833186.1219907062951
Trimmed Mean ( 4 / 24 )1.253270769230770.013675499696094191.6435082506506
Trimmed Mean ( 5 / 24 )1.252515873015870.012648175565772299.02739462325
Trimmed Mean ( 6 / 24 )1.252711475409840.0119264361952308105.036530184162
Trimmed Mean ( 7 / 24 )1.252227118644070.0112913920215528110.901040035971
Trimmed Mean ( 8 / 24 )1.251503508771930.0106040857747614118.020877551802
Trimmed Mean ( 9 / 24 )1.250872727272730.00983885530780806127.136001916813
Trimmed Mean ( 10 / 24 )1.250764150943400.009143266691586136.796201306739
Trimmed Mean ( 11 / 24 )1.250725490196080.00868608255442308143.991895352087
Trimmed Mean ( 12 / 24 )1.250881632653060.00828032032631422151.066816663826
Trimmed Mean ( 13 / 24 )1.250931914893620.00792968701962819157.752999809099
Trimmed Mean ( 14 / 24 )1.250755555555560.0076940141731427162.562159025069
Trimmed Mean ( 15 / 24 )1.250386046511630.00744132201471199168.032782889859
Trimmed Mean ( 16 / 24 )1.250134146341460.00720076013073899173.611413745727
Trimmed Mean ( 17 / 24 )1.249858974358970.00689338680321517181.312758160622
Trimmed Mean ( 18 / 24 )1.249775675675680.0067013819172378186.495217122443
Trimmed Mean ( 19 / 24 )1.249565714285710.00651967667247122191.660687647579
Trimmed Mean ( 20 / 24 )1.249118181818180.00634330722002358196.919073677396
Trimmed Mean ( 21 / 24 )1.248725806451610.0062201821494989200.753896982295
Trimmed Mean ( 22 / 24 )1.248358620689660.00610148878957382204.59901898416
Trimmed Mean ( 23 / 24 )1.248129629629630.00599367381312996208.241167027714
Trimmed Mean ( 24 / 24 )1.2479040.00583228794442341213.964744520749
Median1.249
Midrange1.2774
Midmean - Weighted Average at Xnp1.24778888888889
Midmean - Weighted Average at X(n+1)p1.24977567567568
Midmean - Empirical Distribution Function1.24977567567568
Midmean - Empirical Distribution Function - Averaging1.24977567567568
Midmean - Empirical Distribution Function - Interpolation1.24977567567568
Midmean - Closest Observation1.24790263157895
Midmean - True Basic - Statistics Graphics Toolkit1.24977567567568
Midmean - MS Excel (old versions)1.24977567567568
Number of observations73

\begin{tabular}{lllllllll}
\hline
Central Tendency - Ungrouped Data \tabularnewline
Measure & Value & S.E. & Value/S.E. \tabularnewline
Arithmetic Mean & 1.25558219178082 & 0.0166721736726598 & 75.3100475338625 \tabularnewline
Geometric Mean & 1.24763752904235 &  &  \tabularnewline
Harmonic Mean & 1.23969126073737 &  &  \tabularnewline
Quadratic Mean & 1.2635267544912 &  &  \tabularnewline
Winsorized Mean ( 1 / 24 ) & 1.25559589041096 & 0.0166553934977845 & 75.3867442746385 \tabularnewline
Winsorized Mean ( 2 / 24 ) & 1.25507534246575 & 0.0165162345506535 & 75.9904043876694 \tabularnewline
Winsorized Mean ( 3 / 24 ) & 1.25551506849315 & 0.016408682395534 & 76.5152885666718 \tabularnewline
Winsorized Mean ( 4 / 24 ) & 1.25587671232877 & 0.0162615812284904 & 77.2296798621565 \tabularnewline
Winsorized Mean ( 5 / 24 ) & 1.25169863013699 & 0.0147670611145807 & 84.7628800629183 \tabularnewline
Winsorized Mean ( 6 / 24 ) & 1.25506027397260 & 0.0139713343650891 & 89.8310956689069 \tabularnewline
Winsorized Mean ( 7 / 24 ) & 1.25618219178082 & 0.0136301109753238 & 92.1622864300254 \tabularnewline
Winsorized Mean ( 8 / 24 ) & 1.25530547945205 & 0.0132954342780654 & 94.4162825522023 \tabularnewline
Winsorized Mean ( 9 / 24 ) & 1.25158219178082 & 0.0123480971645937 & 101.358304449494 \tabularnewline
Winsorized Mean ( 10 / 24 ) & 1.25103424657534 & 0.0107771312115331 & 116.082306322535 \tabularnewline
Winsorized Mean ( 11 / 24 ) & 1.24957260273973 & 0.0100863790751346 & 123.887134662649 \tabularnewline
Winsorized Mean ( 12 / 24 ) & 1.25049315068493 & 0.00940621340211272 & 132.943310684835 \tabularnewline
Winsorized Mean ( 13 / 24 ) & 1.25234520547945 & 0.00849537815097519 & 147.414886450428 \tabularnewline
Winsorized Mean ( 14 / 24 ) & 1.25380273972603 & 0.0082456390329467 & 152.056467026542 \tabularnewline
Winsorized Mean ( 15 / 24 ) & 1.25250821917808 & 0.00785335819777693 & 159.486959289929 \tabularnewline
Winsorized Mean ( 16 / 24 ) & 1.25248630136986 & 0.00778306402863144 & 160.924578901363 \tabularnewline
Winsorized Mean ( 17 / 24 ) & 1.25057671232877 & 0.00690582070917205 & 181.090237496001 \tabularnewline
Winsorized Mean ( 18 / 24 ) & 1.25158767123288 & 0.00655434631763281 & 190.955376871954 \tabularnewline
Winsorized Mean ( 19 / 24 ) & 1.25340958904110 & 0.00621649104394761 & 201.626541433116 \tabularnewline
Winsorized Mean ( 20 / 24 ) & 1.25245068493151 & 0.00571646268898964 & 219.095400962526 \tabularnewline
Winsorized Mean ( 21 / 24 ) & 1.25178904109589 & 0.00544847965948872 & 229.750154048177 \tabularnewline
Winsorized Mean ( 22 / 24 ) & 1.25022191780822 & 0.00516428036164142 & 242.090248835919 \tabularnewline
Winsorized Mean ( 23 / 24 ) & 1.24990684931507 & 0.00507880789982102 & 246.102407094215 \tabularnewline
Winsorized Mean ( 24 / 24 ) & 1.25020273972603 & 0.00496992820363891 & 251.553480955851 \tabularnewline
Trimmed Mean ( 1 / 24 ) & 1.25496760563380 & 0.0160511369404500 & 78.1855896121101 \tabularnewline
Trimmed Mean ( 2 / 24 ) & 1.25430289855072 & 0.0153312856741389 & 81.8132885402107 \tabularnewline
Trimmed Mean ( 3 / 24 ) & 1.25388208955224 & 0.0145593718778331 & 86.1219907062951 \tabularnewline
Trimmed Mean ( 4 / 24 ) & 1.25327076923077 & 0.0136754996960941 & 91.6435082506506 \tabularnewline
Trimmed Mean ( 5 / 24 ) & 1.25251587301587 & 0.0126481755657722 & 99.02739462325 \tabularnewline
Trimmed Mean ( 6 / 24 ) & 1.25271147540984 & 0.0119264361952308 & 105.036530184162 \tabularnewline
Trimmed Mean ( 7 / 24 ) & 1.25222711864407 & 0.0112913920215528 & 110.901040035971 \tabularnewline
Trimmed Mean ( 8 / 24 ) & 1.25150350877193 & 0.0106040857747614 & 118.020877551802 \tabularnewline
Trimmed Mean ( 9 / 24 ) & 1.25087272727273 & 0.00983885530780806 & 127.136001916813 \tabularnewline
Trimmed Mean ( 10 / 24 ) & 1.25076415094340 & 0.009143266691586 & 136.796201306739 \tabularnewline
Trimmed Mean ( 11 / 24 ) & 1.25072549019608 & 0.00868608255442308 & 143.991895352087 \tabularnewline
Trimmed Mean ( 12 / 24 ) & 1.25088163265306 & 0.00828032032631422 & 151.066816663826 \tabularnewline
Trimmed Mean ( 13 / 24 ) & 1.25093191489362 & 0.00792968701962819 & 157.752999809099 \tabularnewline
Trimmed Mean ( 14 / 24 ) & 1.25075555555556 & 0.0076940141731427 & 162.562159025069 \tabularnewline
Trimmed Mean ( 15 / 24 ) & 1.25038604651163 & 0.00744132201471199 & 168.032782889859 \tabularnewline
Trimmed Mean ( 16 / 24 ) & 1.25013414634146 & 0.00720076013073899 & 173.611413745727 \tabularnewline
Trimmed Mean ( 17 / 24 ) & 1.24985897435897 & 0.00689338680321517 & 181.312758160622 \tabularnewline
Trimmed Mean ( 18 / 24 ) & 1.24977567567568 & 0.0067013819172378 & 186.495217122443 \tabularnewline
Trimmed Mean ( 19 / 24 ) & 1.24956571428571 & 0.00651967667247122 & 191.660687647579 \tabularnewline
Trimmed Mean ( 20 / 24 ) & 1.24911818181818 & 0.00634330722002358 & 196.919073677396 \tabularnewline
Trimmed Mean ( 21 / 24 ) & 1.24872580645161 & 0.0062201821494989 & 200.753896982295 \tabularnewline
Trimmed Mean ( 22 / 24 ) & 1.24835862068966 & 0.00610148878957382 & 204.59901898416 \tabularnewline
Trimmed Mean ( 23 / 24 ) & 1.24812962962963 & 0.00599367381312996 & 208.241167027714 \tabularnewline
Trimmed Mean ( 24 / 24 ) & 1.247904 & 0.00583228794442341 & 213.964744520749 \tabularnewline
Median & 1.249 &  &  \tabularnewline
Midrange & 1.2774 &  &  \tabularnewline
Midmean - Weighted Average at Xnp & 1.24778888888889 &  &  \tabularnewline
Midmean - Weighted Average at X(n+1)p & 1.24977567567568 &  &  \tabularnewline
Midmean - Empirical Distribution Function & 1.24977567567568 &  &  \tabularnewline
Midmean - Empirical Distribution Function - Averaging & 1.24977567567568 &  &  \tabularnewline
Midmean - Empirical Distribution Function - Interpolation & 1.24977567567568 &  &  \tabularnewline
Midmean - Closest Observation & 1.24790263157895 &  &  \tabularnewline
Midmean - True Basic - Statistics Graphics Toolkit & 1.24977567567568 &  &  \tabularnewline
Midmean - MS Excel (old versions) & 1.24977567567568 &  &  \tabularnewline
Number of observations & 73 &  &  \tabularnewline
\hline
\end{tabular}
%Source: https://freestatistics.org/blog/index.php?pk=34033&T=1

[TABLE]
[ROW][C]Central Tendency - Ungrouped Data[/C][/ROW]
[ROW][C]Measure[/C][C]Value[/C][C]S.E.[/C][C]Value/S.E.[/C][/ROW]
[ROW][C]Arithmetic Mean[/C][C]1.25558219178082[/C][C]0.0166721736726598[/C][C]75.3100475338625[/C][/ROW]
[ROW][C]Geometric Mean[/C][C]1.24763752904235[/C][C][/C][C][/C][/ROW]
[ROW][C]Harmonic Mean[/C][C]1.23969126073737[/C][C][/C][C][/C][/ROW]
[ROW][C]Quadratic Mean[/C][C]1.2635267544912[/C][C][/C][C][/C][/ROW]
[ROW][C]Winsorized Mean ( 1 / 24 )[/C][C]1.25559589041096[/C][C]0.0166553934977845[/C][C]75.3867442746385[/C][/ROW]
[ROW][C]Winsorized Mean ( 2 / 24 )[/C][C]1.25507534246575[/C][C]0.0165162345506535[/C][C]75.9904043876694[/C][/ROW]
[ROW][C]Winsorized Mean ( 3 / 24 )[/C][C]1.25551506849315[/C][C]0.016408682395534[/C][C]76.5152885666718[/C][/ROW]
[ROW][C]Winsorized Mean ( 4 / 24 )[/C][C]1.25587671232877[/C][C]0.0162615812284904[/C][C]77.2296798621565[/C][/ROW]
[ROW][C]Winsorized Mean ( 5 / 24 )[/C][C]1.25169863013699[/C][C]0.0147670611145807[/C][C]84.7628800629183[/C][/ROW]
[ROW][C]Winsorized Mean ( 6 / 24 )[/C][C]1.25506027397260[/C][C]0.0139713343650891[/C][C]89.8310956689069[/C][/ROW]
[ROW][C]Winsorized Mean ( 7 / 24 )[/C][C]1.25618219178082[/C][C]0.0136301109753238[/C][C]92.1622864300254[/C][/ROW]
[ROW][C]Winsorized Mean ( 8 / 24 )[/C][C]1.25530547945205[/C][C]0.0132954342780654[/C][C]94.4162825522023[/C][/ROW]
[ROW][C]Winsorized Mean ( 9 / 24 )[/C][C]1.25158219178082[/C][C]0.0123480971645937[/C][C]101.358304449494[/C][/ROW]
[ROW][C]Winsorized Mean ( 10 / 24 )[/C][C]1.25103424657534[/C][C]0.0107771312115331[/C][C]116.082306322535[/C][/ROW]
[ROW][C]Winsorized Mean ( 11 / 24 )[/C][C]1.24957260273973[/C][C]0.0100863790751346[/C][C]123.887134662649[/C][/ROW]
[ROW][C]Winsorized Mean ( 12 / 24 )[/C][C]1.25049315068493[/C][C]0.00940621340211272[/C][C]132.943310684835[/C][/ROW]
[ROW][C]Winsorized Mean ( 13 / 24 )[/C][C]1.25234520547945[/C][C]0.00849537815097519[/C][C]147.414886450428[/C][/ROW]
[ROW][C]Winsorized Mean ( 14 / 24 )[/C][C]1.25380273972603[/C][C]0.0082456390329467[/C][C]152.056467026542[/C][/ROW]
[ROW][C]Winsorized Mean ( 15 / 24 )[/C][C]1.25250821917808[/C][C]0.00785335819777693[/C][C]159.486959289929[/C][/ROW]
[ROW][C]Winsorized Mean ( 16 / 24 )[/C][C]1.25248630136986[/C][C]0.00778306402863144[/C][C]160.924578901363[/C][/ROW]
[ROW][C]Winsorized Mean ( 17 / 24 )[/C][C]1.25057671232877[/C][C]0.00690582070917205[/C][C]181.090237496001[/C][/ROW]
[ROW][C]Winsorized Mean ( 18 / 24 )[/C][C]1.25158767123288[/C][C]0.00655434631763281[/C][C]190.955376871954[/C][/ROW]
[ROW][C]Winsorized Mean ( 19 / 24 )[/C][C]1.25340958904110[/C][C]0.00621649104394761[/C][C]201.626541433116[/C][/ROW]
[ROW][C]Winsorized Mean ( 20 / 24 )[/C][C]1.25245068493151[/C][C]0.00571646268898964[/C][C]219.095400962526[/C][/ROW]
[ROW][C]Winsorized Mean ( 21 / 24 )[/C][C]1.25178904109589[/C][C]0.00544847965948872[/C][C]229.750154048177[/C][/ROW]
[ROW][C]Winsorized Mean ( 22 / 24 )[/C][C]1.25022191780822[/C][C]0.00516428036164142[/C][C]242.090248835919[/C][/ROW]
[ROW][C]Winsorized Mean ( 23 / 24 )[/C][C]1.24990684931507[/C][C]0.00507880789982102[/C][C]246.102407094215[/C][/ROW]
[ROW][C]Winsorized Mean ( 24 / 24 )[/C][C]1.25020273972603[/C][C]0.00496992820363891[/C][C]251.553480955851[/C][/ROW]
[ROW][C]Trimmed Mean ( 1 / 24 )[/C][C]1.25496760563380[/C][C]0.0160511369404500[/C][C]78.1855896121101[/C][/ROW]
[ROW][C]Trimmed Mean ( 2 / 24 )[/C][C]1.25430289855072[/C][C]0.0153312856741389[/C][C]81.8132885402107[/C][/ROW]
[ROW][C]Trimmed Mean ( 3 / 24 )[/C][C]1.25388208955224[/C][C]0.0145593718778331[/C][C]86.1219907062951[/C][/ROW]
[ROW][C]Trimmed Mean ( 4 / 24 )[/C][C]1.25327076923077[/C][C]0.0136754996960941[/C][C]91.6435082506506[/C][/ROW]
[ROW][C]Trimmed Mean ( 5 / 24 )[/C][C]1.25251587301587[/C][C]0.0126481755657722[/C][C]99.02739462325[/C][/ROW]
[ROW][C]Trimmed Mean ( 6 / 24 )[/C][C]1.25271147540984[/C][C]0.0119264361952308[/C][C]105.036530184162[/C][/ROW]
[ROW][C]Trimmed Mean ( 7 / 24 )[/C][C]1.25222711864407[/C][C]0.0112913920215528[/C][C]110.901040035971[/C][/ROW]
[ROW][C]Trimmed Mean ( 8 / 24 )[/C][C]1.25150350877193[/C][C]0.0106040857747614[/C][C]118.020877551802[/C][/ROW]
[ROW][C]Trimmed Mean ( 9 / 24 )[/C][C]1.25087272727273[/C][C]0.00983885530780806[/C][C]127.136001916813[/C][/ROW]
[ROW][C]Trimmed Mean ( 10 / 24 )[/C][C]1.25076415094340[/C][C]0.009143266691586[/C][C]136.796201306739[/C][/ROW]
[ROW][C]Trimmed Mean ( 11 / 24 )[/C][C]1.25072549019608[/C][C]0.00868608255442308[/C][C]143.991895352087[/C][/ROW]
[ROW][C]Trimmed Mean ( 12 / 24 )[/C][C]1.25088163265306[/C][C]0.00828032032631422[/C][C]151.066816663826[/C][/ROW]
[ROW][C]Trimmed Mean ( 13 / 24 )[/C][C]1.25093191489362[/C][C]0.00792968701962819[/C][C]157.752999809099[/C][/ROW]
[ROW][C]Trimmed Mean ( 14 / 24 )[/C][C]1.25075555555556[/C][C]0.0076940141731427[/C][C]162.562159025069[/C][/ROW]
[ROW][C]Trimmed Mean ( 15 / 24 )[/C][C]1.25038604651163[/C][C]0.00744132201471199[/C][C]168.032782889859[/C][/ROW]
[ROW][C]Trimmed Mean ( 16 / 24 )[/C][C]1.25013414634146[/C][C]0.00720076013073899[/C][C]173.611413745727[/C][/ROW]
[ROW][C]Trimmed Mean ( 17 / 24 )[/C][C]1.24985897435897[/C][C]0.00689338680321517[/C][C]181.312758160622[/C][/ROW]
[ROW][C]Trimmed Mean ( 18 / 24 )[/C][C]1.24977567567568[/C][C]0.0067013819172378[/C][C]186.495217122443[/C][/ROW]
[ROW][C]Trimmed Mean ( 19 / 24 )[/C][C]1.24956571428571[/C][C]0.00651967667247122[/C][C]191.660687647579[/C][/ROW]
[ROW][C]Trimmed Mean ( 20 / 24 )[/C][C]1.24911818181818[/C][C]0.00634330722002358[/C][C]196.919073677396[/C][/ROW]
[ROW][C]Trimmed Mean ( 21 / 24 )[/C][C]1.24872580645161[/C][C]0.0062201821494989[/C][C]200.753896982295[/C][/ROW]
[ROW][C]Trimmed Mean ( 22 / 24 )[/C][C]1.24835862068966[/C][C]0.00610148878957382[/C][C]204.59901898416[/C][/ROW]
[ROW][C]Trimmed Mean ( 23 / 24 )[/C][C]1.24812962962963[/C][C]0.00599367381312996[/C][C]208.241167027714[/C][/ROW]
[ROW][C]Trimmed Mean ( 24 / 24 )[/C][C]1.247904[/C][C]0.00583228794442341[/C][C]213.964744520749[/C][/ROW]
[ROW][C]Median[/C][C]1.249[/C][C][/C][C][/C][/ROW]
[ROW][C]Midrange[/C][C]1.2774[/C][C][/C][C][/C][/ROW]
[ROW][C]Midmean - Weighted Average at Xnp[/C][C]1.24778888888889[/C][C][/C][C][/C][/ROW]
[ROW][C]Midmean - Weighted Average at X(n+1)p[/C][C]1.24977567567568[/C][C][/C][C][/C][/ROW]
[ROW][C]Midmean - Empirical Distribution Function[/C][C]1.24977567567568[/C][C][/C][C][/C][/ROW]
[ROW][C]Midmean - Empirical Distribution Function - Averaging[/C][C]1.24977567567568[/C][C][/C][C][/C][/ROW]
[ROW][C]Midmean - Empirical Distribution Function - Interpolation[/C][C]1.24977567567568[/C][C][/C][C][/C][/ROW]
[ROW][C]Midmean - Closest Observation[/C][C]1.24790263157895[/C][C][/C][C][/C][/ROW]
[ROW][C]Midmean - True Basic - Statistics Graphics Toolkit[/C][C]1.24977567567568[/C][C][/C][C][/C][/ROW]
[ROW][C]Midmean - MS Excel (old versions)[/C][C]1.24977567567568[/C][C][/C][C][/C][/ROW]
[ROW][C]Number of observations[/C][C]73[/C][C][/C][C][/C][/ROW]
[/TABLE]
Source: https://freestatistics.org/blog/index.php?pk=34033&T=1

Globally Unique Identifier (entire table): ba.freestatistics.org/blog/index.php?pk=34033&T=1

As an alternative you can also use a QR Code:  

The GUIDs for individual cells are displayed in the table below:

Central Tendency - Ungrouped Data
MeasureValueS.E.Value/S.E.
Arithmetic Mean1.255582191780820.016672173672659875.3100475338625
Geometric Mean1.24763752904235
Harmonic Mean1.23969126073737
Quadratic Mean1.2635267544912
Winsorized Mean ( 1 / 24 )1.255595890410960.016655393497784575.3867442746385
Winsorized Mean ( 2 / 24 )1.255075342465750.016516234550653575.9904043876694
Winsorized Mean ( 3 / 24 )1.255515068493150.01640868239553476.5152885666718
Winsorized Mean ( 4 / 24 )1.255876712328770.016261581228490477.2296798621565
Winsorized Mean ( 5 / 24 )1.251698630136990.014767061114580784.7628800629183
Winsorized Mean ( 6 / 24 )1.255060273972600.013971334365089189.8310956689069
Winsorized Mean ( 7 / 24 )1.256182191780820.013630110975323892.1622864300254
Winsorized Mean ( 8 / 24 )1.255305479452050.013295434278065494.4162825522023
Winsorized Mean ( 9 / 24 )1.251582191780820.0123480971645937101.358304449494
Winsorized Mean ( 10 / 24 )1.251034246575340.0107771312115331116.082306322535
Winsorized Mean ( 11 / 24 )1.249572602739730.0100863790751346123.887134662649
Winsorized Mean ( 12 / 24 )1.250493150684930.00940621340211272132.943310684835
Winsorized Mean ( 13 / 24 )1.252345205479450.00849537815097519147.414886450428
Winsorized Mean ( 14 / 24 )1.253802739726030.0082456390329467152.056467026542
Winsorized Mean ( 15 / 24 )1.252508219178080.00785335819777693159.486959289929
Winsorized Mean ( 16 / 24 )1.252486301369860.00778306402863144160.924578901363
Winsorized Mean ( 17 / 24 )1.250576712328770.00690582070917205181.090237496001
Winsorized Mean ( 18 / 24 )1.251587671232880.00655434631763281190.955376871954
Winsorized Mean ( 19 / 24 )1.253409589041100.00621649104394761201.626541433116
Winsorized Mean ( 20 / 24 )1.252450684931510.00571646268898964219.095400962526
Winsorized Mean ( 21 / 24 )1.251789041095890.00544847965948872229.750154048177
Winsorized Mean ( 22 / 24 )1.250221917808220.00516428036164142242.090248835919
Winsorized Mean ( 23 / 24 )1.249906849315070.00507880789982102246.102407094215
Winsorized Mean ( 24 / 24 )1.250202739726030.00496992820363891251.553480955851
Trimmed Mean ( 1 / 24 )1.254967605633800.016051136940450078.1855896121101
Trimmed Mean ( 2 / 24 )1.254302898550720.015331285674138981.8132885402107
Trimmed Mean ( 3 / 24 )1.253882089552240.014559371877833186.1219907062951
Trimmed Mean ( 4 / 24 )1.253270769230770.013675499696094191.6435082506506
Trimmed Mean ( 5 / 24 )1.252515873015870.012648175565772299.02739462325
Trimmed Mean ( 6 / 24 )1.252711475409840.0119264361952308105.036530184162
Trimmed Mean ( 7 / 24 )1.252227118644070.0112913920215528110.901040035971
Trimmed Mean ( 8 / 24 )1.251503508771930.0106040857747614118.020877551802
Trimmed Mean ( 9 / 24 )1.250872727272730.00983885530780806127.136001916813
Trimmed Mean ( 10 / 24 )1.250764150943400.009143266691586136.796201306739
Trimmed Mean ( 11 / 24 )1.250725490196080.00868608255442308143.991895352087
Trimmed Mean ( 12 / 24 )1.250881632653060.00828032032631422151.066816663826
Trimmed Mean ( 13 / 24 )1.250931914893620.00792968701962819157.752999809099
Trimmed Mean ( 14 / 24 )1.250755555555560.0076940141731427162.562159025069
Trimmed Mean ( 15 / 24 )1.250386046511630.00744132201471199168.032782889859
Trimmed Mean ( 16 / 24 )1.250134146341460.00720076013073899173.611413745727
Trimmed Mean ( 17 / 24 )1.249858974358970.00689338680321517181.312758160622
Trimmed Mean ( 18 / 24 )1.249775675675680.0067013819172378186.495217122443
Trimmed Mean ( 19 / 24 )1.249565714285710.00651967667247122191.660687647579
Trimmed Mean ( 20 / 24 )1.249118181818180.00634330722002358196.919073677396
Trimmed Mean ( 21 / 24 )1.248725806451610.0062201821494989200.753896982295
Trimmed Mean ( 22 / 24 )1.248358620689660.00610148878957382204.59901898416
Trimmed Mean ( 23 / 24 )1.248129629629630.00599367381312996208.241167027714
Trimmed Mean ( 24 / 24 )1.2479040.00583228794442341213.964744520749
Median1.249
Midrange1.2774
Midmean - Weighted Average at Xnp1.24778888888889
Midmean - Weighted Average at X(n+1)p1.24977567567568
Midmean - Empirical Distribution Function1.24977567567568
Midmean - Empirical Distribution Function - Averaging1.24977567567568
Midmean - Empirical Distribution Function - Interpolation1.24977567567568
Midmean - Closest Observation1.24790263157895
Midmean - True Basic - Statistics Graphics Toolkit1.24977567567568
Midmean - MS Excel (old versions)1.24977567567568
Number of observations73


Parameters (Session):
Parameters (R input):
R code (references can be found in the software module):
geomean <- function(x) {
return(exp(mean(log(x))))
}
harmean <- function(x) {
return(1/mean(1/x))
}
quamean <- function(x) {
return(sqrt(mean(x*x)))
}
winmean <- function(x) {
x <-sort(x[!is.na(x)])
n<-length(x)
denom <- 3
nodenom <- n/denom
if (nodenom>40) denom <- n/40
sqrtn = sqrt(n)
roundnodenom = floor(nodenom)
win <- array(NA,dim=c(roundnodenom,2))
for (j in 1:roundnodenom) {
win[j,1] <- (j*x[j+1]+sum(x[(j+1):(n-j)])+j*x[n-j])/n
win[j,2] <- sd(c(rep(x[j+1],j),x[(j+1):(n-j)],rep(x[n-j],j)))/sqrtn
}
return(win)
}
trimean <- function(x) {
x <-sort(x[!is.na(x)])
n<-length(x)
denom <- 3
nodenom <- n/denom
if (nodenom>40) denom <- n/40
sqrtn = sqrt(n)
roundnodenom = floor(nodenom)
tri <- array(NA,dim=c(roundnodenom,2))
for (j in 1:roundnodenom) {
tri[j,1] <- mean(x,trim=j/n)
tri[j,2] <- sd(x[(j+1):(n-j)]) / sqrt(n-j*2)
}
return(tri)
}
midrange <- function(x) {
return((max(x)+min(x))/2)
}
q1 <- function(data,n,p,i,f) {
np <- n*p;
i <<- floor(np)
f <<- np - i
qvalue <- (1-f)*data[i] + f*data[i+1]
}
q2 <- function(data,n,p,i,f) {
np <- (n+1)*p
i <<- floor(np)
f <<- np - i
qvalue <- (1-f)*data[i] + f*data[i+1]
}
q3 <- function(data,n,p,i,f) {
np <- n*p
i <<- floor(np)
f <<- np - i
if (f==0) {
qvalue <- data[i]
} else {
qvalue <- data[i+1]
}
}
q4 <- function(data,n,p,i,f) {
np <- n*p
i <<- floor(np)
f <<- np - i
if (f==0) {
qvalue <- (data[i]+data[i+1])/2
} else {
qvalue <- data[i+1]
}
}
q5 <- function(data,n,p,i,f) {
np <- (n-1)*p
i <<- floor(np)
f <<- np - i
if (f==0) {
qvalue <- data[i+1]
} else {
qvalue <- data[i+1] + f*(data[i+2]-data[i+1])
}
}
q6 <- function(data,n,p,i,f) {
np <- n*p+0.5
i <<- floor(np)
f <<- np - i
qvalue <- data[i]
}
q7 <- function(data,n,p,i,f) {
np <- (n+1)*p
i <<- floor(np)
f <<- np - i
if (f==0) {
qvalue <- data[i]
} else {
qvalue <- f*data[i] + (1-f)*data[i+1]
}
}
q8 <- function(data,n,p,i,f) {
np <- (n+1)*p
i <<- floor(np)
f <<- np - i
if (f==0) {
qvalue <- data[i]
} else {
if (f == 0.5) {
qvalue <- (data[i]+data[i+1])/2
} else {
if (f < 0.5) {
qvalue <- data[i]
} else {
qvalue <- data[i+1]
}
}
}
}
midmean <- function(x,def) {
x <-sort(x[!is.na(x)])
n<-length(x)
if (def==1) {
qvalue1 <- q1(x,n,0.25,i,f)
qvalue3 <- q1(x,n,0.75,i,f)
}
if (def==2) {
qvalue1 <- q2(x,n,0.25,i,f)
qvalue3 <- q2(x,n,0.75,i,f)
}
if (def==3) {
qvalue1 <- q3(x,n,0.25,i,f)
qvalue3 <- q3(x,n,0.75,i,f)
}
if (def==4) {
qvalue1 <- q4(x,n,0.25,i,f)
qvalue3 <- q4(x,n,0.75,i,f)
}
if (def==5) {
qvalue1 <- q5(x,n,0.25,i,f)
qvalue3 <- q5(x,n,0.75,i,f)
}
if (def==6) {
qvalue1 <- q6(x,n,0.25,i,f)
qvalue3 <- q6(x,n,0.75,i,f)
}
if (def==7) {
qvalue1 <- q7(x,n,0.25,i,f)
qvalue3 <- q7(x,n,0.75,i,f)
}
if (def==8) {
qvalue1 <- q8(x,n,0.25,i,f)
qvalue3 <- q8(x,n,0.75,i,f)
}
midm <- 0
myn <- 0
roundno4 <- round(n/4)
round3no4 <- round(3*n/4)
for (i in 1:n) {
if ((x[i]>=qvalue1) & (x[i]<=qvalue3)){
midm = midm + x[i]
myn = myn + 1
}
}
midm = midm / myn
return(midm)
}
(arm <- mean(x))
sqrtn <- sqrt(length(x))
(armse <- sd(x) / sqrtn)
(armose <- arm / armse)
(geo <- geomean(x))
(har <- harmean(x))
(qua <- quamean(x))
(win <- winmean(x))
(tri <- trimean(x))
(midr <- midrange(x))
midm <- array(NA,dim=8)
for (j in 1:8) midm[j] <- midmean(x,j)
midm
bitmap(file='test1.png')
lb <- win[,1] - 2*win[,2]
ub <- win[,1] + 2*win[,2]
if ((ylimmin == '') | (ylimmax == '')) plot(win[,1],type='b',main=main, xlab='j', pch=19, ylab='Winsorized Mean(j/n)', ylim=c(min(lb),max(ub))) else plot(win[,1],type='l',main=main, xlab='j', pch=19, ylab='Winsorized Mean(j/n)', ylim=c(ylimmin,ylimmax))
lines(ub,lty=3)
lines(lb,lty=3)
grid()
dev.off()
bitmap(file='test2.png')
lb <- tri[,1] - 2*tri[,2]
ub <- tri[,1] + 2*tri[,2]
if ((ylimmin == '') | (ylimmax == '')) plot(tri[,1],type='b',main=main, xlab='j', pch=19, ylab='Trimmed Mean(j/n)', ylim=c(min(lb),max(ub))) else plot(tri[,1],type='l',main=main, xlab='j', pch=19, ylab='Trimmed Mean(j/n)', ylim=c(ylimmin,ylimmax))
lines(ub,lty=3)
lines(lb,lty=3)
grid()
dev.off()
load(file='createtable')
a<-table.start()
a<-table.row.start(a)
a<-table.element(a,'Central Tendency - Ungrouped Data',4,TRUE)
a<-table.row.end(a)
a<-table.row.start(a)
a<-table.element(a,'Measure',header=TRUE)
a<-table.element(a,'Value',header=TRUE)
a<-table.element(a,'S.E.',header=TRUE)
a<-table.element(a,'Value/S.E.',header=TRUE)
a<-table.row.end(a)
a<-table.row.start(a)
a<-table.element(a,hyperlink('arithmetic_mean.htm', 'Arithmetic Mean', 'click to view the definition of the Arithmetic Mean'),header=TRUE)
a<-table.element(a,arm)
a<-table.element(a,hyperlink('arithmetic_mean_standard_error.htm', armse, 'click to view the definition of the Standard Error of the Arithmetic Mean'))
a<-table.element(a,armose)
a<-table.row.end(a)
a<-table.row.start(a)
a<-table.element(a,hyperlink('geometric_mean.htm', 'Geometric Mean', 'click to view the definition of the Geometric Mean'),header=TRUE)
a<-table.element(a,geo)
a<-table.element(a,'')
a<-table.row.end(a)
a<-table.row.start(a)
a<-table.element(a,hyperlink('harmonic_mean.htm', 'Harmonic Mean', 'click to view the definition of the Harmonic Mean'),header=TRUE)
a<-table.element(a,har)
a<-table.element(a,'')
a<-table.row.end(a)
a<-table.row.start(a)
a<-table.element(a,hyperlink('quadratic_mean.htm', 'Quadratic Mean', 'click to view the definition of the Quadratic Mean'),header=TRUE)
a<-table.element(a,qua)
a<-table.element(a,'')
a<-table.row.end(a)
for (j in 1:length(win[,1])) {
a<-table.row.start(a)
mylabel <- paste('Winsorized Mean (',j)
mylabel <- paste(mylabel,'/')
mylabel <- paste(mylabel,length(win[,1]))
mylabel <- paste(mylabel,')')
a<-table.element(a,hyperlink('winsorized_mean.htm', mylabel, 'click to view the definition of the Winsorized Mean'),header=TRUE)
a<-table.element(a,win[j,1])
a<-table.element(a,win[j,2])
a<-table.element(a,win[j,1]/win[j,2])
a<-table.row.end(a)
}
for (j in 1:length(tri[,1])) {
a<-table.row.start(a)
mylabel <- paste('Trimmed Mean (',j)
mylabel <- paste(mylabel,'/')
mylabel <- paste(mylabel,length(tri[,1]))
mylabel <- paste(mylabel,')')
a<-table.element(a,hyperlink('arithmetic_mean.htm', mylabel, 'click to view the definition of the Trimmed Mean'),header=TRUE)
a<-table.element(a,tri[j,1])
a<-table.element(a,tri[j,2])
a<-table.element(a,tri[j,1]/tri[j,2])
a<-table.row.end(a)
}
a<-table.row.start(a)
a<-table.element(a,hyperlink('median_1.htm', 'Median', 'click to view the definition of the Median'),header=TRUE)
a<-table.element(a,median(x))
a<-table.element(a,'')
a<-table.row.end(a)
a<-table.row.start(a)
a<-table.element(a,hyperlink('midrange.htm', 'Midrange', 'click to view the definition of the Midrange'),header=TRUE)
a<-table.element(a,midr)
a<-table.element(a,'')
a<-table.row.end(a)
a<-table.row.start(a)
mymid <- hyperlink('midmean.htm', 'Midmean', 'click to view the definition of the Midmean')
mylabel <- paste(mymid,hyperlink('method_1.htm','Weighted Average at Xnp',''),sep=' - ')
a<-table.element(a,mylabel,header=TRUE)
a<-table.element(a,midm[1])
a<-table.element(a,'')
a<-table.row.end(a)
a<-table.row.start(a)
mymid <- hyperlink('midmean.htm', 'Midmean', 'click to view the definition of the Midmean')
mylabel <- paste(mymid,hyperlink('method_2.htm','Weighted Average at X(n+1)p',''),sep=' - ')
a<-table.element(a,mylabel,header=TRUE)
a<-table.element(a,midm[2])
a<-table.element(a,'')
a<-table.row.end(a)
a<-table.row.start(a)
mymid <- hyperlink('midmean.htm', 'Midmean', 'click to view the definition of the Midmean')
mylabel <- paste(mymid,hyperlink('method_3.htm','Empirical Distribution Function',''),sep=' - ')
a<-table.element(a,mylabel,header=TRUE)
a<-table.element(a,midm[3])
a<-table.element(a,'')
a<-table.row.end(a)
a<-table.row.start(a)
mymid <- hyperlink('midmean.htm', 'Midmean', 'click to view the definition of the Midmean')
mylabel <- paste(mymid,hyperlink('method_4.htm','Empirical Distribution Function - Averaging',''),sep=' - ')
a<-table.element(a,mylabel,header=TRUE)
a<-table.element(a,midm[4])
a<-table.element(a,'')
a<-table.row.end(a)
a<-table.row.start(a)
mymid <- hyperlink('midmean.htm', 'Midmean', 'click to view the definition of the Midmean')
mylabel <- paste(mymid,hyperlink('method_5.htm','Empirical Distribution Function - Interpolation',''),sep=' - ')
a<-table.element(a,mylabel,header=TRUE)
a<-table.element(a,midm[5])
a<-table.element(a,'')
a<-table.row.end(a)
a<-table.row.start(a)
mymid <- hyperlink('midmean.htm', 'Midmean', 'click to view the definition of the Midmean')
mylabel <- paste(mymid,hyperlink('method_6.htm','Closest Observation',''),sep=' - ')
a<-table.element(a,mylabel,header=TRUE)
a<-table.element(a,midm[6])
a<-table.element(a,'')
a<-table.row.end(a)
a<-table.row.start(a)
mymid <- hyperlink('midmean.htm', 'Midmean', 'click to view the definition of the Midmean')
mylabel <- paste(mymid,hyperlink('method_7.htm','True Basic - Statistics Graphics Toolkit',''),sep=' - ')
a<-table.element(a,mylabel,header=TRUE)
a<-table.element(a,midm[7])
a<-table.element(a,'')
a<-table.row.end(a)
a<-table.row.start(a)
mymid <- hyperlink('midmean.htm', 'Midmean', 'click to view the definition of the Midmean')
mylabel <- paste(mymid,hyperlink('method_8.htm','MS Excel (old versions)',''),sep=' - ')
a<-table.element(a,mylabel,header=TRUE)
a<-table.element(a,midm[8])
a<-table.element(a,'')
a<-table.row.end(a)
a<-table.row.start(a)
a<-table.element(a,'Number of observations',header=TRUE)
a<-table.element(a,length(x))
a<-table.element(a,'')
a<-table.row.end(a)
a<-table.end(a)
table.save(a,file='mytable.tab')