Free Statistics

of Irreproducible Research!

Author's title

Author*The author of this computation has been verified*
R Software Modulerwasp_multipleregression.wasp
Title produced by softwareMultiple Regression
Date of computationTue, 16 Dec 2008 09:18:01 -0700
Cite this page as followsStatistical Computations at FreeStatistics.org, Office for Research Development and Education, URL https://freestatistics.org/blog/index.php?v=date/2008/Dec/16/t1229444397sibckfw119372up.htm/, Retrieved Wed, 15 May 2024 14:36:10 +0000
Statistical Computations at FreeStatistics.org, Office for Research Development and Education, URL https://freestatistics.org/blog/index.php?pk=34008, Retrieved Wed, 15 May 2024 14:36:10 +0000
QR Codes:

Original text written by user:
IsPrivate?No (this computation is public)
User-defined keywordsMultiple Lineair Regression
Estimated Impact241
Family? (F = Feedback message, R = changed R code, M = changed R Module, P = changed Parameters, D = changed Data)
F     [Multiple Regression] [MLR] [2008-11-26 18:25:12] [3ffd109c9e040b1ae7e5dbe576d4698c]
- R P     [Multiple Regression] [Multiple Lineair ...] [2008-12-16 16:18:01] [962e6c9020896982bc8283b8971710a9] [Current]
-   P       [Multiple Regression] [multiple lineair ...] [2008-12-17 09:54:45] [3ffd109c9e040b1ae7e5dbe576d4698c]
-   P       [Multiple Regression] [Mutliple lineair ...] [2008-12-17 10:07:11] [3ffd109c9e040b1ae7e5dbe576d4698c]
-    D        [Multiple Regression] [multiple lineair ...] [2008-12-22 16:07:08] [3ffd109c9e040b1ae7e5dbe576d4698c]
-               [Multiple Regression] [met monthly dummi...] [2008-12-24 11:58:38] [b28ef2aea2cd58ceb5ad90223572c703]
-    D      [Multiple Regression] [] [2008-12-17 10:49:06] [3ffd109c9e040b1ae7e5dbe576d4698c]
-    D        [Multiple Regression] [multiple lineair ...] [2008-12-22 16:12:14] [3ffd109c9e040b1ae7e5dbe576d4698c]
-    D          [Multiple Regression] [multiple lineair ...] [2008-12-22 16:20:36] [3ffd109c9e040b1ae7e5dbe576d4698c]
-    D      [Multiple Regression] [multiple lineair ...] [2008-12-22 16:00:49] [3ffd109c9e040b1ae7e5dbe576d4698c]
-             [Multiple Regression] [monthly dummies e...] [2008-12-24 11:55:22] [b28ef2aea2cd58ceb5ad90223572c703]
Feedback Forum

Post a new message
Dataseries X:
147768	0
137507	0
136919	0
136151	0
133001	0
125554	0
119647	0
114158	0
116193	0
152803	0
161761	0
160942	0
149470	0
139208	0
134588	0
130322	0
126611	0
122401	0
117352	0
112135	0
112879	0
148729	0
157230	0
157221	0
146681	0
136524	0
132111	1
125326	1
122716	1
116615	1
113719	1
110737	1
112093	1
143565	1
149946	1
149147	1
134339	1
122683	1
115614	1
116566	1
111272	1
104609	1
101802	1
94542	1
93051	1
124129	1
130374	1
123946	1
114971	1
105531	1
104919	0
104782	0
101281	0
94545	0
93248	0
84031	0
87486	0
115867	0
120327	0
117008	0
108811	0


Summary of computational transaction
Raw Inputview raw input (R code)
Raw Outputview raw output of R engine
Computing time4 seconds
R Server'Gwilym Jenkins' @ 72.249.127.135

\begin{tabular}{lllllllll}
\hline
Summary of computational transaction \tabularnewline
Raw Input & view raw input (R code)  \tabularnewline
Raw Output & view raw output of R engine  \tabularnewline
Computing time & 4 seconds \tabularnewline
R Server & 'Gwilym Jenkins' @ 72.249.127.135 \tabularnewline
\hline
\end{tabular}
%Source: https://freestatistics.org/blog/index.php?pk=34008&T=0

[TABLE]
[ROW][C]Summary of computational transaction[/C][/ROW]
[ROW][C]Raw Input[/C][C]view raw input (R code) [/C][/ROW]
[ROW][C]Raw Output[/C][C]view raw output of R engine [/C][/ROW]
[ROW][C]Computing time[/C][C]4 seconds[/C][/ROW]
[ROW][C]R Server[/C][C]'Gwilym Jenkins' @ 72.249.127.135[/C][/ROW]
[/TABLE]
Source: https://freestatistics.org/blog/index.php?pk=34008&T=0

Globally Unique Identifier (entire table): ba.freestatistics.org/blog/index.php?pk=34008&T=0

As an alternative you can also use a QR Code:  

The GUIDs for individual cells are displayed in the table below:

Summary of computational transaction
Raw Inputview raw input (R code)
Raw Outputview raw output of R engine
Computing time4 seconds
R Server'Gwilym Jenkins' @ 72.249.127.135


Multiple Linear Regression - Estimated Regression Equation
jonger_dan_25[t] = + 144165.981651376 -6282.95412844038plan[t] -8398.33027522928M1[t] -13362.2M2[t] -16822.6M3[t] -19023.4M4[t] -22676.6000000000M5[t] -28908M6[t] -32499.2M7[t] -38532.2M8[t] -37312.4M9[t] -4634.19999999999M10[t] + 2274.80000000000M11[t] + e[t]

\begin{tabular}{lllllllll}
\hline
Multiple Linear Regression - Estimated Regression Equation \tabularnewline
jonger_dan_25[t] =  +  144165.981651376 -6282.95412844038plan[t] -8398.33027522928M1[t] -13362.2M2[t] -16822.6M3[t] -19023.4M4[t] -22676.6000000000M5[t] -28908M6[t] -32499.2M7[t] -38532.2M8[t] -37312.4M9[t] -4634.19999999999M10[t] +  2274.80000000000M11[t]  + e[t] \tabularnewline
\hline
\end{tabular}
%Source: https://freestatistics.org/blog/index.php?pk=34008&T=1

[TABLE]
[ROW][C]Multiple Linear Regression - Estimated Regression Equation[/C][/ROW]
[ROW][C]jonger_dan_25[t] =  +  144165.981651376 -6282.95412844038plan[t] -8398.33027522928M1[t] -13362.2M2[t] -16822.6M3[t] -19023.4M4[t] -22676.6000000000M5[t] -28908M6[t] -32499.2M7[t] -38532.2M8[t] -37312.4M9[t] -4634.19999999999M10[t] +  2274.80000000000M11[t]  + e[t][/C][/ROW]
[/TABLE]
Source: https://freestatistics.org/blog/index.php?pk=34008&T=1

Globally Unique Identifier (entire table): ba.freestatistics.org/blog/index.php?pk=34008&T=1

As an alternative you can also use a QR Code:  

The GUIDs for individual cells are displayed in the table below:

Multiple Linear Regression - Estimated Regression Equation
jonger_dan_25[t] = + 144165.981651376 -6282.95412844038plan[t] -8398.33027522928M1[t] -13362.2M2[t] -16822.6M3[t] -19023.4M4[t] -22676.6000000000M5[t] -28908M6[t] -32499.2M7[t] -38532.2M8[t] -37312.4M9[t] -4634.19999999999M10[t] + 2274.80000000000M11[t] + e[t]


Multiple Linear Regression - Ordinary Least Squares
VariableParameterS.D.T-STATH0: parameter = 02-tail p-value1-tail p-value
(Intercept)144165.9816513766735.59374121.403600
plan-6282.954128440383846.295072-1.63350.1089050.054453
M1-8398.330275229288882.63798-0.94550.3491510.174575
M2-13362.29273.746312-1.44090.1561150.078058
M3-16822.69273.746312-1.8140.0759310.037965
M4-19023.49273.746312-2.05130.0457150.022857
M5-22676.60000000009273.746312-2.44520.0181950.009097
M6-289089273.746312-3.11720.0030820.001541
M7-32499.29273.746312-3.50440.0010020.000501
M8-38532.29273.746312-4.1550.0001336.7e-05
M9-37312.49273.746312-4.02340.0002020.000101
M10-4634.199999999999273.746312-0.49970.6195610.309781
M112274.800000000009273.7463120.24530.8072740.403637

\begin{tabular}{lllllllll}
\hline
Multiple Linear Regression - Ordinary Least Squares \tabularnewline
Variable & Parameter & S.D. & T-STATH0: parameter = 0 & 2-tail p-value & 1-tail p-value \tabularnewline
(Intercept) & 144165.981651376 & 6735.593741 & 21.4036 & 0 & 0 \tabularnewline
plan & -6282.95412844038 & 3846.295072 & -1.6335 & 0.108905 & 0.054453 \tabularnewline
M1 & -8398.33027522928 & 8882.63798 & -0.9455 & 0.349151 & 0.174575 \tabularnewline
M2 & -13362.2 & 9273.746312 & -1.4409 & 0.156115 & 0.078058 \tabularnewline
M3 & -16822.6 & 9273.746312 & -1.814 & 0.075931 & 0.037965 \tabularnewline
M4 & -19023.4 & 9273.746312 & -2.0513 & 0.045715 & 0.022857 \tabularnewline
M5 & -22676.6000000000 & 9273.746312 & -2.4452 & 0.018195 & 0.009097 \tabularnewline
M6 & -28908 & 9273.746312 & -3.1172 & 0.003082 & 0.001541 \tabularnewline
M7 & -32499.2 & 9273.746312 & -3.5044 & 0.001002 & 0.000501 \tabularnewline
M8 & -38532.2 & 9273.746312 & -4.155 & 0.000133 & 6.7e-05 \tabularnewline
M9 & -37312.4 & 9273.746312 & -4.0234 & 0.000202 & 0.000101 \tabularnewline
M10 & -4634.19999999999 & 9273.746312 & -0.4997 & 0.619561 & 0.309781 \tabularnewline
M11 & 2274.80000000000 & 9273.746312 & 0.2453 & 0.807274 & 0.403637 \tabularnewline
\hline
\end{tabular}
%Source: https://freestatistics.org/blog/index.php?pk=34008&T=2

[TABLE]
[ROW][C]Multiple Linear Regression - Ordinary Least Squares[/C][/ROW]
[ROW][C]Variable[/C][C]Parameter[/C][C]S.D.[/C][C]T-STATH0: parameter = 0[/C][C]2-tail p-value[/C][C]1-tail p-value[/C][/ROW]
[ROW][C](Intercept)[/C][C]144165.981651376[/C][C]6735.593741[/C][C]21.4036[/C][C]0[/C][C]0[/C][/ROW]
[ROW][C]plan[/C][C]-6282.95412844038[/C][C]3846.295072[/C][C]-1.6335[/C][C]0.108905[/C][C]0.054453[/C][/ROW]
[ROW][C]M1[/C][C]-8398.33027522928[/C][C]8882.63798[/C][C]-0.9455[/C][C]0.349151[/C][C]0.174575[/C][/ROW]
[ROW][C]M2[/C][C]-13362.2[/C][C]9273.746312[/C][C]-1.4409[/C][C]0.156115[/C][C]0.078058[/C][/ROW]
[ROW][C]M3[/C][C]-16822.6[/C][C]9273.746312[/C][C]-1.814[/C][C]0.075931[/C][C]0.037965[/C][/ROW]
[ROW][C]M4[/C][C]-19023.4[/C][C]9273.746312[/C][C]-2.0513[/C][C]0.045715[/C][C]0.022857[/C][/ROW]
[ROW][C]M5[/C][C]-22676.6000000000[/C][C]9273.746312[/C][C]-2.4452[/C][C]0.018195[/C][C]0.009097[/C][/ROW]
[ROW][C]M6[/C][C]-28908[/C][C]9273.746312[/C][C]-3.1172[/C][C]0.003082[/C][C]0.001541[/C][/ROW]
[ROW][C]M7[/C][C]-32499.2[/C][C]9273.746312[/C][C]-3.5044[/C][C]0.001002[/C][C]0.000501[/C][/ROW]
[ROW][C]M8[/C][C]-38532.2[/C][C]9273.746312[/C][C]-4.155[/C][C]0.000133[/C][C]6.7e-05[/C][/ROW]
[ROW][C]M9[/C][C]-37312.4[/C][C]9273.746312[/C][C]-4.0234[/C][C]0.000202[/C][C]0.000101[/C][/ROW]
[ROW][C]M10[/C][C]-4634.19999999999[/C][C]9273.746312[/C][C]-0.4997[/C][C]0.619561[/C][C]0.309781[/C][/ROW]
[ROW][C]M11[/C][C]2274.80000000000[/C][C]9273.746312[/C][C]0.2453[/C][C]0.807274[/C][C]0.403637[/C][/ROW]
[/TABLE]
Source: https://freestatistics.org/blog/index.php?pk=34008&T=2

Globally Unique Identifier (entire table): ba.freestatistics.org/blog/index.php?pk=34008&T=2

As an alternative you can also use a QR Code:  

The GUIDs for individual cells are displayed in the table below:

Multiple Linear Regression - Ordinary Least Squares
VariableParameterS.D.T-STATH0: parameter = 02-tail p-value1-tail p-value
(Intercept)144165.9816513766735.59374121.403600
plan-6282.954128440383846.295072-1.63350.1089050.054453
M1-8398.330275229288882.63798-0.94550.3491510.174575
M2-13362.29273.746312-1.44090.1561150.078058
M3-16822.69273.746312-1.8140.0759310.037965
M4-19023.49273.746312-2.05130.0457150.022857
M5-22676.60000000009273.746312-2.44520.0181950.009097
M6-289089273.746312-3.11720.0030820.001541
M7-32499.29273.746312-3.50440.0010020.000501
M8-38532.29273.746312-4.1550.0001336.7e-05
M9-37312.49273.746312-4.02340.0002020.000101
M10-4634.199999999999273.746312-0.49970.6195610.309781
M112274.800000000009273.7463120.24530.8072740.403637


Multiple Linear Regression - Regression Statistics
Multiple R0.727331643237498
R-squared0.529011319254558
Adjusted R-squared0.411264149068198
F-TEST (value)4.49277310373815
F-TEST (DF numerator)12
F-TEST (DF denominator)48
p-value8.41828926807509e-05
Multiple Linear Regression - Residual Statistics
Residual Standard Deviation14663.0803935306
Sum Squared Residuals10320284478.1028

\begin{tabular}{lllllllll}
\hline
Multiple Linear Regression - Regression Statistics \tabularnewline
Multiple R & 0.727331643237498 \tabularnewline
R-squared & 0.529011319254558 \tabularnewline
Adjusted R-squared & 0.411264149068198 \tabularnewline
F-TEST (value) & 4.49277310373815 \tabularnewline
F-TEST (DF numerator) & 12 \tabularnewline
F-TEST (DF denominator) & 48 \tabularnewline
p-value & 8.41828926807509e-05 \tabularnewline
Multiple Linear Regression - Residual Statistics \tabularnewline
Residual Standard Deviation & 14663.0803935306 \tabularnewline
Sum Squared Residuals & 10320284478.1028 \tabularnewline
\hline
\end{tabular}
%Source: https://freestatistics.org/blog/index.php?pk=34008&T=3

[TABLE]
[ROW][C]Multiple Linear Regression - Regression Statistics[/C][/ROW]
[ROW][C]Multiple R[/C][C]0.727331643237498[/C][/ROW]
[ROW][C]R-squared[/C][C]0.529011319254558[/C][/ROW]
[ROW][C]Adjusted R-squared[/C][C]0.411264149068198[/C][/ROW]
[ROW][C]F-TEST (value)[/C][C]4.49277310373815[/C][/ROW]
[ROW][C]F-TEST (DF numerator)[/C][C]12[/C][/ROW]
[ROW][C]F-TEST (DF denominator)[/C][C]48[/C][/ROW]
[ROW][C]p-value[/C][C]8.41828926807509e-05[/C][/ROW]
[ROW][C]Multiple Linear Regression - Residual Statistics[/C][/ROW]
[ROW][C]Residual Standard Deviation[/C][C]14663.0803935306[/C][/ROW]
[ROW][C]Sum Squared Residuals[/C][C]10320284478.1028[/C][/ROW]
[/TABLE]
Source: https://freestatistics.org/blog/index.php?pk=34008&T=3

Globally Unique Identifier (entire table): ba.freestatistics.org/blog/index.php?pk=34008&T=3

As an alternative you can also use a QR Code:  

The GUIDs for individual cells are displayed in the table below:

Multiple Linear Regression - Regression Statistics
Multiple R0.727331643237498
R-squared0.529011319254558
Adjusted R-squared0.411264149068198
F-TEST (value)4.49277310373815
F-TEST (DF numerator)12
F-TEST (DF denominator)48
p-value8.41828926807509e-05
Multiple Linear Regression - Residual Statistics
Residual Standard Deviation14663.0803935306
Sum Squared Residuals10320284478.1028


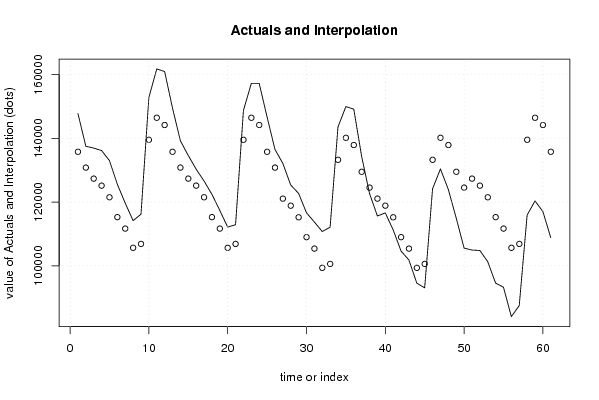
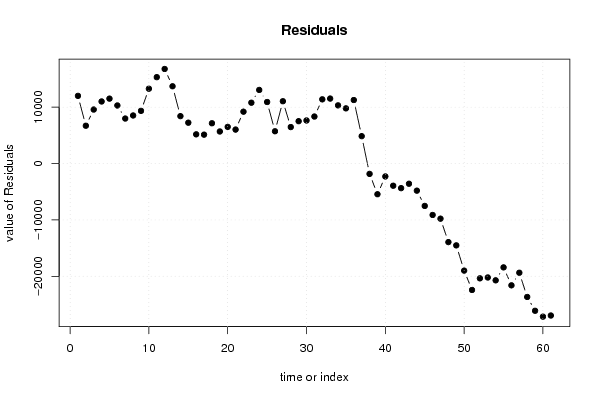
Multiple Linear Regression - Actuals, Interpolation, and Residuals
Time or IndexActualsInterpolationForecastResidualsPrediction Error
1147768135767.65137614612000.3486238536
2137507130803.7816513766703.21834862386
3136919127343.3816513769575.61834862384
4136151125142.58165137611008.4183486239
5133001121489.38165137611511.6183486238
6125554115257.98165137610296.0183486238
7119647111666.7816513767980.2183486239
8114158105633.7816513768524.21834862384
9116193106853.5816513769339.41834862386
10152803139531.78165137613271.2183486239
11161761146440.78165137615320.2183486239
12160942144165.98165137616776.0183486238
13149470135767.65137614713702.3486238531
14139208130803.7816513768404.21834862384
15134588127343.3816513767244.61834862385
16130322125142.5816513765179.41834862385
17126611121489.3816513765121.61834862385
18122401115257.9816513767143.01834862386
19117352111666.7816513765685.21834862383
20112135105633.7816513766501.21834862385
21112879106853.5816513766025.41834862385
22148729139531.7816513769197.21834862384
23157230146440.78165137610789.2183486238
24157221144165.98165137613055.0183486238
25146681135767.65137614710913.3486238531
26136524130803.7816513765720.21834862384
27132111121060.42752293611050.5724770642
28125326118859.6275229366466.37247706422
29122716115206.4275229367509.57247706423
30116615108975.0275229367639.97247706424
31113719105383.8275229368335.17247706421
3211073799350.827522935811386.1724770642
33112093100570.62752293611522.3724770642
34143565133248.82752293610316.1724770642
35149946140157.8275229369788.17247706423
36149147137883.02752293611263.9724770642
37134339129484.6972477064854.3027522935
38122683124520.827522936-1837.82752293578
39115614121060.427522936-5446.42752293577
40116566118859.627522936-2293.62752293577
41111272115206.427522936-3934.42752293577
42104609108975.027522936-4366.02752293576
43101802105383.827522936-3581.82752293578
449454299350.8275229358-4808.82752293577
4593051100570.627522936-7519.62752293578
46124129133248.827522936-9119.82752293578
47130374140157.827522936-9783.82752293578
48123946137883.027522936-13937.0275229358
49114971129484.697247706-14513.6972477065
50105531124520.827522936-18989.8275229358
51104919127343.381651376-22424.3816513762
52104782125142.581651376-20360.5816513761
53101281121489.381651376-20208.3816513761
5494545115257.981651376-20712.9816513761
5593248111666.781651376-18418.7816513762
5684031105633.781651376-21602.7816513762
5787486106853.581651376-19367.5816513762
58115867139531.781651376-23664.7816513762
59120327146440.781651376-26113.7816513762
60117008144165.981651376-27157.9816513761
61108811135767.651376147-26956.6513761469

\begin{tabular}{lllllllll}
\hline
Multiple Linear Regression - Actuals, Interpolation, and Residuals \tabularnewline
Time or Index & Actuals & InterpolationForecast & ResidualsPrediction Error \tabularnewline
1 & 147768 & 135767.651376146 & 12000.3486238536 \tabularnewline
2 & 137507 & 130803.781651376 & 6703.21834862386 \tabularnewline
3 & 136919 & 127343.381651376 & 9575.61834862384 \tabularnewline
4 & 136151 & 125142.581651376 & 11008.4183486239 \tabularnewline
5 & 133001 & 121489.381651376 & 11511.6183486238 \tabularnewline
6 & 125554 & 115257.981651376 & 10296.0183486238 \tabularnewline
7 & 119647 & 111666.781651376 & 7980.2183486239 \tabularnewline
8 & 114158 & 105633.781651376 & 8524.21834862384 \tabularnewline
9 & 116193 & 106853.581651376 & 9339.41834862386 \tabularnewline
10 & 152803 & 139531.781651376 & 13271.2183486239 \tabularnewline
11 & 161761 & 146440.781651376 & 15320.2183486239 \tabularnewline
12 & 160942 & 144165.981651376 & 16776.0183486238 \tabularnewline
13 & 149470 & 135767.651376147 & 13702.3486238531 \tabularnewline
14 & 139208 & 130803.781651376 & 8404.21834862384 \tabularnewline
15 & 134588 & 127343.381651376 & 7244.61834862385 \tabularnewline
16 & 130322 & 125142.581651376 & 5179.41834862385 \tabularnewline
17 & 126611 & 121489.381651376 & 5121.61834862385 \tabularnewline
18 & 122401 & 115257.981651376 & 7143.01834862386 \tabularnewline
19 & 117352 & 111666.781651376 & 5685.21834862383 \tabularnewline
20 & 112135 & 105633.781651376 & 6501.21834862385 \tabularnewline
21 & 112879 & 106853.581651376 & 6025.41834862385 \tabularnewline
22 & 148729 & 139531.781651376 & 9197.21834862384 \tabularnewline
23 & 157230 & 146440.781651376 & 10789.2183486238 \tabularnewline
24 & 157221 & 144165.981651376 & 13055.0183486238 \tabularnewline
25 & 146681 & 135767.651376147 & 10913.3486238531 \tabularnewline
26 & 136524 & 130803.781651376 & 5720.21834862384 \tabularnewline
27 & 132111 & 121060.427522936 & 11050.5724770642 \tabularnewline
28 & 125326 & 118859.627522936 & 6466.37247706422 \tabularnewline
29 & 122716 & 115206.427522936 & 7509.57247706423 \tabularnewline
30 & 116615 & 108975.027522936 & 7639.97247706424 \tabularnewline
31 & 113719 & 105383.827522936 & 8335.17247706421 \tabularnewline
32 & 110737 & 99350.8275229358 & 11386.1724770642 \tabularnewline
33 & 112093 & 100570.627522936 & 11522.3724770642 \tabularnewline
34 & 143565 & 133248.827522936 & 10316.1724770642 \tabularnewline
35 & 149946 & 140157.827522936 & 9788.17247706423 \tabularnewline
36 & 149147 & 137883.027522936 & 11263.9724770642 \tabularnewline
37 & 134339 & 129484.697247706 & 4854.3027522935 \tabularnewline
38 & 122683 & 124520.827522936 & -1837.82752293578 \tabularnewline
39 & 115614 & 121060.427522936 & -5446.42752293577 \tabularnewline
40 & 116566 & 118859.627522936 & -2293.62752293577 \tabularnewline
41 & 111272 & 115206.427522936 & -3934.42752293577 \tabularnewline
42 & 104609 & 108975.027522936 & -4366.02752293576 \tabularnewline
43 & 101802 & 105383.827522936 & -3581.82752293578 \tabularnewline
44 & 94542 & 99350.8275229358 & -4808.82752293577 \tabularnewline
45 & 93051 & 100570.627522936 & -7519.62752293578 \tabularnewline
46 & 124129 & 133248.827522936 & -9119.82752293578 \tabularnewline
47 & 130374 & 140157.827522936 & -9783.82752293578 \tabularnewline
48 & 123946 & 137883.027522936 & -13937.0275229358 \tabularnewline
49 & 114971 & 129484.697247706 & -14513.6972477065 \tabularnewline
50 & 105531 & 124520.827522936 & -18989.8275229358 \tabularnewline
51 & 104919 & 127343.381651376 & -22424.3816513762 \tabularnewline
52 & 104782 & 125142.581651376 & -20360.5816513761 \tabularnewline
53 & 101281 & 121489.381651376 & -20208.3816513761 \tabularnewline
54 & 94545 & 115257.981651376 & -20712.9816513761 \tabularnewline
55 & 93248 & 111666.781651376 & -18418.7816513762 \tabularnewline
56 & 84031 & 105633.781651376 & -21602.7816513762 \tabularnewline
57 & 87486 & 106853.581651376 & -19367.5816513762 \tabularnewline
58 & 115867 & 139531.781651376 & -23664.7816513762 \tabularnewline
59 & 120327 & 146440.781651376 & -26113.7816513762 \tabularnewline
60 & 117008 & 144165.981651376 & -27157.9816513761 \tabularnewline
61 & 108811 & 135767.651376147 & -26956.6513761469 \tabularnewline
\hline
\end{tabular}
%Source: https://freestatistics.org/blog/index.php?pk=34008&T=4

[TABLE]
[ROW][C]Multiple Linear Regression - Actuals, Interpolation, and Residuals[/C][/ROW]
[ROW][C]Time or Index[/C][C]Actuals[/C][C]InterpolationForecast[/C][C]ResidualsPrediction Error[/C][/ROW]
[ROW][C]1[/C][C]147768[/C][C]135767.651376146[/C][C]12000.3486238536[/C][/ROW]
[ROW][C]2[/C][C]137507[/C][C]130803.781651376[/C][C]6703.21834862386[/C][/ROW]
[ROW][C]3[/C][C]136919[/C][C]127343.381651376[/C][C]9575.61834862384[/C][/ROW]
[ROW][C]4[/C][C]136151[/C][C]125142.581651376[/C][C]11008.4183486239[/C][/ROW]
[ROW][C]5[/C][C]133001[/C][C]121489.381651376[/C][C]11511.6183486238[/C][/ROW]
[ROW][C]6[/C][C]125554[/C][C]115257.981651376[/C][C]10296.0183486238[/C][/ROW]
[ROW][C]7[/C][C]119647[/C][C]111666.781651376[/C][C]7980.2183486239[/C][/ROW]
[ROW][C]8[/C][C]114158[/C][C]105633.781651376[/C][C]8524.21834862384[/C][/ROW]
[ROW][C]9[/C][C]116193[/C][C]106853.581651376[/C][C]9339.41834862386[/C][/ROW]
[ROW][C]10[/C][C]152803[/C][C]139531.781651376[/C][C]13271.2183486239[/C][/ROW]
[ROW][C]11[/C][C]161761[/C][C]146440.781651376[/C][C]15320.2183486239[/C][/ROW]
[ROW][C]12[/C][C]160942[/C][C]144165.981651376[/C][C]16776.0183486238[/C][/ROW]
[ROW][C]13[/C][C]149470[/C][C]135767.651376147[/C][C]13702.3486238531[/C][/ROW]
[ROW][C]14[/C][C]139208[/C][C]130803.781651376[/C][C]8404.21834862384[/C][/ROW]
[ROW][C]15[/C][C]134588[/C][C]127343.381651376[/C][C]7244.61834862385[/C][/ROW]
[ROW][C]16[/C][C]130322[/C][C]125142.581651376[/C][C]5179.41834862385[/C][/ROW]
[ROW][C]17[/C][C]126611[/C][C]121489.381651376[/C][C]5121.61834862385[/C][/ROW]
[ROW][C]18[/C][C]122401[/C][C]115257.981651376[/C][C]7143.01834862386[/C][/ROW]
[ROW][C]19[/C][C]117352[/C][C]111666.781651376[/C][C]5685.21834862383[/C][/ROW]
[ROW][C]20[/C][C]112135[/C][C]105633.781651376[/C][C]6501.21834862385[/C][/ROW]
[ROW][C]21[/C][C]112879[/C][C]106853.581651376[/C][C]6025.41834862385[/C][/ROW]
[ROW][C]22[/C][C]148729[/C][C]139531.781651376[/C][C]9197.21834862384[/C][/ROW]
[ROW][C]23[/C][C]157230[/C][C]146440.781651376[/C][C]10789.2183486238[/C][/ROW]
[ROW][C]24[/C][C]157221[/C][C]144165.981651376[/C][C]13055.0183486238[/C][/ROW]
[ROW][C]25[/C][C]146681[/C][C]135767.651376147[/C][C]10913.3486238531[/C][/ROW]
[ROW][C]26[/C][C]136524[/C][C]130803.781651376[/C][C]5720.21834862384[/C][/ROW]
[ROW][C]27[/C][C]132111[/C][C]121060.427522936[/C][C]11050.5724770642[/C][/ROW]
[ROW][C]28[/C][C]125326[/C][C]118859.627522936[/C][C]6466.37247706422[/C][/ROW]
[ROW][C]29[/C][C]122716[/C][C]115206.427522936[/C][C]7509.57247706423[/C][/ROW]
[ROW][C]30[/C][C]116615[/C][C]108975.027522936[/C][C]7639.97247706424[/C][/ROW]
[ROW][C]31[/C][C]113719[/C][C]105383.827522936[/C][C]8335.17247706421[/C][/ROW]
[ROW][C]32[/C][C]110737[/C][C]99350.8275229358[/C][C]11386.1724770642[/C][/ROW]
[ROW][C]33[/C][C]112093[/C][C]100570.627522936[/C][C]11522.3724770642[/C][/ROW]
[ROW][C]34[/C][C]143565[/C][C]133248.827522936[/C][C]10316.1724770642[/C][/ROW]
[ROW][C]35[/C][C]149946[/C][C]140157.827522936[/C][C]9788.17247706423[/C][/ROW]
[ROW][C]36[/C][C]149147[/C][C]137883.027522936[/C][C]11263.9724770642[/C][/ROW]
[ROW][C]37[/C][C]134339[/C][C]129484.697247706[/C][C]4854.3027522935[/C][/ROW]
[ROW][C]38[/C][C]122683[/C][C]124520.827522936[/C][C]-1837.82752293578[/C][/ROW]
[ROW][C]39[/C][C]115614[/C][C]121060.427522936[/C][C]-5446.42752293577[/C][/ROW]
[ROW][C]40[/C][C]116566[/C][C]118859.627522936[/C][C]-2293.62752293577[/C][/ROW]
[ROW][C]41[/C][C]111272[/C][C]115206.427522936[/C][C]-3934.42752293577[/C][/ROW]
[ROW][C]42[/C][C]104609[/C][C]108975.027522936[/C][C]-4366.02752293576[/C][/ROW]
[ROW][C]43[/C][C]101802[/C][C]105383.827522936[/C][C]-3581.82752293578[/C][/ROW]
[ROW][C]44[/C][C]94542[/C][C]99350.8275229358[/C][C]-4808.82752293577[/C][/ROW]
[ROW][C]45[/C][C]93051[/C][C]100570.627522936[/C][C]-7519.62752293578[/C][/ROW]
[ROW][C]46[/C][C]124129[/C][C]133248.827522936[/C][C]-9119.82752293578[/C][/ROW]
[ROW][C]47[/C][C]130374[/C][C]140157.827522936[/C][C]-9783.82752293578[/C][/ROW]
[ROW][C]48[/C][C]123946[/C][C]137883.027522936[/C][C]-13937.0275229358[/C][/ROW]
[ROW][C]49[/C][C]114971[/C][C]129484.697247706[/C][C]-14513.6972477065[/C][/ROW]
[ROW][C]50[/C][C]105531[/C][C]124520.827522936[/C][C]-18989.8275229358[/C][/ROW]
[ROW][C]51[/C][C]104919[/C][C]127343.381651376[/C][C]-22424.3816513762[/C][/ROW]
[ROW][C]52[/C][C]104782[/C][C]125142.581651376[/C][C]-20360.5816513761[/C][/ROW]
[ROW][C]53[/C][C]101281[/C][C]121489.381651376[/C][C]-20208.3816513761[/C][/ROW]
[ROW][C]54[/C][C]94545[/C][C]115257.981651376[/C][C]-20712.9816513761[/C][/ROW]
[ROW][C]55[/C][C]93248[/C][C]111666.781651376[/C][C]-18418.7816513762[/C][/ROW]
[ROW][C]56[/C][C]84031[/C][C]105633.781651376[/C][C]-21602.7816513762[/C][/ROW]
[ROW][C]57[/C][C]87486[/C][C]106853.581651376[/C][C]-19367.5816513762[/C][/ROW]
[ROW][C]58[/C][C]115867[/C][C]139531.781651376[/C][C]-23664.7816513762[/C][/ROW]
[ROW][C]59[/C][C]120327[/C][C]146440.781651376[/C][C]-26113.7816513762[/C][/ROW]
[ROW][C]60[/C][C]117008[/C][C]144165.981651376[/C][C]-27157.9816513761[/C][/ROW]
[ROW][C]61[/C][C]108811[/C][C]135767.651376147[/C][C]-26956.6513761469[/C][/ROW]
[/TABLE]
Source: https://freestatistics.org/blog/index.php?pk=34008&T=4

Globally Unique Identifier (entire table): ba.freestatistics.org/blog/index.php?pk=34008&T=4

As an alternative you can also use a QR Code:  

The GUIDs for individual cells are displayed in the table below:

Multiple Linear Regression - Actuals, Interpolation, and Residuals
Time or IndexActualsInterpolationForecastResidualsPrediction Error
1147768135767.65137614612000.3486238536
2137507130803.7816513766703.21834862386
3136919127343.3816513769575.61834862384
4136151125142.58165137611008.4183486239
5133001121489.38165137611511.6183486238
6125554115257.98165137610296.0183486238
7119647111666.7816513767980.2183486239
8114158105633.7816513768524.21834862384
9116193106853.5816513769339.41834862386
10152803139531.78165137613271.2183486239
11161761146440.78165137615320.2183486239
12160942144165.98165137616776.0183486238
13149470135767.65137614713702.3486238531
14139208130803.7816513768404.21834862384
15134588127343.3816513767244.61834862385
16130322125142.5816513765179.41834862385
17126611121489.3816513765121.61834862385
18122401115257.9816513767143.01834862386
19117352111666.7816513765685.21834862383
20112135105633.7816513766501.21834862385
21112879106853.5816513766025.41834862385
22148729139531.7816513769197.21834862384
23157230146440.78165137610789.2183486238
24157221144165.98165137613055.0183486238
25146681135767.65137614710913.3486238531
26136524130803.7816513765720.21834862384
27132111121060.42752293611050.5724770642
28125326118859.6275229366466.37247706422
29122716115206.4275229367509.57247706423
30116615108975.0275229367639.97247706424
31113719105383.8275229368335.17247706421
3211073799350.827522935811386.1724770642
33112093100570.62752293611522.3724770642
34143565133248.82752293610316.1724770642
35149946140157.8275229369788.17247706423
36149147137883.02752293611263.9724770642
37134339129484.6972477064854.3027522935
38122683124520.827522936-1837.82752293578
39115614121060.427522936-5446.42752293577
40116566118859.627522936-2293.62752293577
41111272115206.427522936-3934.42752293577
42104609108975.027522936-4366.02752293576
43101802105383.827522936-3581.82752293578
449454299350.8275229358-4808.82752293577
4593051100570.627522936-7519.62752293578
46124129133248.827522936-9119.82752293578
47130374140157.827522936-9783.82752293578
48123946137883.027522936-13937.0275229358
49114971129484.697247706-14513.6972477065
50105531124520.827522936-18989.8275229358
51104919127343.381651376-22424.3816513762
52104782125142.581651376-20360.5816513761
53101281121489.381651376-20208.3816513761
5494545115257.981651376-20712.9816513761
5593248111666.781651376-18418.7816513762
5684031105633.781651376-21602.7816513762
5787486106853.581651376-19367.5816513762
58115867139531.781651376-23664.7816513762
59120327146440.781651376-26113.7816513762
60117008144165.981651376-27157.9816513761
61108811135767.651376147-26956.6513761469


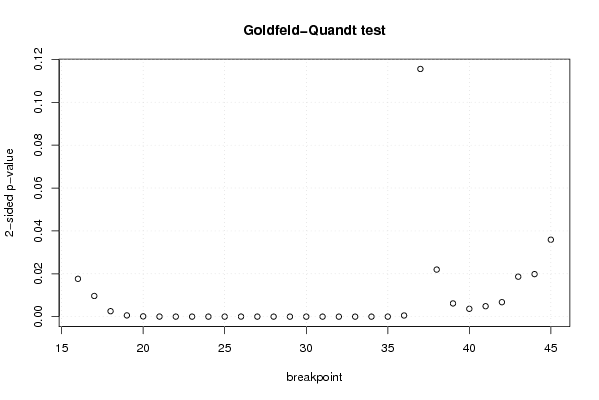
Goldfeld-Quandt test for Heteroskedasticity
p-valuesAlternative Hypothesis
breakpoint indexgreater2-sidedless
160.008820807976430450.01764161595286090.99117919202357
170.004821471065270090.009642942130540190.99517852893473
180.001276159610651380.002552319221302760.998723840389349
190.0002953851280632920.0005907702561265840.999704614871937
206.73515154025049e-050.0001347030308050100.999932648484598
211.96526813697159e-053.93053627394317e-050.99998034731863
228.5769595937616e-061.71539191875232e-050.999991423040406
235.58460518281842e-061.11692103656368e-050.999994415394817
244.9765486545346e-069.9530973090692e-060.999995023451345
256.49648443493955e-061.29929688698791e-050.999993503515565
262.22007871263886e-054.44015742527772e-050.999977799212874
279.17698465049532e-061.83539693009906e-050.99999082301535
284.16061106652268e-068.32122213304537e-060.999995839388933
291.39350312557830e-062.78700625115660e-060.999998606496874
304.79244791480477e-079.58489582960954e-070.999999520755209
311.70147361902759e-073.40294723805518e-070.999999829852638
321.69571379731459e-073.39142759462919e-070.99999983042862
331.77895780806861e-073.55791561613722e-070.99999982210422
342.75979605388008e-075.51959210776016e-070.999999724020395
351.81743050074962e-063.63486100149924e-060.9999981825695
360.0002739476287674520.0005478952575349050.999726052371233
370.05777240339516690.1155448067903340.942227596604833
380.989017849676210.02196430064758150.0109821503237908
390.9969166568205670.006166686358866740.00308334317943337
400.9981754491434040.003649101713192490.00182455085659625
410.9975661070150210.004867785969957660.00243389298497883
420.996626924763360.006746150473278570.00337307523663929
430.9906743821514340.01865123569713280.0093256178485664
440.9900798988527720.01984020229445510.00992010114722757
450.9820554745469540.03588905090609260.0179445254530463

\begin{tabular}{lllllllll}
\hline
Goldfeld-Quandt test for Heteroskedasticity \tabularnewline
p-values & Alternative Hypothesis \tabularnewline
breakpoint index & greater & 2-sided & less \tabularnewline
16 & 0.00882080797643045 & 0.0176416159528609 & 0.99117919202357 \tabularnewline
17 & 0.00482147106527009 & 0.00964294213054019 & 0.99517852893473 \tabularnewline
18 & 0.00127615961065138 & 0.00255231922130276 & 0.998723840389349 \tabularnewline
19 & 0.000295385128063292 & 0.000590770256126584 & 0.999704614871937 \tabularnewline
20 & 6.73515154025049e-05 & 0.000134703030805010 & 0.999932648484598 \tabularnewline
21 & 1.96526813697159e-05 & 3.93053627394317e-05 & 0.99998034731863 \tabularnewline
22 & 8.5769595937616e-06 & 1.71539191875232e-05 & 0.999991423040406 \tabularnewline
23 & 5.58460518281842e-06 & 1.11692103656368e-05 & 0.999994415394817 \tabularnewline
24 & 4.9765486545346e-06 & 9.9530973090692e-06 & 0.999995023451345 \tabularnewline
25 & 6.49648443493955e-06 & 1.29929688698791e-05 & 0.999993503515565 \tabularnewline
26 & 2.22007871263886e-05 & 4.44015742527772e-05 & 0.999977799212874 \tabularnewline
27 & 9.17698465049532e-06 & 1.83539693009906e-05 & 0.99999082301535 \tabularnewline
28 & 4.16061106652268e-06 & 8.32122213304537e-06 & 0.999995839388933 \tabularnewline
29 & 1.39350312557830e-06 & 2.78700625115660e-06 & 0.999998606496874 \tabularnewline
30 & 4.79244791480477e-07 & 9.58489582960954e-07 & 0.999999520755209 \tabularnewline
31 & 1.70147361902759e-07 & 3.40294723805518e-07 & 0.999999829852638 \tabularnewline
32 & 1.69571379731459e-07 & 3.39142759462919e-07 & 0.99999983042862 \tabularnewline
33 & 1.77895780806861e-07 & 3.55791561613722e-07 & 0.99999982210422 \tabularnewline
34 & 2.75979605388008e-07 & 5.51959210776016e-07 & 0.999999724020395 \tabularnewline
35 & 1.81743050074962e-06 & 3.63486100149924e-06 & 0.9999981825695 \tabularnewline
36 & 0.000273947628767452 & 0.000547895257534905 & 0.999726052371233 \tabularnewline
37 & 0.0577724033951669 & 0.115544806790334 & 0.942227596604833 \tabularnewline
38 & 0.98901784967621 & 0.0219643006475815 & 0.0109821503237908 \tabularnewline
39 & 0.996916656820567 & 0.00616668635886674 & 0.00308334317943337 \tabularnewline
40 & 0.998175449143404 & 0.00364910171319249 & 0.00182455085659625 \tabularnewline
41 & 0.997566107015021 & 0.00486778596995766 & 0.00243389298497883 \tabularnewline
42 & 0.99662692476336 & 0.00674615047327857 & 0.00337307523663929 \tabularnewline
43 & 0.990674382151434 & 0.0186512356971328 & 0.0093256178485664 \tabularnewline
44 & 0.990079898852772 & 0.0198402022944551 & 0.00992010114722757 \tabularnewline
45 & 0.982055474546954 & 0.0358890509060926 & 0.0179445254530463 \tabularnewline
\hline
\end{tabular}
%Source: https://freestatistics.org/blog/index.php?pk=34008&T=5

[TABLE]
[ROW][C]Goldfeld-Quandt test for Heteroskedasticity[/C][/ROW]
[ROW][C]p-values[/C][C]Alternative Hypothesis[/C][/ROW]
[ROW][C]breakpoint index[/C][C]greater[/C][C]2-sided[/C][C]less[/C][/ROW]
[ROW][C]16[/C][C]0.00882080797643045[/C][C]0.0176416159528609[/C][C]0.99117919202357[/C][/ROW]
[ROW][C]17[/C][C]0.00482147106527009[/C][C]0.00964294213054019[/C][C]0.99517852893473[/C][/ROW]
[ROW][C]18[/C][C]0.00127615961065138[/C][C]0.00255231922130276[/C][C]0.998723840389349[/C][/ROW]
[ROW][C]19[/C][C]0.000295385128063292[/C][C]0.000590770256126584[/C][C]0.999704614871937[/C][/ROW]
[ROW][C]20[/C][C]6.73515154025049e-05[/C][C]0.000134703030805010[/C][C]0.999932648484598[/C][/ROW]
[ROW][C]21[/C][C]1.96526813697159e-05[/C][C]3.93053627394317e-05[/C][C]0.99998034731863[/C][/ROW]
[ROW][C]22[/C][C]8.5769595937616e-06[/C][C]1.71539191875232e-05[/C][C]0.999991423040406[/C][/ROW]
[ROW][C]23[/C][C]5.58460518281842e-06[/C][C]1.11692103656368e-05[/C][C]0.999994415394817[/C][/ROW]
[ROW][C]24[/C][C]4.9765486545346e-06[/C][C]9.9530973090692e-06[/C][C]0.999995023451345[/C][/ROW]
[ROW][C]25[/C][C]6.49648443493955e-06[/C][C]1.29929688698791e-05[/C][C]0.999993503515565[/C][/ROW]
[ROW][C]26[/C][C]2.22007871263886e-05[/C][C]4.44015742527772e-05[/C][C]0.999977799212874[/C][/ROW]
[ROW][C]27[/C][C]9.17698465049532e-06[/C][C]1.83539693009906e-05[/C][C]0.99999082301535[/C][/ROW]
[ROW][C]28[/C][C]4.16061106652268e-06[/C][C]8.32122213304537e-06[/C][C]0.999995839388933[/C][/ROW]
[ROW][C]29[/C][C]1.39350312557830e-06[/C][C]2.78700625115660e-06[/C][C]0.999998606496874[/C][/ROW]
[ROW][C]30[/C][C]4.79244791480477e-07[/C][C]9.58489582960954e-07[/C][C]0.999999520755209[/C][/ROW]
[ROW][C]31[/C][C]1.70147361902759e-07[/C][C]3.40294723805518e-07[/C][C]0.999999829852638[/C][/ROW]
[ROW][C]32[/C][C]1.69571379731459e-07[/C][C]3.39142759462919e-07[/C][C]0.99999983042862[/C][/ROW]
[ROW][C]33[/C][C]1.77895780806861e-07[/C][C]3.55791561613722e-07[/C][C]0.99999982210422[/C][/ROW]
[ROW][C]34[/C][C]2.75979605388008e-07[/C][C]5.51959210776016e-07[/C][C]0.999999724020395[/C][/ROW]
[ROW][C]35[/C][C]1.81743050074962e-06[/C][C]3.63486100149924e-06[/C][C]0.9999981825695[/C][/ROW]
[ROW][C]36[/C][C]0.000273947628767452[/C][C]0.000547895257534905[/C][C]0.999726052371233[/C][/ROW]
[ROW][C]37[/C][C]0.0577724033951669[/C][C]0.115544806790334[/C][C]0.942227596604833[/C][/ROW]
[ROW][C]38[/C][C]0.98901784967621[/C][C]0.0219643006475815[/C][C]0.0109821503237908[/C][/ROW]
[ROW][C]39[/C][C]0.996916656820567[/C][C]0.00616668635886674[/C][C]0.00308334317943337[/C][/ROW]
[ROW][C]40[/C][C]0.998175449143404[/C][C]0.00364910171319249[/C][C]0.00182455085659625[/C][/ROW]
[ROW][C]41[/C][C]0.997566107015021[/C][C]0.00486778596995766[/C][C]0.00243389298497883[/C][/ROW]
[ROW][C]42[/C][C]0.99662692476336[/C][C]0.00674615047327857[/C][C]0.00337307523663929[/C][/ROW]
[ROW][C]43[/C][C]0.990674382151434[/C][C]0.0186512356971328[/C][C]0.0093256178485664[/C][/ROW]
[ROW][C]44[/C][C]0.990079898852772[/C][C]0.0198402022944551[/C][C]0.00992010114722757[/C][/ROW]
[ROW][C]45[/C][C]0.982055474546954[/C][C]0.0358890509060926[/C][C]0.0179445254530463[/C][/ROW]
[/TABLE]
Source: https://freestatistics.org/blog/index.php?pk=34008&T=5

Globally Unique Identifier (entire table): ba.freestatistics.org/blog/index.php?pk=34008&T=5

As an alternative you can also use a QR Code:  

The GUIDs for individual cells are displayed in the table below:

Goldfeld-Quandt test for Heteroskedasticity
p-valuesAlternative Hypothesis
breakpoint indexgreater2-sidedless
160.008820807976430450.01764161595286090.99117919202357
170.004821471065270090.009642942130540190.99517852893473
180.001276159610651380.002552319221302760.998723840389349
190.0002953851280632920.0005907702561265840.999704614871937
206.73515154025049e-050.0001347030308050100.999932648484598
211.96526813697159e-053.93053627394317e-050.99998034731863
228.5769595937616e-061.71539191875232e-050.999991423040406
235.58460518281842e-061.11692103656368e-050.999994415394817
244.9765486545346e-069.9530973090692e-060.999995023451345
256.49648443493955e-061.29929688698791e-050.999993503515565
262.22007871263886e-054.44015742527772e-050.999977799212874
279.17698465049532e-061.83539693009906e-050.99999082301535
284.16061106652268e-068.32122213304537e-060.999995839388933
291.39350312557830e-062.78700625115660e-060.999998606496874
304.79244791480477e-079.58489582960954e-070.999999520755209
311.70147361902759e-073.40294723805518e-070.999999829852638
321.69571379731459e-073.39142759462919e-070.99999983042862
331.77895780806861e-073.55791561613722e-070.99999982210422
342.75979605388008e-075.51959210776016e-070.999999724020395
351.81743050074962e-063.63486100149924e-060.9999981825695
360.0002739476287674520.0005478952575349050.999726052371233
370.05777240339516690.1155448067903340.942227596604833
380.989017849676210.02196430064758150.0109821503237908
390.9969166568205670.006166686358866740.00308334317943337
400.9981754491434040.003649101713192490.00182455085659625
410.9975661070150210.004867785969957660.00243389298497883
420.996626924763360.006746150473278570.00337307523663929
430.9906743821514340.01865123569713280.0093256178485664
440.9900798988527720.01984020229445510.00992010114722757
450.9820554745469540.03588905090609260.0179445254530463


Meta Analysis of Goldfeld-Quandt test for Heteroskedasticity
Description# significant tests% significant testsOK/NOK
1% type I error level240.8NOK
5% type I error level290.966666666666667NOK
10% type I error level290.966666666666667NOK

\begin{tabular}{lllllllll}
\hline
Meta Analysis of Goldfeld-Quandt test for Heteroskedasticity \tabularnewline
Description & # significant tests & % significant tests & OK/NOK \tabularnewline
1% type I error level & 24 & 0.8 & NOK \tabularnewline
5% type I error level & 29 & 0.966666666666667 & NOK \tabularnewline
10% type I error level & 29 & 0.966666666666667 & NOK \tabularnewline
\hline
\end{tabular}
%Source: https://freestatistics.org/blog/index.php?pk=34008&T=6

[TABLE]
[ROW][C]Meta Analysis of Goldfeld-Quandt test for Heteroskedasticity[/C][/ROW]
[ROW][C]Description[/C][C]# significant tests[/C][C]% significant tests[/C][C]OK/NOK[/C][/ROW]
[ROW][C]1% type I error level[/C][C]24[/C][C]0.8[/C][C]NOK[/C][/ROW]
[ROW][C]5% type I error level[/C][C]29[/C][C]0.966666666666667[/C][C]NOK[/C][/ROW]
[ROW][C]10% type I error level[/C][C]29[/C][C]0.966666666666667[/C][C]NOK[/C][/ROW]
[/TABLE]
Source: https://freestatistics.org/blog/index.php?pk=34008&T=6

Globally Unique Identifier (entire table): ba.freestatistics.org/blog/index.php?pk=34008&T=6

As an alternative you can also use a QR Code:  

The GUIDs for individual cells are displayed in the table below:

Meta Analysis of Goldfeld-Quandt test for Heteroskedasticity
Description# significant tests% significant testsOK/NOK
1% type I error level240.8NOK
5% type I error level290.966666666666667NOK
10% type I error level290.966666666666667NOK


Parameters (Session):
par1 = 1 ; par2 = Include Monthly Dummies ; par3 = No Linear Trend ;
Parameters (R input):
par1 = 1 ; par2 = Include Monthly Dummies ; par3 = No Linear Trend ;
R code (references can be found in the software module):
library(lattice)
library(lmtest)
n25 <- 25 #minimum number of obs. for Goldfeld-Quandt test
par1 <- as.numeric(par1)
x <- t(y)
k <- length(x[1,])
n <- length(x[,1])
x1 <- cbind(x[,par1], x[,1:k!=par1])
mycolnames <- c(colnames(x)[par1], colnames(x)[1:k!=par1])
colnames(x1) <- mycolnames #colnames(x)[par1]
x <- x1
if (par3 == 'First Differences'){
x2 <- array(0, dim=c(n-1,k), dimnames=list(1:(n-1), paste('(1-B)',colnames(x),sep='')))
for (i in 1:n-1) {
for (j in 1:k) {
x2[i,j] <- x[i+1,j] - x[i,j]
}
}
x <- x2
}
if (par2 == 'Include Monthly Dummies'){
x2 <- array(0, dim=c(n,11), dimnames=list(1:n, paste('M', seq(1:11), sep ='')))
for (i in 1:11){
x2[seq(i,n,12),i] <- 1
}
x <- cbind(x, x2)
}
if (par2 == 'Include Quarterly Dummies'){
x2 <- array(0, dim=c(n,3), dimnames=list(1:n, paste('Q', seq(1:3), sep ='')))
for (i in 1:3){
x2[seq(i,n,4),i] <- 1
}
x <- cbind(x, x2)
}
k <- length(x[1,])
if (par3 == 'Linear Trend'){
x <- cbind(x, c(1:n))
colnames(x)[k+1] <- 't'
}
x
k <- length(x[1,])
df <- as.data.frame(x)
(mylm <- lm(df))
(mysum <- summary(mylm))
if (n > n25) {
kp3 <- k + 3
nmkm3 <- n - k - 3
gqarr <- array(NA, dim=c(nmkm3-kp3+1,3))
numgqtests <- 0
numsignificant1 <- 0
numsignificant5 <- 0
numsignificant10 <- 0
for (mypoint in kp3:nmkm3) {
j <- 0
numgqtests <- numgqtests + 1
for (myalt in c('greater', 'two.sided', 'less')) {
j <- j + 1
gqarr[mypoint-kp3+1,j] <- gqtest(mylm, point=mypoint, alternative=myalt)$p.value
}
if (gqarr[mypoint-kp3+1,2] < 0.01) numsignificant1 <- numsignificant1 + 1
if (gqarr[mypoint-kp3+1,2] < 0.05) numsignificant5 <- numsignificant5 + 1
if (gqarr[mypoint-kp3+1,2] < 0.10) numsignificant10 <- numsignificant10 + 1
}
gqarr
}
bitmap(file='test0.png')
plot(x[,1], type='l', main='Actuals and Interpolation', ylab='value of Actuals and Interpolation (dots)', xlab='time or index')
points(x[,1]-mysum$resid)
grid()
dev.off()
bitmap(file='test1.png')
plot(mysum$resid, type='b', pch=19, main='Residuals', ylab='value of Residuals', xlab='time or index')
grid()
dev.off()
bitmap(file='test2.png')
hist(mysum$resid, main='Residual Histogram', xlab='values of Residuals')
grid()
dev.off()
bitmap(file='test3.png')
densityplot(~mysum$resid,col='black',main='Residual Density Plot', xlab='values of Residuals')
dev.off()
bitmap(file='test4.png')
qqnorm(mysum$resid, main='Residual Normal Q-Q Plot')
qqline(mysum$resid)
grid()
dev.off()
(myerror <- as.ts(mysum$resid))
bitmap(file='test5.png')
dum <- cbind(lag(myerror,k=1),myerror)
dum
dum1 <- dum[2:length(myerror),]
dum1
z <- as.data.frame(dum1)
z
plot(z,main=paste('Residual Lag plot, lowess, and regression line'), ylab='values of Residuals', xlab='lagged values of Residuals')
lines(lowess(z))
abline(lm(z))
grid()
dev.off()
bitmap(file='test6.png')
acf(mysum$resid, lag.max=length(mysum$resid)/2, main='Residual Autocorrelation Function')
grid()
dev.off()
bitmap(file='test7.png')
pacf(mysum$resid, lag.max=length(mysum$resid)/2, main='Residual Partial Autocorrelation Function')
grid()
dev.off()
bitmap(file='test8.png')
opar <- par(mfrow = c(2,2), oma = c(0, 0, 1.1, 0))
plot(mylm, las = 1, sub='Residual Diagnostics')
par(opar)
dev.off()
if (n > n25) {
bitmap(file='test9.png')
plot(kp3:nmkm3,gqarr[,2], main='Goldfeld-Quandt test',ylab='2-sided p-value',xlab='breakpoint')
grid()
dev.off()
}
load(file='createtable')
a<-table.start()
a<-table.row.start(a)
a<-table.element(a, 'Multiple Linear Regression - Estimated Regression Equation', 1, TRUE)
a<-table.row.end(a)
myeq <- colnames(x)[1]
myeq <- paste(myeq, '[t] = ', sep='')
for (i in 1:k){
if (mysum$coefficients[i,1] > 0) myeq <- paste(myeq, '+', '')
myeq <- paste(myeq, mysum$coefficients[i,1], sep=' ')
if (rownames(mysum$coefficients)[i] != '(Intercept)') {
myeq <- paste(myeq, rownames(mysum$coefficients)[i], sep='')
if (rownames(mysum$coefficients)[i] != 't') myeq <- paste(myeq, '[t]', sep='')
}
}
myeq <- paste(myeq, ' + e[t]')
a<-table.row.start(a)
a<-table.element(a, myeq)
a<-table.row.end(a)
a<-table.end(a)
table.save(a,file='mytable1.tab')
a<-table.start()
a<-table.row.start(a)
a<-table.element(a,hyperlink('ols1.htm','Multiple Linear Regression - Ordinary Least Squares',''), 6, TRUE)
a<-table.row.end(a)
a<-table.row.start(a)
a<-table.element(a,'Variable',header=TRUE)
a<-table.element(a,'Parameter',header=TRUE)
a<-table.element(a,'S.D.',header=TRUE)
a<-table.element(a,'T-STAT
H0: parameter = 0',header=TRUE)
a<-table.element(a,'2-tail p-value',header=TRUE)
a<-table.element(a,'1-tail p-value',header=TRUE)
a<-table.row.end(a)
for (i in 1:k){
a<-table.row.start(a)
a<-table.element(a,rownames(mysum$coefficients)[i],header=TRUE)
a<-table.element(a,mysum$coefficients[i,1])
a<-table.element(a, round(mysum$coefficients[i,2],6))
a<-table.element(a, round(mysum$coefficients[i,3],4))
a<-table.element(a, round(mysum$coefficients[i,4],6))
a<-table.element(a, round(mysum$coefficients[i,4]/2,6))
a<-table.row.end(a)
}
a<-table.end(a)
table.save(a,file='mytable2.tab')
a<-table.start()
a<-table.row.start(a)
a<-table.element(a, 'Multiple Linear Regression - Regression Statistics', 2, TRUE)
a<-table.row.end(a)
a<-table.row.start(a)
a<-table.element(a, 'Multiple R',1,TRUE)
a<-table.element(a, sqrt(mysum$r.squared))
a<-table.row.end(a)
a<-table.row.start(a)
a<-table.element(a, 'R-squared',1,TRUE)
a<-table.element(a, mysum$r.squared)
a<-table.row.end(a)
a<-table.row.start(a)
a<-table.element(a, 'Adjusted R-squared',1,TRUE)
a<-table.element(a, mysum$adj.r.squared)
a<-table.row.end(a)
a<-table.row.start(a)
a<-table.element(a, 'F-TEST (value)',1,TRUE)
a<-table.element(a, mysum$fstatistic[1])
a<-table.row.end(a)
a<-table.row.start(a)
a<-table.element(a, 'F-TEST (DF numerator)',1,TRUE)
a<-table.element(a, mysum$fstatistic[2])
a<-table.row.end(a)
a<-table.row.start(a)
a<-table.element(a, 'F-TEST (DF denominator)',1,TRUE)
a<-table.element(a, mysum$fstatistic[3])
a<-table.row.end(a)
a<-table.row.start(a)
a<-table.element(a, 'p-value',1,TRUE)
a<-table.element(a, 1-pf(mysum$fstatistic[1],mysum$fstatistic[2],mysum$fstatistic[3]))
a<-table.row.end(a)
a<-table.row.start(a)
a<-table.element(a, 'Multiple Linear Regression - Residual Statistics', 2, TRUE)
a<-table.row.end(a)
a<-table.row.start(a)
a<-table.element(a, 'Residual Standard Deviation',1,TRUE)
a<-table.element(a, mysum$sigma)
a<-table.row.end(a)
a<-table.row.start(a)
a<-table.element(a, 'Sum Squared Residuals',1,TRUE)
a<-table.element(a, sum(myerror*myerror))
a<-table.row.end(a)
a<-table.end(a)
table.save(a,file='mytable3.tab')
a<-table.start()
a<-table.row.start(a)
a<-table.element(a, 'Multiple Linear Regression - Actuals, Interpolation, and Residuals', 4, TRUE)
a<-table.row.end(a)
a<-table.row.start(a)
a<-table.element(a, 'Time or Index', 1, TRUE)
a<-table.element(a, 'Actuals', 1, TRUE)
a<-table.element(a, 'Interpolation
Forecast', 1, TRUE)
a<-table.element(a, 'Residuals
Prediction Error', 1, TRUE)
a<-table.row.end(a)
for (i in 1:n) {
a<-table.row.start(a)
a<-table.element(a,i, 1, TRUE)
a<-table.element(a,x[i])
a<-table.element(a,x[i]-mysum$resid[i])
a<-table.element(a,mysum$resid[i])
a<-table.row.end(a)
}
a<-table.end(a)
table.save(a,file='mytable4.tab')
if (n > n25) {
a<-table.start()
a<-table.row.start(a)
a<-table.element(a,'Goldfeld-Quandt test for Heteroskedasticity',4,TRUE)
a<-table.row.end(a)
a<-table.row.start(a)
a<-table.element(a,'p-values',header=TRUE)
a<-table.element(a,'Alternative Hypothesis',3,header=TRUE)
a<-table.row.end(a)
a<-table.row.start(a)
a<-table.element(a,'breakpoint index',header=TRUE)
a<-table.element(a,'greater',header=TRUE)
a<-table.element(a,'2-sided',header=TRUE)
a<-table.element(a,'less',header=TRUE)
a<-table.row.end(a)
for (mypoint in kp3:nmkm3) {
a<-table.row.start(a)
a<-table.element(a,mypoint,header=TRUE)
a<-table.element(a,gqarr[mypoint-kp3+1,1])
a<-table.element(a,gqarr[mypoint-kp3+1,2])
a<-table.element(a,gqarr[mypoint-kp3+1,3])
a<-table.row.end(a)
}
a<-table.end(a)
table.save(a,file='mytable5.tab')
a<-table.start()
a<-table.row.start(a)
a<-table.element(a,'Meta Analysis of Goldfeld-Quandt test for Heteroskedasticity',4,TRUE)
a<-table.row.end(a)
a<-table.row.start(a)
a<-table.element(a,'Description',header=TRUE)
a<-table.element(a,'# significant tests',header=TRUE)
a<-table.element(a,'% significant tests',header=TRUE)
a<-table.element(a,'OK/NOK',header=TRUE)
a<-table.row.end(a)
a<-table.row.start(a)
a<-table.element(a,'1% type I error level',header=TRUE)
a<-table.element(a,numsignificant1)
a<-table.element(a,numsignificant1/numgqtests)
if (numsignificant1/numgqtests < 0.01) dum <- 'OK' else dum <- 'NOK'
a<-table.element(a,dum)
a<-table.row.end(a)
a<-table.row.start(a)
a<-table.element(a,'5% type I error level',header=TRUE)
a<-table.element(a,numsignificant5)
a<-table.element(a,numsignificant5/numgqtests)
if (numsignificant5/numgqtests < 0.05) dum <- 'OK' else dum <- 'NOK'
a<-table.element(a,dum)
a<-table.row.end(a)
a<-table.row.start(a)
a<-table.element(a,'10% type I error level',header=TRUE)
a<-table.element(a,numsignificant10)
a<-table.element(a,numsignificant10/numgqtests)
if (numsignificant10/numgqtests < 0.1) dum <- 'OK' else dum <- 'NOK'
a<-table.element(a,dum)
a<-table.row.end(a)
a<-table.end(a)
table.save(a,file='mytable6.tab')
}