Free Statistics

of Irreproducible Research!

Author's title

Author*Unverified author*
R Software Modulerwasp_arimaforecasting.wasp
Title produced by softwareARIMA Forecasting
Date of computationTue, 16 Dec 2008 09:13:01 -0700
Cite this page as followsStatistical Computations at FreeStatistics.org, Office for Research Development and Education, URL https://freestatistics.org/blog/index.php?v=date/2008/Dec/16/t12294440080olum0oh7a6pw0i.htm/, Retrieved Wed, 15 May 2024 03:24:59 +0000
Statistical Computations at FreeStatistics.org, Office for Research Development and Education, URL https://freestatistics.org/blog/index.php?pk=34000, Retrieved Wed, 15 May 2024 03:24:59 +0000
QR Codes:

Original text written by user:
IsPrivate?No (this computation is public)
User-defined keywords
Estimated Impact223
Family? (F = Feedback message, R = changed R code, M = changed R Module, P = changed Parameters, D = changed Data)
F     [ARIMA Forecasting] [hfdst 21 arima fo...] [2008-12-15 08:32:33] [11edab5c4db3615abbf782b1c6e7cacf]
F R       [ARIMA Forecasting] [] [2008-12-16 16:13:01] [d41d8cd98f00b204e9800998ecf8427e] [Current]
Feedback Forum
2008-12-22 14:32:09 [Thomas Plasschaert] [reply
Goede uitwerking van de verschillende stappen, niet veel op aan te merken, hieronder vindt je mijn oplossing, misschien vindt je toch iets extra.

beperkte uitleg bij het oplossen van de verschillende stappen

In de eerste tabel bevinden zich 9 kolommen met elk hun waarden.
De eerste kolom geeft de tijdsindex, je kan hier zien dat de eerste 360 waarnemingen bestaan en dat de laatste 12 waarnemingen weggelaten zijn door de testing period =12.
De tweede kolom geeft de waarde uit de dataset (Y(t))
De derde kolom geeft de voorspelde waarde (F(t))
De vierde en vijfde kolom geven de 95% upper en lower bound, samen vormen deze het 95% betrouwbaarheidsinterval.
De zesde kolom geeft de p-waarde, met als 0-hypothese dat de waarde uit de dataset en de voorspelde waarde niet significant van elkaar verschillen.
De zevende kolom geeft de waarschijnlijkheid dat er een stijging is ten opzichte van de laatste waarde.
De achtste kolom geeft de waarschijnlijkheid dat er een stijging is ten opzichte van vorig jaar.
De negende kolom geeft de waarschijnlijkheid dat er een stijging is ten opzichte van de laatst gekende waarde.

De 2de tabel geeft verschillende waarden in verband met de dataset, zo zien we in de tweede kolom de procentuele standaardfout en in de derde kolom de procentuele werkelijke fout. Bij de procentuele standaardfout kunnen we opmerken dat hoe verder we in de in toekomst kijken, hoe groter deze fout zal zijn, bij de procentuele werkelijke fout kunnen we opmerken dat deze meestal kleiner is dat de standaardfout.

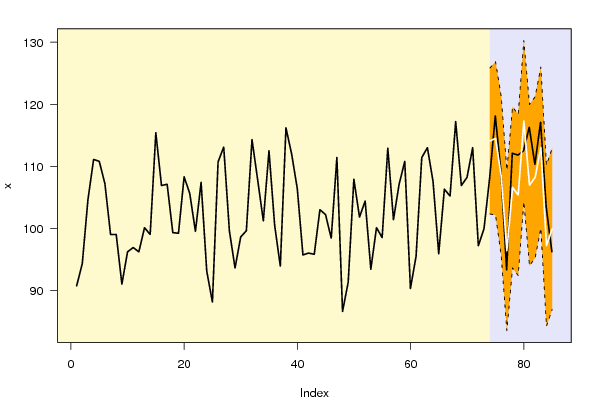
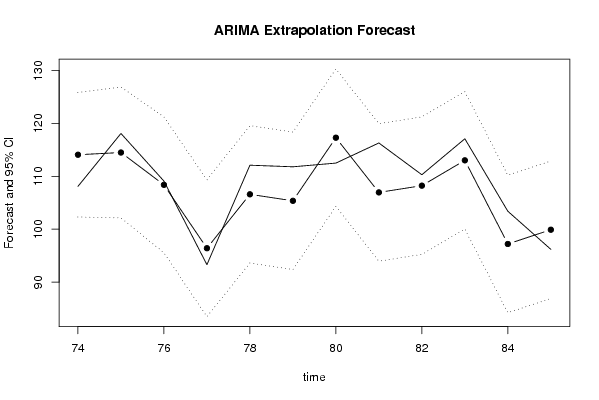
Bij de eerste grafiek worden de laatste 12 maanden grijs gekleurd, omdat het hier gaat over de periode waarvoor we voorspellingen gaan doen, deze periode wordt in de tweede grafiek uitvergroot. In deze grafiek stelt de lijn met de bolletjes de voorspelde waarden voor, de volle lijn de waarden uit de dataset en de stippellijntjes het 95% betrouwbaarheidsinterval. We zien dat er zich hier nergens een noemenswaardige afwijking voordoet waarbij een punt zich buiten het betrouwbaarheidsinterval bevindt. In de tweede grafiek kunnen we zien of er een trend of/en seizoenaliteit is.
2008-12-22 14:34:56 [Thomas Plasschaert] [reply
Deze oplossing lijkt wel erg op de mijne, ook kwestie van formulering, toevallig niet gekopieerd? daarvoor dient het nu ook natuurlijk niet als we oplossingen naar elkaar doorsturen.

Post a new message
Dataseries X:
90,7
94,3
104,6
111,1
110,8
107,2
99
99
91
96,2
96,9
96,2
100,1
99
115,4
106,9
107,1
99,3
99,2
108,3
105,6
99,5
107,4
93,1
88,1
110,7
113,1
99,6
93,6
98,6
99,6
114,3
107,8
101,2
112,5
100,5
93,9
116,2
112
106,4
95,7
96
95,8
103
102,2
98,4
111,4
86,6
91,3
107,9
101,8
104,4
93,4
100,1
98,5
112,9
101,4
107,1
110,8
90,3
95,5
111,4
113
107,5
95,9
106,3
105,2
117,2
106,9
108,2
113
97,2
99,9
108,1
118,1
109,1
93,3
112,1
111,8
112,5
116,3
110,3
117,1
103,4
96,2


Summary of computational transaction
Raw Inputview raw input (R code)
Raw Outputview raw output of R engine
Computing time4 seconds
R Server'Herman Ole Andreas Wold' @ 193.190.124.10:1001

\begin{tabular}{lllllllll}
\hline
Summary of computational transaction \tabularnewline
Raw Input & view raw input (R code)  \tabularnewline
Raw Output & view raw output of R engine  \tabularnewline
Computing time & 4 seconds \tabularnewline
R Server & 'Herman Ole Andreas Wold' @ 193.190.124.10:1001 \tabularnewline
\hline
\end{tabular}
%Source: https://freestatistics.org/blog/index.php?pk=34000&T=0

[TABLE]
[ROW][C]Summary of computational transaction[/C][/ROW]
[ROW][C]Raw Input[/C][C]view raw input (R code) [/C][/ROW]
[ROW][C]Raw Output[/C][C]view raw output of R engine [/C][/ROW]
[ROW][C]Computing time[/C][C]4 seconds[/C][/ROW]
[ROW][C]R Server[/C][C]'Herman Ole Andreas Wold' @ 193.190.124.10:1001[/C][/ROW]
[/TABLE]
Source: https://freestatistics.org/blog/index.php?pk=34000&T=0

Globally Unique Identifier (entire table): ba.freestatistics.org/blog/index.php?pk=34000&T=0

As an alternative you can also use a QR Code:  

The GUIDs for individual cells are displayed in the table below:

Summary of computational transaction
Raw Inputview raw input (R code)
Raw Outputview raw output of R engine
Computing time4 seconds
R Server'Herman Ole Andreas Wold' @ 193.190.124.10:1001


Univariate ARIMA Extrapolation Forecast
timeY[t]F[t]95% LB95% UBp-value(H0: Y[t] = F[t])P(F[t]>Y[t-1])P(F[t]>Y[t-s])P(F[t]>Y[73])
6195.5-------
62111.4-------
63113-------
64107.5-------
6595.9-------
66106.3-------
67105.2-------
68117.2-------
69106.9-------
70108.2-------
71113-------
7297.2-------
7399.9-------
74108.1114.0776102.3151125.84010.15960.99090.67230.9909
75118.1114.4976102.1339126.86130.2840.84480.59380.9897
76109.1108.391195.5445121.23770.45690.06930.55410.9024
7793.396.406683.4755109.33770.31890.02720.53060.2982
78112.1106.597893.621119.57460.2030.97770.51790.8441
79111.8105.370892.3831118.35850.1660.15490.51030.7955
80112.5117.2998104.3074130.29220.23450.79660.5060.9957
81116.3106.957593.9638119.95120.07940.20160.50350.8565
82110.3108.233595.2392121.22770.37760.11190.5020.8956
83117.1113.0193100.0249126.01370.26910.65920.50120.9761
84103.497.211284.2168110.20570.17530.00140.50070.3425
8596.299.906586.912112.9010.28810.29910.50040.5004

\begin{tabular}{lllllllll}
\hline
Univariate ARIMA Extrapolation Forecast \tabularnewline
time & Y[t] & F[t] & 95% LB & 95% UB & p-value(H0: Y[t] = F[t]) & P(F[t]>Y[t-1]) & P(F[t]>Y[t-s]) & P(F[t]>Y[73]) \tabularnewline
61 & 95.5 & - & - & - & - & - & - & - \tabularnewline
62 & 111.4 & - & - & - & - & - & - & - \tabularnewline
63 & 113 & - & - & - & - & - & - & - \tabularnewline
64 & 107.5 & - & - & - & - & - & - & - \tabularnewline
65 & 95.9 & - & - & - & - & - & - & - \tabularnewline
66 & 106.3 & - & - & - & - & - & - & - \tabularnewline
67 & 105.2 & - & - & - & - & - & - & - \tabularnewline
68 & 117.2 & - & - & - & - & - & - & - \tabularnewline
69 & 106.9 & - & - & - & - & - & - & - \tabularnewline
70 & 108.2 & - & - & - & - & - & - & - \tabularnewline
71 & 113 & - & - & - & - & - & - & - \tabularnewline
72 & 97.2 & - & - & - & - & - & - & - \tabularnewline
73 & 99.9 & - & - & - & - & - & - & - \tabularnewline
74 & 108.1 & 114.0776 & 102.3151 & 125.8401 & 0.1596 & 0.9909 & 0.6723 & 0.9909 \tabularnewline
75 & 118.1 & 114.4976 & 102.1339 & 126.8613 & 0.284 & 0.8448 & 0.5938 & 0.9897 \tabularnewline
76 & 109.1 & 108.3911 & 95.5445 & 121.2377 & 0.4569 & 0.0693 & 0.5541 & 0.9024 \tabularnewline
77 & 93.3 & 96.4066 & 83.4755 & 109.3377 & 0.3189 & 0.0272 & 0.5306 & 0.2982 \tabularnewline
78 & 112.1 & 106.5978 & 93.621 & 119.5746 & 0.203 & 0.9777 & 0.5179 & 0.8441 \tabularnewline
79 & 111.8 & 105.3708 & 92.3831 & 118.3585 & 0.166 & 0.1549 & 0.5103 & 0.7955 \tabularnewline
80 & 112.5 & 117.2998 & 104.3074 & 130.2922 & 0.2345 & 0.7966 & 0.506 & 0.9957 \tabularnewline
81 & 116.3 & 106.9575 & 93.9638 & 119.9512 & 0.0794 & 0.2016 & 0.5035 & 0.8565 \tabularnewline
82 & 110.3 & 108.2335 & 95.2392 & 121.2277 & 0.3776 & 0.1119 & 0.502 & 0.8956 \tabularnewline
83 & 117.1 & 113.0193 & 100.0249 & 126.0137 & 0.2691 & 0.6592 & 0.5012 & 0.9761 \tabularnewline
84 & 103.4 & 97.2112 & 84.2168 & 110.2057 & 0.1753 & 0.0014 & 0.5007 & 0.3425 \tabularnewline
85 & 96.2 & 99.9065 & 86.912 & 112.901 & 0.2881 & 0.2991 & 0.5004 & 0.5004 \tabularnewline
\hline
\end{tabular}
%Source: https://freestatistics.org/blog/index.php?pk=34000&T=1

[TABLE]
[ROW][C]Univariate ARIMA Extrapolation Forecast[/C][/ROW]
[ROW][C]time[/C][C]Y[t][/C][C]F[t][/C][C]95% LB[/C][C]95% UB[/C][C]p-value(H0: Y[t] = F[t])[/C][C]P(F[t]>Y[t-1])[/C][C]P(F[t]>Y[t-s])[/C][C]P(F[t]>Y[73])[/C][/ROW]
[ROW][C]61[/C][C]95.5[/C][C]-[/C][C]-[/C][C]-[/C][C]-[/C][C]-[/C][C]-[/C][C]-[/C][/ROW]
[ROW][C]62[/C][C]111.4[/C][C]-[/C][C]-[/C][C]-[/C][C]-[/C][C]-[/C][C]-[/C][C]-[/C][/ROW]
[ROW][C]63[/C][C]113[/C][C]-[/C][C]-[/C][C]-[/C][C]-[/C][C]-[/C][C]-[/C][C]-[/C][/ROW]
[ROW][C]64[/C][C]107.5[/C][C]-[/C][C]-[/C][C]-[/C][C]-[/C][C]-[/C][C]-[/C][C]-[/C][/ROW]
[ROW][C]65[/C][C]95.9[/C][C]-[/C][C]-[/C][C]-[/C][C]-[/C][C]-[/C][C]-[/C][C]-[/C][/ROW]
[ROW][C]66[/C][C]106.3[/C][C]-[/C][C]-[/C][C]-[/C][C]-[/C][C]-[/C][C]-[/C][C]-[/C][/ROW]
[ROW][C]67[/C][C]105.2[/C][C]-[/C][C]-[/C][C]-[/C][C]-[/C][C]-[/C][C]-[/C][C]-[/C][/ROW]
[ROW][C]68[/C][C]117.2[/C][C]-[/C][C]-[/C][C]-[/C][C]-[/C][C]-[/C][C]-[/C][C]-[/C][/ROW]
[ROW][C]69[/C][C]106.9[/C][C]-[/C][C]-[/C][C]-[/C][C]-[/C][C]-[/C][C]-[/C][C]-[/C][/ROW]
[ROW][C]70[/C][C]108.2[/C][C]-[/C][C]-[/C][C]-[/C][C]-[/C][C]-[/C][C]-[/C][C]-[/C][/ROW]
[ROW][C]71[/C][C]113[/C][C]-[/C][C]-[/C][C]-[/C][C]-[/C][C]-[/C][C]-[/C][C]-[/C][/ROW]
[ROW][C]72[/C][C]97.2[/C][C]-[/C][C]-[/C][C]-[/C][C]-[/C][C]-[/C][C]-[/C][C]-[/C][/ROW]
[ROW][C]73[/C][C]99.9[/C][C]-[/C][C]-[/C][C]-[/C][C]-[/C][C]-[/C][C]-[/C][C]-[/C][/ROW]
[ROW][C]74[/C][C]108.1[/C][C]114.0776[/C][C]102.3151[/C][C]125.8401[/C][C]0.1596[/C][C]0.9909[/C][C]0.6723[/C][C]0.9909[/C][/ROW]
[ROW][C]75[/C][C]118.1[/C][C]114.4976[/C][C]102.1339[/C][C]126.8613[/C][C]0.284[/C][C]0.8448[/C][C]0.5938[/C][C]0.9897[/C][/ROW]
[ROW][C]76[/C][C]109.1[/C][C]108.3911[/C][C]95.5445[/C][C]121.2377[/C][C]0.4569[/C][C]0.0693[/C][C]0.5541[/C][C]0.9024[/C][/ROW]
[ROW][C]77[/C][C]93.3[/C][C]96.4066[/C][C]83.4755[/C][C]109.3377[/C][C]0.3189[/C][C]0.0272[/C][C]0.5306[/C][C]0.2982[/C][/ROW]
[ROW][C]78[/C][C]112.1[/C][C]106.5978[/C][C]93.621[/C][C]119.5746[/C][C]0.203[/C][C]0.9777[/C][C]0.5179[/C][C]0.8441[/C][/ROW]
[ROW][C]79[/C][C]111.8[/C][C]105.3708[/C][C]92.3831[/C][C]118.3585[/C][C]0.166[/C][C]0.1549[/C][C]0.5103[/C][C]0.7955[/C][/ROW]
[ROW][C]80[/C][C]112.5[/C][C]117.2998[/C][C]104.3074[/C][C]130.2922[/C][C]0.2345[/C][C]0.7966[/C][C]0.506[/C][C]0.9957[/C][/ROW]
[ROW][C]81[/C][C]116.3[/C][C]106.9575[/C][C]93.9638[/C][C]119.9512[/C][C]0.0794[/C][C]0.2016[/C][C]0.5035[/C][C]0.8565[/C][/ROW]
[ROW][C]82[/C][C]110.3[/C][C]108.2335[/C][C]95.2392[/C][C]121.2277[/C][C]0.3776[/C][C]0.1119[/C][C]0.502[/C][C]0.8956[/C][/ROW]
[ROW][C]83[/C][C]117.1[/C][C]113.0193[/C][C]100.0249[/C][C]126.0137[/C][C]0.2691[/C][C]0.6592[/C][C]0.5012[/C][C]0.9761[/C][/ROW]
[ROW][C]84[/C][C]103.4[/C][C]97.2112[/C][C]84.2168[/C][C]110.2057[/C][C]0.1753[/C][C]0.0014[/C][C]0.5007[/C][C]0.3425[/C][/ROW]
[ROW][C]85[/C][C]96.2[/C][C]99.9065[/C][C]86.912[/C][C]112.901[/C][C]0.2881[/C][C]0.2991[/C][C]0.5004[/C][C]0.5004[/C][/ROW]
[/TABLE]
Source: https://freestatistics.org/blog/index.php?pk=34000&T=1

Globally Unique Identifier (entire table): ba.freestatistics.org/blog/index.php?pk=34000&T=1

As an alternative you can also use a QR Code:  

The GUIDs for individual cells are displayed in the table below:

Univariate ARIMA Extrapolation Forecast
timeY[t]F[t]95% LB95% UBp-value(H0: Y[t] = F[t])P(F[t]>Y[t-1])P(F[t]>Y[t-s])P(F[t]>Y[73])
6195.5-------
62111.4-------
63113-------
64107.5-------
6595.9-------
66106.3-------
67105.2-------
68117.2-------
69106.9-------
70108.2-------
71113-------
7297.2-------
7399.9-------
74108.1114.0776102.3151125.84010.15960.99090.67230.9909
75118.1114.4976102.1339126.86130.2840.84480.59380.9897
76109.1108.391195.5445121.23770.45690.06930.55410.9024
7793.396.406683.4755109.33770.31890.02720.53060.2982
78112.1106.597893.621119.57460.2030.97770.51790.8441
79111.8105.370892.3831118.35850.1660.15490.51030.7955
80112.5117.2998104.3074130.29220.23450.79660.5060.9957
81116.3106.957593.9638119.95120.07940.20160.50350.8565
82110.3108.233595.2392121.22770.37760.11190.5020.8956
83117.1113.0193100.0249126.01370.26910.65920.50120.9761
84103.497.211284.2168110.20570.17530.00140.50070.3425
8596.299.906586.912112.9010.28810.29910.50040.5004


Univariate ARIMA Extrapolation Forecast Performance
time% S.E.PEMAPESq.EMSERMSE
740.0526-0.05240.004435.73172.97761.7256
750.05510.03150.002612.97731.08141.0399
760.06050.00655e-040.50250.04190.2046
770.0684-0.03220.00279.65110.80430.8968
780.06210.05160.004330.2742.52281.5883
790.06290.0610.005141.33433.44451.8559
800.0565-0.04090.003423.03781.91981.3856
810.0620.08730.007387.28237.27352.6969
820.06130.01910.00164.27060.35590.5966
830.05870.03610.00316.65181.38771.178
840.06820.06370.005338.30093.19171.7865
850.0664-0.03710.003113.73811.14481.07

\begin{tabular}{lllllllll}
\hline
Univariate ARIMA Extrapolation Forecast Performance \tabularnewline
time & % S.E. & PE & MAPE & Sq.E & MSE & RMSE \tabularnewline
74 & 0.0526 & -0.0524 & 0.0044 & 35.7317 & 2.9776 & 1.7256 \tabularnewline
75 & 0.0551 & 0.0315 & 0.0026 & 12.9773 & 1.0814 & 1.0399 \tabularnewline
76 & 0.0605 & 0.0065 & 5e-04 & 0.5025 & 0.0419 & 0.2046 \tabularnewline
77 & 0.0684 & -0.0322 & 0.0027 & 9.6511 & 0.8043 & 0.8968 \tabularnewline
78 & 0.0621 & 0.0516 & 0.0043 & 30.274 & 2.5228 & 1.5883 \tabularnewline
79 & 0.0629 & 0.061 & 0.0051 & 41.3343 & 3.4445 & 1.8559 \tabularnewline
80 & 0.0565 & -0.0409 & 0.0034 & 23.0378 & 1.9198 & 1.3856 \tabularnewline
81 & 0.062 & 0.0873 & 0.0073 & 87.2823 & 7.2735 & 2.6969 \tabularnewline
82 & 0.0613 & 0.0191 & 0.0016 & 4.2706 & 0.3559 & 0.5966 \tabularnewline
83 & 0.0587 & 0.0361 & 0.003 & 16.6518 & 1.3877 & 1.178 \tabularnewline
84 & 0.0682 & 0.0637 & 0.0053 & 38.3009 & 3.1917 & 1.7865 \tabularnewline
85 & 0.0664 & -0.0371 & 0.0031 & 13.7381 & 1.1448 & 1.07 \tabularnewline
\hline
\end{tabular}
%Source: https://freestatistics.org/blog/index.php?pk=34000&T=2

[TABLE]
[ROW][C]Univariate ARIMA Extrapolation Forecast Performance[/C][/ROW]
[ROW][C]time[/C][C]% S.E.[/C][C]PE[/C][C]MAPE[/C][C]Sq.E[/C][C]MSE[/C][C]RMSE[/C][/ROW]
[ROW][C]74[/C][C]0.0526[/C][C]-0.0524[/C][C]0.0044[/C][C]35.7317[/C][C]2.9776[/C][C]1.7256[/C][/ROW]
[ROW][C]75[/C][C]0.0551[/C][C]0.0315[/C][C]0.0026[/C][C]12.9773[/C][C]1.0814[/C][C]1.0399[/C][/ROW]
[ROW][C]76[/C][C]0.0605[/C][C]0.0065[/C][C]5e-04[/C][C]0.5025[/C][C]0.0419[/C][C]0.2046[/C][/ROW]
[ROW][C]77[/C][C]0.0684[/C][C]-0.0322[/C][C]0.0027[/C][C]9.6511[/C][C]0.8043[/C][C]0.8968[/C][/ROW]
[ROW][C]78[/C][C]0.0621[/C][C]0.0516[/C][C]0.0043[/C][C]30.274[/C][C]2.5228[/C][C]1.5883[/C][/ROW]
[ROW][C]79[/C][C]0.0629[/C][C]0.061[/C][C]0.0051[/C][C]41.3343[/C][C]3.4445[/C][C]1.8559[/C][/ROW]
[ROW][C]80[/C][C]0.0565[/C][C]-0.0409[/C][C]0.0034[/C][C]23.0378[/C][C]1.9198[/C][C]1.3856[/C][/ROW]
[ROW][C]81[/C][C]0.062[/C][C]0.0873[/C][C]0.0073[/C][C]87.2823[/C][C]7.2735[/C][C]2.6969[/C][/ROW]
[ROW][C]82[/C][C]0.0613[/C][C]0.0191[/C][C]0.0016[/C][C]4.2706[/C][C]0.3559[/C][C]0.5966[/C][/ROW]
[ROW][C]83[/C][C]0.0587[/C][C]0.0361[/C][C]0.003[/C][C]16.6518[/C][C]1.3877[/C][C]1.178[/C][/ROW]
[ROW][C]84[/C][C]0.0682[/C][C]0.0637[/C][C]0.0053[/C][C]38.3009[/C][C]3.1917[/C][C]1.7865[/C][/ROW]
[ROW][C]85[/C][C]0.0664[/C][C]-0.0371[/C][C]0.0031[/C][C]13.7381[/C][C]1.1448[/C][C]1.07[/C][/ROW]
[/TABLE]
Source: https://freestatistics.org/blog/index.php?pk=34000&T=2

Globally Unique Identifier (entire table): ba.freestatistics.org/blog/index.php?pk=34000&T=2

As an alternative you can also use a QR Code:  

The GUIDs for individual cells are displayed in the table below:

Univariate ARIMA Extrapolation Forecast Performance
time% S.E.PEMAPESq.EMSERMSE
740.0526-0.05240.004435.73172.97761.7256
750.05510.03150.002612.97731.08141.0399
760.06050.00655e-040.50250.04190.2046
770.0684-0.03220.00279.65110.80430.8968
780.06210.05160.004330.2742.52281.5883
790.06290.0610.005141.33433.44451.8559
800.0565-0.04090.003423.03781.91981.3856
810.0620.08730.007387.28237.27352.6969
820.06130.01910.00164.27060.35590.5966
830.05870.03610.00316.65181.38771.178
840.06820.06370.005338.30093.19171.7865
850.0664-0.03710.003113.73811.14481.07


Parameters (Session):
par1 = 12 ; par2 = 1 ; par3 = 0 ; par4 = 1 ; par5 = 12 ; par6 = 2 ; par7 = 1 ; par8 = 0 ; par9 = 0 ; par10 = FALSE ;
Parameters (R input):
par1 = 12 ; par2 = 1 ; par3 = 0 ; par4 = 1 ; par5 = 12 ; par6 = 2 ; par7 = 1 ; par8 = 0 ; par9 = 0 ; par10 = FALSE ; par11 = ; par12 = ; par13 = ; par14 = ; par15 = ; par16 = ; par17 = ; par18 = ; par19 = ; par20 = ;
R code (references can be found in the software module):
par1 <- as.numeric(par1) #cut off periods
par2 <- as.numeric(par2) #lambda
par3 <- as.numeric(par3) #degree of non-seasonal differencing
par4 <- as.numeric(par4) #degree of seasonal differencing
par5 <- as.numeric(par5) #seasonal period
par6 <- as.numeric(par6) #p
par7 <- as.numeric(par7) #q
par8 <- as.numeric(par8) #P
par9 <- as.numeric(par9) #Q
if (par10 == 'TRUE') par10 <- TRUE
if (par10 == 'FALSE') par10 <- FALSE
if (par2 == 0) x <- log(x)
if (par2 != 0) x <- x^par2
lx <- length(x)
first <- lx - 2*par1
nx <- lx - par1
nx1 <- nx + 1
fx <- lx - nx
if (fx < 1) {
fx <- par5
nx1 <- lx + fx - 1
first <- lx - 2*fx
}
first <- 1
if (fx < 3) fx <- round(lx/10,0)
(arima.out <- arima(x[1:nx], order=c(par6,par3,par7), seasonal=list(order=c(par8,par4,par9), period=par5), include.mean=par10, method='ML'))
(forecast <- predict(arima.out,fx))
(lb <- forecast$pred - 1.96 * forecast$se)
(ub <- forecast$pred + 1.96 * forecast$se)
if (par2 == 0) {
x <- exp(x)
forecast$pred <- exp(forecast$pred)
lb <- exp(lb)
ub <- exp(ub)
}
if (par2 != 0) {
x <- x^(1/par2)
forecast$pred <- forecast$pred^(1/par2)
lb <- lb^(1/par2)
ub <- ub^(1/par2)
}
if (par2 < 0) {
olb <- lb
lb <- ub
ub <- olb
}
(actandfor <- c(x[1:nx], forecast$pred))
(perc.se <- (ub-forecast$pred)/1.96/forecast$pred)
bitmap(file='test1.png')
opar <- par(mar=c(4,4,2,2),las=1)
ylim <- c( min(x[first:nx],lb), max(x[first:nx],ub))
plot(x,ylim=ylim,type='n',xlim=c(first,lx))
usr <- par('usr')
rect(usr[1],usr[3],nx+1,usr[4],border=NA,col='lemonchiffon')
rect(nx1,usr[3],usr[2],usr[4],border=NA,col='lavender')
abline(h= (-3:3)*2 , col ='gray', lty =3)
polygon( c(nx1:lx,lx:nx1), c(lb,rev(ub)), col = 'orange', lty=2,border=NA)
lines(nx1:lx, lb , lty=2)
lines(nx1:lx, ub , lty=2)
lines(x, lwd=2)
lines(nx1:lx, forecast$pred , lwd=2 , col ='white')
box()
par(opar)
dev.off()
prob.dec <- array(NA, dim=fx)
prob.sdec <- array(NA, dim=fx)
prob.ldec <- array(NA, dim=fx)
prob.pval <- array(NA, dim=fx)
perf.pe <- array(0, dim=fx)
perf.mape <- array(0, dim=fx)
perf.se <- array(0, dim=fx)
perf.mse <- array(0, dim=fx)
perf.rmse <- array(0, dim=fx)
for (i in 1:fx) {
locSD <- (ub[i] - forecast$pred[i]) / 1.96
perf.pe[i] = (x[nx+i] - forecast$pred[i]) / forecast$pred[i]
perf.mape[i] = perf.mape[i] + abs(perf.pe[i])
perf.se[i] = (x[nx+i] - forecast$pred[i])^2
perf.mse[i] = perf.mse[i] + perf.se[i]
prob.dec[i] = pnorm((x[nx+i-1] - forecast$pred[i]) / locSD)
prob.sdec[i] = pnorm((x[nx+i-par5] - forecast$pred[i]) / locSD)
prob.ldec[i] = pnorm((x[nx] - forecast$pred[i]) / locSD)
prob.pval[i] = pnorm(abs(x[nx+i] - forecast$pred[i]) / locSD)
}
perf.mape = perf.mape / fx
perf.mse = perf.mse / fx
perf.rmse = sqrt(perf.mse)
bitmap(file='test2.png')
plot(forecast$pred, pch=19, type='b',main='ARIMA Extrapolation Forecast', ylab='Forecast and 95% CI', xlab='time',ylim=c(min(lb),max(ub)))
dum <- forecast$pred
dum[1:12] <- x[(nx+1):lx]
lines(dum, lty=1)
lines(ub,lty=3)
lines(lb,lty=3)
dev.off()
load(file='createtable')
a<-table.start()
a<-table.row.start(a)
a<-table.element(a,'Univariate ARIMA Extrapolation Forecast',9,TRUE)
a<-table.row.end(a)
a<-table.row.start(a)
a<-table.element(a,'time',1,header=TRUE)
a<-table.element(a,'Y[t]',1,header=TRUE)
a<-table.element(a,'F[t]',1,header=TRUE)
a<-table.element(a,'95% LB',1,header=TRUE)
a<-table.element(a,'95% UB',1,header=TRUE)
a<-table.element(a,'p-value
(H0: Y[t] = F[t])',1,header=TRUE)
a<-table.element(a,'P(F[t]>Y[t-1])',1,header=TRUE)
a<-table.element(a,'P(F[t]>Y[t-s])',1,header=TRUE)
mylab <- paste('P(F[t]>Y[',nx,sep='')
mylab <- paste(mylab,'])',sep='')
a<-table.element(a,mylab,1,header=TRUE)
a<-table.row.end(a)
for (i in (nx-par5):nx) {
a<-table.row.start(a)
a<-table.element(a,i,header=TRUE)
a<-table.element(a,x[i])
a<-table.element(a,'-')
a<-table.row.end(a)
}
for (i in 1:fx) {
a<-table.row.start(a)
a<-table.element(a,nx+i,header=TRUE)
a<-table.element(a,round(x[nx+i],4))
a<-table.element(a,round(forecast$pred[i],4))
a<-table.element(a,round(lb[i],4))
a<-table.element(a,round(ub[i],4))
a<-table.element(a,round((1-prob.pval[i]),4))
a<-table.element(a,round((1-prob.dec[i]),4))
a<-table.element(a,round((1-prob.sdec[i]),4))
a<-table.element(a,round((1-prob.ldec[i]),4))
a<-table.row.end(a)
}
a<-table.end(a)
table.save(a,file='mytable.tab')
a<-table.start()
a<-table.row.start(a)
a<-table.element(a,'Univariate ARIMA Extrapolation Forecast Performance',7,TRUE)
a<-table.row.end(a)
a<-table.row.start(a)
a<-table.element(a,'time',1,header=TRUE)
a<-table.element(a,'% S.E.',1,header=TRUE)
a<-table.element(a,'PE',1,header=TRUE)
a<-table.element(a,'MAPE',1,header=TRUE)
a<-table.element(a,'Sq.E',1,header=TRUE)
a<-table.element(a,'MSE',1,header=TRUE)
a<-table.element(a,'RMSE',1,header=TRUE)
a<-table.row.end(a)
for (i in 1:fx) {
a<-table.row.start(a)
a<-table.element(a,nx+i,header=TRUE)
a<-table.element(a,round(perc.se[i],4))
a<-table.element(a,round(perf.pe[i],4))
a<-table.element(a,round(perf.mape[i],4))
a<-table.element(a,round(perf.se[i],4))
a<-table.element(a,round(perf.mse[i],4))
a<-table.element(a,round(perf.rmse[i],4))
a<-table.row.end(a)
}
a<-table.end(a)
table.save(a,file='mytable1.tab')