Free Statistics

of Irreproducible Research!

Author's title

Author*Unverified author*
R Software Modulerwasp_arimaforecasting.wasp
Title produced by softwareARIMA Forecasting
Date of computationTue, 16 Dec 2008 09:07:25 -0700
Cite this page as followsStatistical Computations at FreeStatistics.org, Office for Research Development and Education, URL https://freestatistics.org/blog/index.php?v=date/2008/Dec/16/t1229443705hznumnbyr3z8j9b.htm/, Retrieved Wed, 15 May 2024 02:54:11 +0000
Statistical Computations at FreeStatistics.org, Office for Research Development and Education, URL https://freestatistics.org/blog/index.php?pk=33997, Retrieved Wed, 15 May 2024 02:54:11 +0000
QR Codes:

Original text written by user:
IsPrivate?No (this computation is public)
User-defined keywords
Estimated Impact152
Family? (F = Feedback message, R = changed R code, M = changed R Module, P = changed Parameters, D = changed Data)
F       [ARIMA Forecasting] [ARIMA Forecast ei...] [2008-12-16 16:07:25] [fdd9b7950d7c195d4d8aeb0c9bacacc6] [Current]
Feedback Forum
2008-12-24 09:25:11 [Sam De Cuyper] [reply
De berekeningen zijn correct maar er is geen interpretatie gegeven. De 5 stappen zijn niet uitgewerkt.

In de eerste tabel vind je de waarden voor F(t) terug, waarbij F staat voor forecast. Er wordt berekend welke de meest waarschijnlijke uitkomst is. De 2 kolommen daarnaast (LB en UB) geven de ondergrens en de bovengrens weer van de 95% betrouwbaarheidsintervallen. Er zou met 95% zekerheid (waarschijnlijkheid) kunnen gezegd worden dat F(t) tussen deze 2 grenzen ligt, indien zich geen exceptionele dingen voordoen.
De kolom daarnaast geeft de p-waarde weer van Y(t) = F(t). Zo is de kans dat ik mij vergis bij het verwerpen van de 0-hypothese 23%. Het verschil tussen 12514.1261 en 13821.3032 is met andere woorden niet significant. Indien je alle p-waarden op alle tijdstippen bekijkt, is te zien dat er enkele p-waarde klein genoeg zijn opdat er een significant verschil zou zijn tussen het berekende Y(t) en het voorspelde F(t).
In de kolom ernaast vind je de p-waarde voor: ( F(t) > Y(t-1) ). Voor tijdstip 110 is deze waarde gelijk aan 0,46. Dit wil zeggen dat er 46% kans is dat de waarde van de volgende maand groter zal zijn. Kans van 46% op een stijging.
In de kolom daarnaast staat: P( F(t) > Y(t-s) ) met s =12. Deze waarde geeft weer wat de kans is dat de waarde groter is dan dezelfde maand van vorig jaar. Op tijdstip 110 is deze waarde gelijk aan 0,99. Er is dus 99% kans dat de waarde van deze maand groter is dan de waarde voor dezelfde maand vorig jaar.
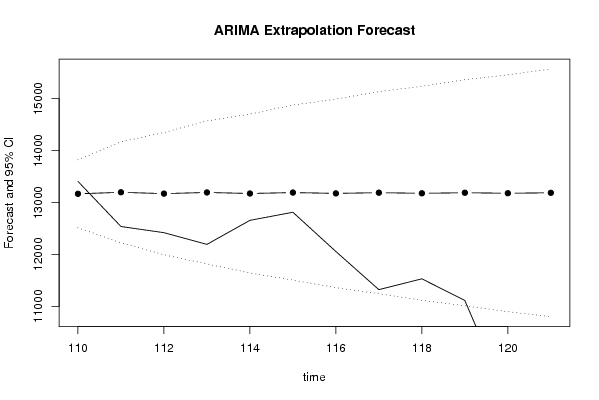
In de laatste kolom: P( F[t] > Y[109] ) = de kans dat de voorspelde waarde groter is dan de laatst gekende werkelijke waarde. Er is misschien sprake van explosiviteit omdat de grafiek sterk daalt naar (-) oneindig.

In de 2de tabel vind je de %SE of procentuele standaardfout voor de berekende periodes. Deze waarde geeft de procentuele standaardfout weer. Je kan zien dat de standaardfout ligt tussen 2% (op tijdstip 110) en 9% (op tijdstip 121). Naast SE vind je ook de werkelijke fout PE weer, het resultaat uit de vergelijking van de voorspelde en werkelijke waarde. Hierbij moet gezegd worden dat de voorspelde fout SE steeds groter moet zijn dan de werkelijke fout PE, wat hier ook het geval is.
De voorspellingsfout geeft procenten die ik verwacht in normale omstandigheden (er mag zich niets exceptioneels voordoen). Indien ik nu 12 maanden vooruit voorspel zal er een verschil (foutenmarge) zijn van gemiddeld 7%. Door de kleine standaardfout kan je zeggen dat waarschijnlijk redelijk ‘ver’ zal voorspeld kunnen worden.

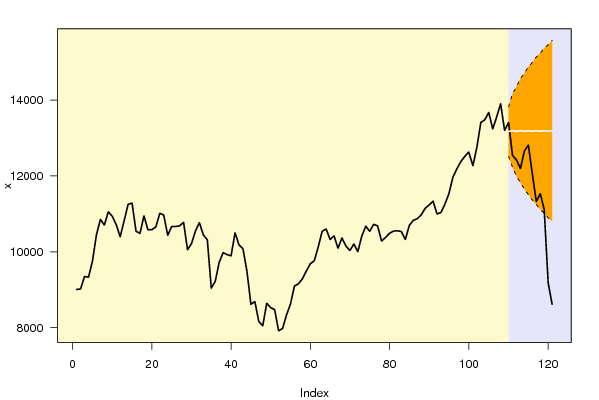
De eerste grafiek geeft een voorstelling van de werkelijke waarde waar de laatste 12 maanden worden afgeknipt van de tijdreeks en voor deze maanden een voorspelling wordt gegeven.
De witte lijn geeft de voorspelling weer en de stippellijnen geven het betrouwbaarheidsinterval weer waartussen de voorspelling mag schommelen.


Post a new message
Dataseries X:
9005,73
9018,68
9349,44
9327,78
9753,63
10443,5
10853,87
10704,02
11052,23
10935,47
10714,03
10394,48
10817,9
11251,2
11281,26
10539,68
10483,39
10947,43
10580,27
10582,92
10654,41
11014,51
10967,87
10433,56
10665,78
10666,71
10682,74
10777,22
10052,6
10213,97
10546,82
10767,2
10444,5
10314,68
9042,56
9220,75
9721,84
9978,53
9923,81
9892,56
10500,98
10179,35
10080,48
9492,44
8616,49
8685,4
8160,67
8048,1
8641,21
8526,63
8474,21
7916,13
7977,64
8334,59
8623,36
9098,03
9154,34
9284,73
9492,49
9682,35
9762,12
10124,63
10540,05
10601,61
10323,73
10418,4
10092,96
10364,91
10152,09
10032,8
10204,59
10001,6
10411,75
10673,38
10539,51
10723,78
10682,06
10283,19
10377,18
10486,64
10545,38
10554,27
10532,54
10324,31
10695,25
10827,81
10872,48
10971,19
11145,65
11234,68
11333,88
10997,97
11036,89
11257,35
11533,59
11963,12
12185,15
12377,62
12512,89
12631,48
12268,53
12754,8
13407,75
13480,21
13673,28
13239,71
13557,69
13901,28
13200,58
13406,97
12538,12
12419,57
12193,88
12656,63
12812,48
12056,67
11322,38
11530,75
11114,08
9181,73
8614,55


Summary of computational transaction
Raw Inputview raw input (R code)
Raw Outputview raw output of R engine
Computing time5 seconds
R Server'Herman Ole Andreas Wold' @ 193.190.124.10:1001

\begin{tabular}{lllllllll}
\hline
Summary of computational transaction \tabularnewline
Raw Input & view raw input (R code)  \tabularnewline
Raw Output & view raw output of R engine  \tabularnewline
Computing time & 5 seconds \tabularnewline
R Server & 'Herman Ole Andreas Wold' @ 193.190.124.10:1001 \tabularnewline
\hline
\end{tabular}
%Source: https://freestatistics.org/blog/index.php?pk=33997&T=0

[TABLE]
[ROW][C]Summary of computational transaction[/C][/ROW]
[ROW][C]Raw Input[/C][C]view raw input (R code) [/C][/ROW]
[ROW][C]Raw Output[/C][C]view raw output of R engine [/C][/ROW]
[ROW][C]Computing time[/C][C]5 seconds[/C][/ROW]
[ROW][C]R Server[/C][C]'Herman Ole Andreas Wold' @ 193.190.124.10:1001[/C][/ROW]
[/TABLE]
Source: https://freestatistics.org/blog/index.php?pk=33997&T=0

Globally Unique Identifier (entire table): ba.freestatistics.org/blog/index.php?pk=33997&T=0

As an alternative you can also use a QR Code:  

The GUIDs for individual cells are displayed in the table below:

Summary of computational transaction
Raw Inputview raw input (R code)
Raw Outputview raw output of R engine
Computing time5 seconds
R Server'Herman Ole Andreas Wold' @ 193.190.124.10:1001


Univariate ARIMA Extrapolation Forecast
timeY[t]F[t]95% LB95% UBp-value(H0: Y[t] = F[t])P(F[t]>Y[t-1])P(F[t]>Y[t-s])P(F[t]>Y[109])
9712185.15-------
9812377.62-------
9912512.89-------
10012631.48-------
10112268.53-------
10212754.8-------
10313407.75-------
10413480.21-------
10513673.28-------
10613239.71-------
10713557.69-------
10813901.28-------
10913200.58-------
11013406.9713167.714612514.126113821.30320.23650.46070.99110.4607
11112538.1213196.77712223.75814169.7960.09230.3360.91580.4969
11212419.5713171.077611994.567514347.58760.10530.85420.81570.4804
11312193.8813193.803211817.61514569.99150.07720.86490.90620.4961
11412656.6313173.707211644.201114703.21340.25380.89540.70430.4863
11512812.4813191.477811505.816214877.13950.32970.7330.40070.4958
11612056.6713175.763611361.011914990.51530.11340.65260.37110.4893
11711322.3813189.659511243.009415136.30950.030.8730.31320.4956
11811530.7513177.371511116.708915238.03410.05870.96120.47640.4912
11911114.0813188.237611011.581915364.89330.03090.93220.36970.4956
1209181.7313178.628910898.572915458.68483e-040.9620.26720.4925
1218614.5513187.125710802.475915571.77551e-040.99950.49560.4956

\begin{tabular}{lllllllll}
\hline
Univariate ARIMA Extrapolation Forecast \tabularnewline
time & Y[t] & F[t] & 95% LB & 95% UB & p-value(H0: Y[t] = F[t]) & P(F[t]>Y[t-1]) & P(F[t]>Y[t-s]) & P(F[t]>Y[109]) \tabularnewline
97 & 12185.15 & - & - & - & - & - & - & - \tabularnewline
98 & 12377.62 & - & - & - & - & - & - & - \tabularnewline
99 & 12512.89 & - & - & - & - & - & - & - \tabularnewline
100 & 12631.48 & - & - & - & - & - & - & - \tabularnewline
101 & 12268.53 & - & - & - & - & - & - & - \tabularnewline
102 & 12754.8 & - & - & - & - & - & - & - \tabularnewline
103 & 13407.75 & - & - & - & - & - & - & - \tabularnewline
104 & 13480.21 & - & - & - & - & - & - & - \tabularnewline
105 & 13673.28 & - & - & - & - & - & - & - \tabularnewline
106 & 13239.71 & - & - & - & - & - & - & - \tabularnewline
107 & 13557.69 & - & - & - & - & - & - & - \tabularnewline
108 & 13901.28 & - & - & - & - & - & - & - \tabularnewline
109 & 13200.58 & - & - & - & - & - & - & - \tabularnewline
110 & 13406.97 & 13167.7146 & 12514.1261 & 13821.3032 & 0.2365 & 0.4607 & 0.9911 & 0.4607 \tabularnewline
111 & 12538.12 & 13196.777 & 12223.758 & 14169.796 & 0.0923 & 0.336 & 0.9158 & 0.4969 \tabularnewline
112 & 12419.57 & 13171.0776 & 11994.5675 & 14347.5876 & 0.1053 & 0.8542 & 0.8157 & 0.4804 \tabularnewline
113 & 12193.88 & 13193.8032 & 11817.615 & 14569.9915 & 0.0772 & 0.8649 & 0.9062 & 0.4961 \tabularnewline
114 & 12656.63 & 13173.7072 & 11644.2011 & 14703.2134 & 0.2538 & 0.8954 & 0.7043 & 0.4863 \tabularnewline
115 & 12812.48 & 13191.4778 & 11505.8162 & 14877.1395 & 0.3297 & 0.733 & 0.4007 & 0.4958 \tabularnewline
116 & 12056.67 & 13175.7636 & 11361.0119 & 14990.5153 & 0.1134 & 0.6526 & 0.3711 & 0.4893 \tabularnewline
117 & 11322.38 & 13189.6595 & 11243.0094 & 15136.3095 & 0.03 & 0.873 & 0.3132 & 0.4956 \tabularnewline
118 & 11530.75 & 13177.3715 & 11116.7089 & 15238.0341 & 0.0587 & 0.9612 & 0.4764 & 0.4912 \tabularnewline
119 & 11114.08 & 13188.2376 & 11011.5819 & 15364.8933 & 0.0309 & 0.9322 & 0.3697 & 0.4956 \tabularnewline
120 & 9181.73 & 13178.6289 & 10898.5729 & 15458.6848 & 3e-04 & 0.962 & 0.2672 & 0.4925 \tabularnewline
121 & 8614.55 & 13187.1257 & 10802.4759 & 15571.7755 & 1e-04 & 0.9995 & 0.4956 & 0.4956 \tabularnewline
\hline
\end{tabular}
%Source: https://freestatistics.org/blog/index.php?pk=33997&T=1

[TABLE]
[ROW][C]Univariate ARIMA Extrapolation Forecast[/C][/ROW]
[ROW][C]time[/C][C]Y[t][/C][C]F[t][/C][C]95% LB[/C][C]95% UB[/C][C]p-value(H0: Y[t] = F[t])[/C][C]P(F[t]>Y[t-1])[/C][C]P(F[t]>Y[t-s])[/C][C]P(F[t]>Y[109])[/C][/ROW]
[ROW][C]97[/C][C]12185.15[/C][C]-[/C][C]-[/C][C]-[/C][C]-[/C][C]-[/C][C]-[/C][C]-[/C][/ROW]
[ROW][C]98[/C][C]12377.62[/C][C]-[/C][C]-[/C][C]-[/C][C]-[/C][C]-[/C][C]-[/C][C]-[/C][/ROW]
[ROW][C]99[/C][C]12512.89[/C][C]-[/C][C]-[/C][C]-[/C][C]-[/C][C]-[/C][C]-[/C][C]-[/C][/ROW]
[ROW][C]100[/C][C]12631.48[/C][C]-[/C][C]-[/C][C]-[/C][C]-[/C][C]-[/C][C]-[/C][C]-[/C][/ROW]
[ROW][C]101[/C][C]12268.53[/C][C]-[/C][C]-[/C][C]-[/C][C]-[/C][C]-[/C][C]-[/C][C]-[/C][/ROW]
[ROW][C]102[/C][C]12754.8[/C][C]-[/C][C]-[/C][C]-[/C][C]-[/C][C]-[/C][C]-[/C][C]-[/C][/ROW]
[ROW][C]103[/C][C]13407.75[/C][C]-[/C][C]-[/C][C]-[/C][C]-[/C][C]-[/C][C]-[/C][C]-[/C][/ROW]
[ROW][C]104[/C][C]13480.21[/C][C]-[/C][C]-[/C][C]-[/C][C]-[/C][C]-[/C][C]-[/C][C]-[/C][/ROW]
[ROW][C]105[/C][C]13673.28[/C][C]-[/C][C]-[/C][C]-[/C][C]-[/C][C]-[/C][C]-[/C][C]-[/C][/ROW]
[ROW][C]106[/C][C]13239.71[/C][C]-[/C][C]-[/C][C]-[/C][C]-[/C][C]-[/C][C]-[/C][C]-[/C][/ROW]
[ROW][C]107[/C][C]13557.69[/C][C]-[/C][C]-[/C][C]-[/C][C]-[/C][C]-[/C][C]-[/C][C]-[/C][/ROW]
[ROW][C]108[/C][C]13901.28[/C][C]-[/C][C]-[/C][C]-[/C][C]-[/C][C]-[/C][C]-[/C][C]-[/C][/ROW]
[ROW][C]109[/C][C]13200.58[/C][C]-[/C][C]-[/C][C]-[/C][C]-[/C][C]-[/C][C]-[/C][C]-[/C][/ROW]
[ROW][C]110[/C][C]13406.97[/C][C]13167.7146[/C][C]12514.1261[/C][C]13821.3032[/C][C]0.2365[/C][C]0.4607[/C][C]0.9911[/C][C]0.4607[/C][/ROW]
[ROW][C]111[/C][C]12538.12[/C][C]13196.777[/C][C]12223.758[/C][C]14169.796[/C][C]0.0923[/C][C]0.336[/C][C]0.9158[/C][C]0.4969[/C][/ROW]
[ROW][C]112[/C][C]12419.57[/C][C]13171.0776[/C][C]11994.5675[/C][C]14347.5876[/C][C]0.1053[/C][C]0.8542[/C][C]0.8157[/C][C]0.4804[/C][/ROW]
[ROW][C]113[/C][C]12193.88[/C][C]13193.8032[/C][C]11817.615[/C][C]14569.9915[/C][C]0.0772[/C][C]0.8649[/C][C]0.9062[/C][C]0.4961[/C][/ROW]
[ROW][C]114[/C][C]12656.63[/C][C]13173.7072[/C][C]11644.2011[/C][C]14703.2134[/C][C]0.2538[/C][C]0.8954[/C][C]0.7043[/C][C]0.4863[/C][/ROW]
[ROW][C]115[/C][C]12812.48[/C][C]13191.4778[/C][C]11505.8162[/C][C]14877.1395[/C][C]0.3297[/C][C]0.733[/C][C]0.4007[/C][C]0.4958[/C][/ROW]
[ROW][C]116[/C][C]12056.67[/C][C]13175.7636[/C][C]11361.0119[/C][C]14990.5153[/C][C]0.1134[/C][C]0.6526[/C][C]0.3711[/C][C]0.4893[/C][/ROW]
[ROW][C]117[/C][C]11322.38[/C][C]13189.6595[/C][C]11243.0094[/C][C]15136.3095[/C][C]0.03[/C][C]0.873[/C][C]0.3132[/C][C]0.4956[/C][/ROW]
[ROW][C]118[/C][C]11530.75[/C][C]13177.3715[/C][C]11116.7089[/C][C]15238.0341[/C][C]0.0587[/C][C]0.9612[/C][C]0.4764[/C][C]0.4912[/C][/ROW]
[ROW][C]119[/C][C]11114.08[/C][C]13188.2376[/C][C]11011.5819[/C][C]15364.8933[/C][C]0.0309[/C][C]0.9322[/C][C]0.3697[/C][C]0.4956[/C][/ROW]
[ROW][C]120[/C][C]9181.73[/C][C]13178.6289[/C][C]10898.5729[/C][C]15458.6848[/C][C]3e-04[/C][C]0.962[/C][C]0.2672[/C][C]0.4925[/C][/ROW]
[ROW][C]121[/C][C]8614.55[/C][C]13187.1257[/C][C]10802.4759[/C][C]15571.7755[/C][C]1e-04[/C][C]0.9995[/C][C]0.4956[/C][C]0.4956[/C][/ROW]
[/TABLE]
Source: https://freestatistics.org/blog/index.php?pk=33997&T=1

Globally Unique Identifier (entire table): ba.freestatistics.org/blog/index.php?pk=33997&T=1

As an alternative you can also use a QR Code:  

The GUIDs for individual cells are displayed in the table below:

Univariate ARIMA Extrapolation Forecast
timeY[t]F[t]95% LB95% UBp-value(H0: Y[t] = F[t])P(F[t]>Y[t-1])P(F[t]>Y[t-s])P(F[t]>Y[109])
9712185.15-------
9812377.62-------
9912512.89-------
10012631.48-------
10112268.53-------
10212754.8-------
10313407.75-------
10413480.21-------
10513673.28-------
10613239.71-------
10713557.69-------
10813901.28-------
10913200.58-------
11013406.9713167.714612514.126113821.30320.23650.46070.99110.4607
11112538.1213196.77712223.75814169.7960.09230.3360.91580.4969
11212419.5713171.077611994.567514347.58760.10530.85420.81570.4804
11312193.8813193.803211817.61514569.99150.07720.86490.90620.4961
11412656.6313173.707211644.201114703.21340.25380.89540.70430.4863
11512812.4813191.477811505.816214877.13950.32970.7330.40070.4958
11612056.6713175.763611361.011914990.51530.11340.65260.37110.4893
11711322.3813189.659511243.009415136.30950.030.8730.31320.4956
11811530.7513177.371511116.708915238.03410.05870.96120.47640.4912
11911114.0813188.237611011.581915364.89330.03090.93220.36970.4956
1209181.7313178.628910898.572915458.68483e-040.9620.26720.4925
1218614.5513187.125710802.475915571.77551e-040.99950.49560.4956


Univariate ARIMA Extrapolation Forecast Performance
time% S.E.PEMAPESq.EMSERMSE
1100.02530.01820.001557243.13054770.260969.0671
1110.0376-0.04990.0042433829.055436152.4213190.1379
1120.0456-0.05710.0048564763.619147063.6349216.9415
1130.0532-0.07580.0063999846.4483320.5367288.653
1140.0592-0.03930.0033267368.878322280.7399149.2673
1150.0652-0.02870.0024143639.352811969.9461109.4072
1160.0703-0.08490.00711252370.3857104364.1988323.0545
1170.0753-0.14160.01183486732.5886290561.049539.0371
1180.0798-0.1250.01042711362.3962225946.8664475.3387
1190.0842-0.15730.01314302129.6282358510.8023598.7577
1200.0883-0.30330.025315975200.55911331266.71331153.8053
1210.0923-0.34670.028920908448.59541742370.71631319.9889

\begin{tabular}{lllllllll}
\hline
Univariate ARIMA Extrapolation Forecast Performance \tabularnewline
time & % S.E. & PE & MAPE & Sq.E & MSE & RMSE \tabularnewline
110 & 0.0253 & 0.0182 & 0.0015 & 57243.1305 & 4770.2609 & 69.0671 \tabularnewline
111 & 0.0376 & -0.0499 & 0.0042 & 433829.0554 & 36152.4213 & 190.1379 \tabularnewline
112 & 0.0456 & -0.0571 & 0.0048 & 564763.6191 & 47063.6349 & 216.9415 \tabularnewline
113 & 0.0532 & -0.0758 & 0.0063 & 999846.44 & 83320.5367 & 288.653 \tabularnewline
114 & 0.0592 & -0.0393 & 0.0033 & 267368.8783 & 22280.7399 & 149.2673 \tabularnewline
115 & 0.0652 & -0.0287 & 0.0024 & 143639.3528 & 11969.9461 & 109.4072 \tabularnewline
116 & 0.0703 & -0.0849 & 0.0071 & 1252370.3857 & 104364.1988 & 323.0545 \tabularnewline
117 & 0.0753 & -0.1416 & 0.0118 & 3486732.5886 & 290561.049 & 539.0371 \tabularnewline
118 & 0.0798 & -0.125 & 0.0104 & 2711362.3962 & 225946.8664 & 475.3387 \tabularnewline
119 & 0.0842 & -0.1573 & 0.0131 & 4302129.6282 & 358510.8023 & 598.7577 \tabularnewline
120 & 0.0883 & -0.3033 & 0.0253 & 15975200.5591 & 1331266.7133 & 1153.8053 \tabularnewline
121 & 0.0923 & -0.3467 & 0.0289 & 20908448.5954 & 1742370.7163 & 1319.9889 \tabularnewline
\hline
\end{tabular}
%Source: https://freestatistics.org/blog/index.php?pk=33997&T=2

[TABLE]
[ROW][C]Univariate ARIMA Extrapolation Forecast Performance[/C][/ROW]
[ROW][C]time[/C][C]% S.E.[/C][C]PE[/C][C]MAPE[/C][C]Sq.E[/C][C]MSE[/C][C]RMSE[/C][/ROW]
[ROW][C]110[/C][C]0.0253[/C][C]0.0182[/C][C]0.0015[/C][C]57243.1305[/C][C]4770.2609[/C][C]69.0671[/C][/ROW]
[ROW][C]111[/C][C]0.0376[/C][C]-0.0499[/C][C]0.0042[/C][C]433829.0554[/C][C]36152.4213[/C][C]190.1379[/C][/ROW]
[ROW][C]112[/C][C]0.0456[/C][C]-0.0571[/C][C]0.0048[/C][C]564763.6191[/C][C]47063.6349[/C][C]216.9415[/C][/ROW]
[ROW][C]113[/C][C]0.0532[/C][C]-0.0758[/C][C]0.0063[/C][C]999846.44[/C][C]83320.5367[/C][C]288.653[/C][/ROW]
[ROW][C]114[/C][C]0.0592[/C][C]-0.0393[/C][C]0.0033[/C][C]267368.8783[/C][C]22280.7399[/C][C]149.2673[/C][/ROW]
[ROW][C]115[/C][C]0.0652[/C][C]-0.0287[/C][C]0.0024[/C][C]143639.3528[/C][C]11969.9461[/C][C]109.4072[/C][/ROW]
[ROW][C]116[/C][C]0.0703[/C][C]-0.0849[/C][C]0.0071[/C][C]1252370.3857[/C][C]104364.1988[/C][C]323.0545[/C][/ROW]
[ROW][C]117[/C][C]0.0753[/C][C]-0.1416[/C][C]0.0118[/C][C]3486732.5886[/C][C]290561.049[/C][C]539.0371[/C][/ROW]
[ROW][C]118[/C][C]0.0798[/C][C]-0.125[/C][C]0.0104[/C][C]2711362.3962[/C][C]225946.8664[/C][C]475.3387[/C][/ROW]
[ROW][C]119[/C][C]0.0842[/C][C]-0.1573[/C][C]0.0131[/C][C]4302129.6282[/C][C]358510.8023[/C][C]598.7577[/C][/ROW]
[ROW][C]120[/C][C]0.0883[/C][C]-0.3033[/C][C]0.0253[/C][C]15975200.5591[/C][C]1331266.7133[/C][C]1153.8053[/C][/ROW]
[ROW][C]121[/C][C]0.0923[/C][C]-0.3467[/C][C]0.0289[/C][C]20908448.5954[/C][C]1742370.7163[/C][C]1319.9889[/C][/ROW]
[/TABLE]
Source: https://freestatistics.org/blog/index.php?pk=33997&T=2

Globally Unique Identifier (entire table): ba.freestatistics.org/blog/index.php?pk=33997&T=2

As an alternative you can also use a QR Code:  

The GUIDs for individual cells are displayed in the table below:

Univariate ARIMA Extrapolation Forecast Performance
time% S.E.PEMAPESq.EMSERMSE
1100.02530.01820.001557243.13054770.260969.0671
1110.0376-0.04990.0042433829.055436152.4213190.1379
1120.0456-0.05710.0048564763.619147063.6349216.9415
1130.0532-0.07580.0063999846.4483320.5367288.653
1140.0592-0.03930.0033267368.878322280.7399149.2673
1150.0652-0.02870.0024143639.352811969.9461109.4072
1160.0703-0.08490.00711252370.3857104364.1988323.0545
1170.0753-0.14160.01183486732.5886290561.049539.0371
1180.0798-0.1250.01042711362.3962225946.8664475.3387
1190.0842-0.15730.01314302129.6282358510.8023598.7577
1200.0883-0.30330.025315975200.55911331266.71331153.8053
1210.0923-0.34670.028920908448.59541742370.71631319.9889


Parameters (Session):
par1 = 12 ; par2 = 1 ; par3 = 1 ; par4 = 0 ; par5 = 12 ; par6 = 1 ; par7 = 1 ; par8 = 0 ; par9 = 0 ; par10 = FALSE ;
Parameters (R input):
par1 = 12 ; par2 = 1 ; par3 = 1 ; par4 = 0 ; par5 = 12 ; par6 = 1 ; par7 = 1 ; par8 = 0 ; par9 = 0 ; par10 = FALSE ;
R code (references can be found in the software module):
par1 <- as.numeric(par1) #cut off periods
par2 <- as.numeric(par2) #lambda
par3 <- as.numeric(par3) #degree of non-seasonal differencing
par4 <- as.numeric(par4) #degree of seasonal differencing
par5 <- as.numeric(par5) #seasonal period
par6 <- as.numeric(par6) #p
par7 <- as.numeric(par7) #q
par8 <- as.numeric(par8) #P
par9 <- as.numeric(par9) #Q
if (par10 == 'TRUE') par10 <- TRUE
if (par10 == 'FALSE') par10 <- FALSE
if (par2 == 0) x <- log(x)
if (par2 != 0) x <- x^par2
lx <- length(x)
first <- lx - 2*par1
nx <- lx - par1
nx1 <- nx + 1
fx <- lx - nx
if (fx < 1) {
fx <- par5
nx1 <- lx + fx - 1
first <- lx - 2*fx
}
first <- 1
if (fx < 3) fx <- round(lx/10,0)
(arima.out <- arima(x[1:nx], order=c(par6,par3,par7), seasonal=list(order=c(par8,par4,par9), period=par5), include.mean=par10, method='ML'))
(forecast <- predict(arima.out,fx))
(lb <- forecast$pred - 1.96 * forecast$se)
(ub <- forecast$pred + 1.96 * forecast$se)
if (par2 == 0) {
x <- exp(x)
forecast$pred <- exp(forecast$pred)
lb <- exp(lb)
ub <- exp(ub)
}
if (par2 != 0) {
x <- x^(1/par2)
forecast$pred <- forecast$pred^(1/par2)
lb <- lb^(1/par2)
ub <- ub^(1/par2)
}
if (par2 < 0) {
olb <- lb
lb <- ub
ub <- olb
}
(actandfor <- c(x[1:nx], forecast$pred))
(perc.se <- (ub-forecast$pred)/1.96/forecast$pred)
bitmap(file='test1.png')
opar <- par(mar=c(4,4,2,2),las=1)
ylim <- c( min(x[first:nx],lb), max(x[first:nx],ub))
plot(x,ylim=ylim,type='n',xlim=c(first,lx))
usr <- par('usr')
rect(usr[1],usr[3],nx+1,usr[4],border=NA,col='lemonchiffon')
rect(nx1,usr[3],usr[2],usr[4],border=NA,col='lavender')
abline(h= (-3:3)*2 , col ='gray', lty =3)
polygon( c(nx1:lx,lx:nx1), c(lb,rev(ub)), col = 'orange', lty=2,border=NA)
lines(nx1:lx, lb , lty=2)
lines(nx1:lx, ub , lty=2)
lines(x, lwd=2)
lines(nx1:lx, forecast$pred , lwd=2 , col ='white')
box()
par(opar)
dev.off()
prob.dec <- array(NA, dim=fx)
prob.sdec <- array(NA, dim=fx)
prob.ldec <- array(NA, dim=fx)
prob.pval <- array(NA, dim=fx)
perf.pe <- array(0, dim=fx)
perf.mape <- array(0, dim=fx)
perf.se <- array(0, dim=fx)
perf.mse <- array(0, dim=fx)
perf.rmse <- array(0, dim=fx)
for (i in 1:fx) {
locSD <- (ub[i] - forecast$pred[i]) / 1.96
perf.pe[i] = (x[nx+i] - forecast$pred[i]) / forecast$pred[i]
perf.mape[i] = perf.mape[i] + abs(perf.pe[i])
perf.se[i] = (x[nx+i] - forecast$pred[i])^2
perf.mse[i] = perf.mse[i] + perf.se[i]
prob.dec[i] = pnorm((x[nx+i-1] - forecast$pred[i]) / locSD)
prob.sdec[i] = pnorm((x[nx+i-par5] - forecast$pred[i]) / locSD)
prob.ldec[i] = pnorm((x[nx] - forecast$pred[i]) / locSD)
prob.pval[i] = pnorm(abs(x[nx+i] - forecast$pred[i]) / locSD)
}
perf.mape = perf.mape / fx
perf.mse = perf.mse / fx
perf.rmse = sqrt(perf.mse)
bitmap(file='test2.png')
plot(forecast$pred, pch=19, type='b',main='ARIMA Extrapolation Forecast', ylab='Forecast and 95% CI', xlab='time',ylim=c(min(lb),max(ub)))
dum <- forecast$pred
dum[1:12] <- x[(nx+1):lx]
lines(dum, lty=1)
lines(ub,lty=3)
lines(lb,lty=3)
dev.off()
load(file='createtable')
a<-table.start()
a<-table.row.start(a)
a<-table.element(a,'Univariate ARIMA Extrapolation Forecast',9,TRUE)
a<-table.row.end(a)
a<-table.row.start(a)
a<-table.element(a,'time',1,header=TRUE)
a<-table.element(a,'Y[t]',1,header=TRUE)
a<-table.element(a,'F[t]',1,header=TRUE)
a<-table.element(a,'95% LB',1,header=TRUE)
a<-table.element(a,'95% UB',1,header=TRUE)
a<-table.element(a,'p-value
(H0: Y[t] = F[t])',1,header=TRUE)
a<-table.element(a,'P(F[t]>Y[t-1])',1,header=TRUE)
a<-table.element(a,'P(F[t]>Y[t-s])',1,header=TRUE)
mylab <- paste('P(F[t]>Y[',nx,sep='')
mylab <- paste(mylab,'])',sep='')
a<-table.element(a,mylab,1,header=TRUE)
a<-table.row.end(a)
for (i in (nx-par5):nx) {
a<-table.row.start(a)
a<-table.element(a,i,header=TRUE)
a<-table.element(a,x[i])
a<-table.element(a,'-')
a<-table.row.end(a)
}
for (i in 1:fx) {
a<-table.row.start(a)
a<-table.element(a,nx+i,header=TRUE)
a<-table.element(a,round(x[nx+i],4))
a<-table.element(a,round(forecast$pred[i],4))
a<-table.element(a,round(lb[i],4))
a<-table.element(a,round(ub[i],4))
a<-table.element(a,round((1-prob.pval[i]),4))
a<-table.element(a,round((1-prob.dec[i]),4))
a<-table.element(a,round((1-prob.sdec[i]),4))
a<-table.element(a,round((1-prob.ldec[i]),4))
a<-table.row.end(a)
}
a<-table.end(a)
table.save(a,file='mytable.tab')
a<-table.start()
a<-table.row.start(a)
a<-table.element(a,'Univariate ARIMA Extrapolation Forecast Performance',7,TRUE)
a<-table.row.end(a)
a<-table.row.start(a)
a<-table.element(a,'time',1,header=TRUE)
a<-table.element(a,'% S.E.',1,header=TRUE)
a<-table.element(a,'PE',1,header=TRUE)
a<-table.element(a,'MAPE',1,header=TRUE)
a<-table.element(a,'Sq.E',1,header=TRUE)
a<-table.element(a,'MSE',1,header=TRUE)
a<-table.element(a,'RMSE',1,header=TRUE)
a<-table.row.end(a)
for (i in 1:fx) {
a<-table.row.start(a)
a<-table.element(a,nx+i,header=TRUE)
a<-table.element(a,round(perc.se[i],4))
a<-table.element(a,round(perf.pe[i],4))
a<-table.element(a,round(perf.mape[i],4))
a<-table.element(a,round(perf.se[i],4))
a<-table.element(a,round(perf.mse[i],4))
a<-table.element(a,round(perf.rmse[i],4))
a<-table.row.end(a)
}
a<-table.end(a)
table.save(a,file='mytable1.tab')