Free Statistics

of Irreproducible Research!

Author's title

Author*Unverified author*
R Software Modulerwasp_autocorrelation.wasp
Title produced by software(Partial) Autocorrelation Function
Date of computationTue, 16 Dec 2008 09:03:27 -0700
Cite this page as followsStatistical Computations at FreeStatistics.org, Office for Research Development and Education, URL https://freestatistics.org/blog/index.php?v=date/2008/Dec/16/t122944362037fntjes28vljsq.htm/, Retrieved Wed, 15 May 2024 13:32:44 +0000
Statistical Computations at FreeStatistics.org, Office for Research Development and Education, URL https://freestatistics.org/blog/index.php?pk=33995, Retrieved Wed, 15 May 2024 13:32:44 +0000
QR Codes:

Original text written by user:
IsPrivate?No (this computation is public)
User-defined keywords
Estimated Impact167
Family? (F = Feedback message, R = changed R code, M = changed R Module, P = changed Parameters, D = changed Data)
-       [(Partial) Autocorrelation Function] [(Partial) Autocor...] [2008-12-16 16:03:27] [d41d8cd98f00b204e9800998ecf8427e] [Current]
Feedback Forum

Post a new message
Dataseries X:
101.2
100.5
98
106.6
90.1
96.9
125.9
112
100
123.9
79.8
83.4
113.6
112.9
104
109.9
99
106.3
128.9
111.1
102.9
130
87
87.5
117.6
103.4
110.8
112.6
102.5
112.4
135.6
105.1
127.7
137
91
90.5
122.4
123.3
124.3
120
118.1
119
142.7
123.6
129.6
151.6
110.4
99.2
130.5
136.2
129.7
128
121.6
135.8
143.8
147.5
136.2
156.6
123.3
100.4


Summary of computational transaction
Raw Inputview raw input (R code)
Raw Outputview raw output of R engine
Computing time4 seconds
R Server'Herman Ole Andreas Wold' @ 193.190.124.10:1001

\begin{tabular}{lllllllll}
\hline
Summary of computational transaction \tabularnewline
Raw Input & view raw input (R code)  \tabularnewline
Raw Output & view raw output of R engine  \tabularnewline
Computing time & 4 seconds \tabularnewline
R Server & 'Herman Ole Andreas Wold' @ 193.190.124.10:1001 \tabularnewline
\hline
\end{tabular}
%Source: https://freestatistics.org/blog/index.php?pk=33995&T=0

[TABLE]
[ROW][C]Summary of computational transaction[/C][/ROW]
[ROW][C]Raw Input[/C][C]view raw input (R code) [/C][/ROW]
[ROW][C]Raw Output[/C][C]view raw output of R engine [/C][/ROW]
[ROW][C]Computing time[/C][C]4 seconds[/C][/ROW]
[ROW][C]R Server[/C][C]'Herman Ole Andreas Wold' @ 193.190.124.10:1001[/C][/ROW]
[/TABLE]
Source: https://freestatistics.org/blog/index.php?pk=33995&T=0

Globally Unique Identifier (entire table): ba.freestatistics.org/blog/index.php?pk=33995&T=0

As an alternative you can also use a QR Code:  

The GUIDs for individual cells are displayed in the table below:

Summary of computational transaction
Raw Inputview raw input (R code)
Raw Outputview raw output of R engine
Computing time4 seconds
R Server'Herman Ole Andreas Wold' @ 193.190.124.10:1001


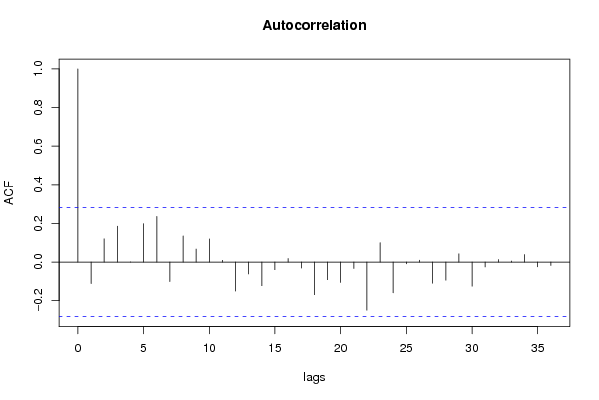
Autocorrelation Function
Time lag kACF(k)T-STATP-value
1-0.111277-0.7710.222257
20.1201470.83240.204653
30.185821.28740.102065
4-2.7e-05-2e-040.499926
50.1983851.37450.087842
60.2360951.63570.05422
7-0.101071-0.70020.243579
80.134930.93480.177279
90.0673960.46690.321329
100.1197430.82960.205435
110.009060.06280.475104
12-0.150642-1.04370.150931
13-0.061946-0.42920.334859
14-0.12273-0.85030.199691
15-0.039716-0.27520.392188
160.0179350.12430.450815
17-0.031103-0.21550.415151
18-0.168905-1.17020.123848
19-0.091694-0.63530.264133
20-0.105695-0.73230.23378
21-0.032954-0.22830.410186
22-0.249681-1.72980.045043
230.1000630.69330.245745
24-0.159275-1.10350.137658
25-0.009355-0.06480.474296
260.0096660.0670.473444
27-0.109482-0.75850.225926
28-0.094238-0.65290.258467
290.0428840.29710.383833
30-0.125433-0.8690.194579
31-0.025104-0.17390.431326
320.0128010.08870.464849
330.0047570.0330.486922
340.0386180.26760.395094
35-0.024691-0.17110.432446
36-0.017558-0.12160.451844

\begin{tabular}{lllllllll}
\hline
Autocorrelation Function \tabularnewline
Time lag k & ACF(k) & T-STAT & P-value \tabularnewline
1 & -0.111277 & -0.771 & 0.222257 \tabularnewline
2 & 0.120147 & 0.8324 & 0.204653 \tabularnewline
3 & 0.18582 & 1.2874 & 0.102065 \tabularnewline
4 & -2.7e-05 & -2e-04 & 0.499926 \tabularnewline
5 & 0.198385 & 1.3745 & 0.087842 \tabularnewline
6 & 0.236095 & 1.6357 & 0.05422 \tabularnewline
7 & -0.101071 & -0.7002 & 0.243579 \tabularnewline
8 & 0.13493 & 0.9348 & 0.177279 \tabularnewline
9 & 0.067396 & 0.4669 & 0.321329 \tabularnewline
10 & 0.119743 & 0.8296 & 0.205435 \tabularnewline
11 & 0.00906 & 0.0628 & 0.475104 \tabularnewline
12 & -0.150642 & -1.0437 & 0.150931 \tabularnewline
13 & -0.061946 & -0.4292 & 0.334859 \tabularnewline
14 & -0.12273 & -0.8503 & 0.199691 \tabularnewline
15 & -0.039716 & -0.2752 & 0.392188 \tabularnewline
16 & 0.017935 & 0.1243 & 0.450815 \tabularnewline
17 & -0.031103 & -0.2155 & 0.415151 \tabularnewline
18 & -0.168905 & -1.1702 & 0.123848 \tabularnewline
19 & -0.091694 & -0.6353 & 0.264133 \tabularnewline
20 & -0.105695 & -0.7323 & 0.23378 \tabularnewline
21 & -0.032954 & -0.2283 & 0.410186 \tabularnewline
22 & -0.249681 & -1.7298 & 0.045043 \tabularnewline
23 & 0.100063 & 0.6933 & 0.245745 \tabularnewline
24 & -0.159275 & -1.1035 & 0.137658 \tabularnewline
25 & -0.009355 & -0.0648 & 0.474296 \tabularnewline
26 & 0.009666 & 0.067 & 0.473444 \tabularnewline
27 & -0.109482 & -0.7585 & 0.225926 \tabularnewline
28 & -0.094238 & -0.6529 & 0.258467 \tabularnewline
29 & 0.042884 & 0.2971 & 0.383833 \tabularnewline
30 & -0.125433 & -0.869 & 0.194579 \tabularnewline
31 & -0.025104 & -0.1739 & 0.431326 \tabularnewline
32 & 0.012801 & 0.0887 & 0.464849 \tabularnewline
33 & 0.004757 & 0.033 & 0.486922 \tabularnewline
34 & 0.038618 & 0.2676 & 0.395094 \tabularnewline
35 & -0.024691 & -0.1711 & 0.432446 \tabularnewline
36 & -0.017558 & -0.1216 & 0.451844 \tabularnewline
\hline
\end{tabular}
%Source: https://freestatistics.org/blog/index.php?pk=33995&T=1

[TABLE]
[ROW][C]Autocorrelation Function[/C][/ROW]
[ROW][C]Time lag k[/C][C]ACF(k)[/C][C]T-STAT[/C][C]P-value[/C][/ROW]
[ROW][C]1[/C][C]-0.111277[/C][C]-0.771[/C][C]0.222257[/C][/ROW]
[ROW][C]2[/C][C]0.120147[/C][C]0.8324[/C][C]0.204653[/C][/ROW]
[ROW][C]3[/C][C]0.18582[/C][C]1.2874[/C][C]0.102065[/C][/ROW]
[ROW][C]4[/C][C]-2.7e-05[/C][C]-2e-04[/C][C]0.499926[/C][/ROW]
[ROW][C]5[/C][C]0.198385[/C][C]1.3745[/C][C]0.087842[/C][/ROW]
[ROW][C]6[/C][C]0.236095[/C][C]1.6357[/C][C]0.05422[/C][/ROW]
[ROW][C]7[/C][C]-0.101071[/C][C]-0.7002[/C][C]0.243579[/C][/ROW]
[ROW][C]8[/C][C]0.13493[/C][C]0.9348[/C][C]0.177279[/C][/ROW]
[ROW][C]9[/C][C]0.067396[/C][C]0.4669[/C][C]0.321329[/C][/ROW]
[ROW][C]10[/C][C]0.119743[/C][C]0.8296[/C][C]0.205435[/C][/ROW]
[ROW][C]11[/C][C]0.00906[/C][C]0.0628[/C][C]0.475104[/C][/ROW]
[ROW][C]12[/C][C]-0.150642[/C][C]-1.0437[/C][C]0.150931[/C][/ROW]
[ROW][C]13[/C][C]-0.061946[/C][C]-0.4292[/C][C]0.334859[/C][/ROW]
[ROW][C]14[/C][C]-0.12273[/C][C]-0.8503[/C][C]0.199691[/C][/ROW]
[ROW][C]15[/C][C]-0.039716[/C][C]-0.2752[/C][C]0.392188[/C][/ROW]
[ROW][C]16[/C][C]0.017935[/C][C]0.1243[/C][C]0.450815[/C][/ROW]
[ROW][C]17[/C][C]-0.031103[/C][C]-0.2155[/C][C]0.415151[/C][/ROW]
[ROW][C]18[/C][C]-0.168905[/C][C]-1.1702[/C][C]0.123848[/C][/ROW]
[ROW][C]19[/C][C]-0.091694[/C][C]-0.6353[/C][C]0.264133[/C][/ROW]
[ROW][C]20[/C][C]-0.105695[/C][C]-0.7323[/C][C]0.23378[/C][/ROW]
[ROW][C]21[/C][C]-0.032954[/C][C]-0.2283[/C][C]0.410186[/C][/ROW]
[ROW][C]22[/C][C]-0.249681[/C][C]-1.7298[/C][C]0.045043[/C][/ROW]
[ROW][C]23[/C][C]0.100063[/C][C]0.6933[/C][C]0.245745[/C][/ROW]
[ROW][C]24[/C][C]-0.159275[/C][C]-1.1035[/C][C]0.137658[/C][/ROW]
[ROW][C]25[/C][C]-0.009355[/C][C]-0.0648[/C][C]0.474296[/C][/ROW]
[ROW][C]26[/C][C]0.009666[/C][C]0.067[/C][C]0.473444[/C][/ROW]
[ROW][C]27[/C][C]-0.109482[/C][C]-0.7585[/C][C]0.225926[/C][/ROW]
[ROW][C]28[/C][C]-0.094238[/C][C]-0.6529[/C][C]0.258467[/C][/ROW]
[ROW][C]29[/C][C]0.042884[/C][C]0.2971[/C][C]0.383833[/C][/ROW]
[ROW][C]30[/C][C]-0.125433[/C][C]-0.869[/C][C]0.194579[/C][/ROW]
[ROW][C]31[/C][C]-0.025104[/C][C]-0.1739[/C][C]0.431326[/C][/ROW]
[ROW][C]32[/C][C]0.012801[/C][C]0.0887[/C][C]0.464849[/C][/ROW]
[ROW][C]33[/C][C]0.004757[/C][C]0.033[/C][C]0.486922[/C][/ROW]
[ROW][C]34[/C][C]0.038618[/C][C]0.2676[/C][C]0.395094[/C][/ROW]
[ROW][C]35[/C][C]-0.024691[/C][C]-0.1711[/C][C]0.432446[/C][/ROW]
[ROW][C]36[/C][C]-0.017558[/C][C]-0.1216[/C][C]0.451844[/C][/ROW]
[/TABLE]
Source: https://freestatistics.org/blog/index.php?pk=33995&T=1

Globally Unique Identifier (entire table): ba.freestatistics.org/blog/index.php?pk=33995&T=1

As an alternative you can also use a QR Code:  

The GUIDs for individual cells are displayed in the table below:

Autocorrelation Function
Time lag kACF(k)T-STATP-value
1-0.111277-0.7710.222257
20.1201470.83240.204653
30.185821.28740.102065
4-2.7e-05-2e-040.499926
50.1983851.37450.087842
60.2360951.63570.05422
7-0.101071-0.70020.243579
80.134930.93480.177279
90.0673960.46690.321329
100.1197430.82960.205435
110.009060.06280.475104
12-0.150642-1.04370.150931
13-0.061946-0.42920.334859
14-0.12273-0.85030.199691
15-0.039716-0.27520.392188
160.0179350.12430.450815
17-0.031103-0.21550.415151
18-0.168905-1.17020.123848
19-0.091694-0.63530.264133
20-0.105695-0.73230.23378
21-0.032954-0.22830.410186
22-0.249681-1.72980.045043
230.1000630.69330.245745
24-0.159275-1.10350.137658
25-0.009355-0.06480.474296
260.0096660.0670.473444
27-0.109482-0.75850.225926
28-0.094238-0.65290.258467
290.0428840.29710.383833
30-0.125433-0.8690.194579
31-0.025104-0.17390.431326
320.0128010.08870.464849
330.0047570.0330.486922
340.0386180.26760.395094
35-0.024691-0.17110.432446
36-0.017558-0.12160.451844


Partial Autocorrelation Function
Time lag kPACF(k)T-STATP-value
1-0.111277-0.7710.222257
20.1091150.7560.22668
30.2150641.490.071382
40.0333240.23090.409197
50.163851.13520.130966
60.2627481.82040.03747
7-0.088426-0.61260.271505
8-0.012193-0.08450.466516
90.0203680.14110.444186
100.121830.84410.20141
11-0.09329-0.64630.260571
12-0.273207-1.89280.032209
13-0.166069-1.15060.127806
14-0.221287-1.53310.065906
15-0.129114-0.89450.187752
160.0090370.06260.475169
170.2053391.42260.080655
180.0104030.07210.471422
19-0.089331-0.61890.269454
20-0.029094-0.20160.420553
210.0959110.66450.254778
22-0.198591-1.37590.087622
230.171331.1870.120533
240.0964350.66810.253628
250.0075080.0520.479365
26-0.159204-1.1030.137764
27-0.109724-0.76020.225429
28-0.037239-0.2580.398756
29-0.013614-0.09430.462624
30-0.006065-0.0420.483328
31-0.048172-0.33370.370012
32-0.016665-0.11550.454282
33-0.073991-0.51260.305282
34-0.010541-0.0730.471043
350.0703230.48720.314163
360.0678740.47020.320155

\begin{tabular}{lllllllll}
\hline
Partial Autocorrelation Function \tabularnewline
Time lag k & PACF(k) & T-STAT & P-value \tabularnewline
1 & -0.111277 & -0.771 & 0.222257 \tabularnewline
2 & 0.109115 & 0.756 & 0.22668 \tabularnewline
3 & 0.215064 & 1.49 & 0.071382 \tabularnewline
4 & 0.033324 & 0.2309 & 0.409197 \tabularnewline
5 & 0.16385 & 1.1352 & 0.130966 \tabularnewline
6 & 0.262748 & 1.8204 & 0.03747 \tabularnewline
7 & -0.088426 & -0.6126 & 0.271505 \tabularnewline
8 & -0.012193 & -0.0845 & 0.466516 \tabularnewline
9 & 0.020368 & 0.1411 & 0.444186 \tabularnewline
10 & 0.12183 & 0.8441 & 0.20141 \tabularnewline
11 & -0.09329 & -0.6463 & 0.260571 \tabularnewline
12 & -0.273207 & -1.8928 & 0.032209 \tabularnewline
13 & -0.166069 & -1.1506 & 0.127806 \tabularnewline
14 & -0.221287 & -1.5331 & 0.065906 \tabularnewline
15 & -0.129114 & -0.8945 & 0.187752 \tabularnewline
16 & 0.009037 & 0.0626 & 0.475169 \tabularnewline
17 & 0.205339 & 1.4226 & 0.080655 \tabularnewline
18 & 0.010403 & 0.0721 & 0.471422 \tabularnewline
19 & -0.089331 & -0.6189 & 0.269454 \tabularnewline
20 & -0.029094 & -0.2016 & 0.420553 \tabularnewline
21 & 0.095911 & 0.6645 & 0.254778 \tabularnewline
22 & -0.198591 & -1.3759 & 0.087622 \tabularnewline
23 & 0.17133 & 1.187 & 0.120533 \tabularnewline
24 & 0.096435 & 0.6681 & 0.253628 \tabularnewline
25 & 0.007508 & 0.052 & 0.479365 \tabularnewline
26 & -0.159204 & -1.103 & 0.137764 \tabularnewline
27 & -0.109724 & -0.7602 & 0.225429 \tabularnewline
28 & -0.037239 & -0.258 & 0.398756 \tabularnewline
29 & -0.013614 & -0.0943 & 0.462624 \tabularnewline
30 & -0.006065 & -0.042 & 0.483328 \tabularnewline
31 & -0.048172 & -0.3337 & 0.370012 \tabularnewline
32 & -0.016665 & -0.1155 & 0.454282 \tabularnewline
33 & -0.073991 & -0.5126 & 0.305282 \tabularnewline
34 & -0.010541 & -0.073 & 0.471043 \tabularnewline
35 & 0.070323 & 0.4872 & 0.314163 \tabularnewline
36 & 0.067874 & 0.4702 & 0.320155 \tabularnewline
\hline
\end{tabular}
%Source: https://freestatistics.org/blog/index.php?pk=33995&T=2

[TABLE]
[ROW][C]Partial Autocorrelation Function[/C][/ROW]
[ROW][C]Time lag k[/C][C]PACF(k)[/C][C]T-STAT[/C][C]P-value[/C][/ROW]
[ROW][C]1[/C][C]-0.111277[/C][C]-0.771[/C][C]0.222257[/C][/ROW]
[ROW][C]2[/C][C]0.109115[/C][C]0.756[/C][C]0.22668[/C][/ROW]
[ROW][C]3[/C][C]0.215064[/C][C]1.49[/C][C]0.071382[/C][/ROW]
[ROW][C]4[/C][C]0.033324[/C][C]0.2309[/C][C]0.409197[/C][/ROW]
[ROW][C]5[/C][C]0.16385[/C][C]1.1352[/C][C]0.130966[/C][/ROW]
[ROW][C]6[/C][C]0.262748[/C][C]1.8204[/C][C]0.03747[/C][/ROW]
[ROW][C]7[/C][C]-0.088426[/C][C]-0.6126[/C][C]0.271505[/C][/ROW]
[ROW][C]8[/C][C]-0.012193[/C][C]-0.0845[/C][C]0.466516[/C][/ROW]
[ROW][C]9[/C][C]0.020368[/C][C]0.1411[/C][C]0.444186[/C][/ROW]
[ROW][C]10[/C][C]0.12183[/C][C]0.8441[/C][C]0.20141[/C][/ROW]
[ROW][C]11[/C][C]-0.09329[/C][C]-0.6463[/C][C]0.260571[/C][/ROW]
[ROW][C]12[/C][C]-0.273207[/C][C]-1.8928[/C][C]0.032209[/C][/ROW]
[ROW][C]13[/C][C]-0.166069[/C][C]-1.1506[/C][C]0.127806[/C][/ROW]
[ROW][C]14[/C][C]-0.221287[/C][C]-1.5331[/C][C]0.065906[/C][/ROW]
[ROW][C]15[/C][C]-0.129114[/C][C]-0.8945[/C][C]0.187752[/C][/ROW]
[ROW][C]16[/C][C]0.009037[/C][C]0.0626[/C][C]0.475169[/C][/ROW]
[ROW][C]17[/C][C]0.205339[/C][C]1.4226[/C][C]0.080655[/C][/ROW]
[ROW][C]18[/C][C]0.010403[/C][C]0.0721[/C][C]0.471422[/C][/ROW]
[ROW][C]19[/C][C]-0.089331[/C][C]-0.6189[/C][C]0.269454[/C][/ROW]
[ROW][C]20[/C][C]-0.029094[/C][C]-0.2016[/C][C]0.420553[/C][/ROW]
[ROW][C]21[/C][C]0.095911[/C][C]0.6645[/C][C]0.254778[/C][/ROW]
[ROW][C]22[/C][C]-0.198591[/C][C]-1.3759[/C][C]0.087622[/C][/ROW]
[ROW][C]23[/C][C]0.17133[/C][C]1.187[/C][C]0.120533[/C][/ROW]
[ROW][C]24[/C][C]0.096435[/C][C]0.6681[/C][C]0.253628[/C][/ROW]
[ROW][C]25[/C][C]0.007508[/C][C]0.052[/C][C]0.479365[/C][/ROW]
[ROW][C]26[/C][C]-0.159204[/C][C]-1.103[/C][C]0.137764[/C][/ROW]
[ROW][C]27[/C][C]-0.109724[/C][C]-0.7602[/C][C]0.225429[/C][/ROW]
[ROW][C]28[/C][C]-0.037239[/C][C]-0.258[/C][C]0.398756[/C][/ROW]
[ROW][C]29[/C][C]-0.013614[/C][C]-0.0943[/C][C]0.462624[/C][/ROW]
[ROW][C]30[/C][C]-0.006065[/C][C]-0.042[/C][C]0.483328[/C][/ROW]
[ROW][C]31[/C][C]-0.048172[/C][C]-0.3337[/C][C]0.370012[/C][/ROW]
[ROW][C]32[/C][C]-0.016665[/C][C]-0.1155[/C][C]0.454282[/C][/ROW]
[ROW][C]33[/C][C]-0.073991[/C][C]-0.5126[/C][C]0.305282[/C][/ROW]
[ROW][C]34[/C][C]-0.010541[/C][C]-0.073[/C][C]0.471043[/C][/ROW]
[ROW][C]35[/C][C]0.070323[/C][C]0.4872[/C][C]0.314163[/C][/ROW]
[ROW][C]36[/C][C]0.067874[/C][C]0.4702[/C][C]0.320155[/C][/ROW]
[/TABLE]
Source: https://freestatistics.org/blog/index.php?pk=33995&T=2

Globally Unique Identifier (entire table): ba.freestatistics.org/blog/index.php?pk=33995&T=2

As an alternative you can also use a QR Code:  

The GUIDs for individual cells are displayed in the table below:

Partial Autocorrelation Function
Time lag kPACF(k)T-STATP-value
1-0.111277-0.7710.222257
20.1091150.7560.22668
30.2150641.490.071382
40.0333240.23090.409197
50.163851.13520.130966
60.2627481.82040.03747
7-0.088426-0.61260.271505
8-0.012193-0.08450.466516
90.0203680.14110.444186
100.121830.84410.20141
11-0.09329-0.64630.260571
12-0.273207-1.89280.032209
13-0.166069-1.15060.127806
14-0.221287-1.53310.065906
15-0.129114-0.89450.187752
160.0090370.06260.475169
170.2053391.42260.080655
180.0104030.07210.471422
19-0.089331-0.61890.269454
20-0.029094-0.20160.420553
210.0959110.66450.254778
22-0.198591-1.37590.087622
230.171331.1870.120533
240.0964350.66810.253628
250.0075080.0520.479365
26-0.159204-1.1030.137764
27-0.109724-0.76020.225429
28-0.037239-0.2580.398756
29-0.013614-0.09430.462624
30-0.006065-0.0420.483328
31-0.048172-0.33370.370012
32-0.016665-0.11550.454282
33-0.073991-0.51260.305282
34-0.010541-0.0730.471043
350.0703230.48720.314163
360.0678740.47020.320155


Parameters (Session):
par1 = 36 ; par2 = 1 ; par3 = 0 ; par4 = 1 ; par5 = 12 ;
Parameters (R input):
par1 = 36 ; par2 = 1 ; par3 = 0 ; par4 = 1 ; par5 = 12 ;
R code (references can be found in the software module):
if (par1 == 'Default') {
par1 = 10*log10(length(x))
} else {
par1 <- as.numeric(par1)
}
par2 <- as.numeric(par2)
par3 <- as.numeric(par3)
par4 <- as.numeric(par4)
par5 <- as.numeric(par5)
if (par2 == 0) {
x <- log(x)
} else {
x <- (x ^ par2 - 1) / par2
}
if (par3 > 0) x <- diff(x,lag=1,difference=par3)
if (par4 > 0) x <- diff(x,lag=par5,difference=par4)
bitmap(file='pic1.png')
racf <- acf(x,par1,main='Autocorrelation',xlab='lags',ylab='ACF')
dev.off()
bitmap(file='pic2.png')
rpacf <- pacf(x,par1,main='Partial Autocorrelation',xlab='lags',ylab='PACF')
dev.off()
(myacf <- c(racf$acf))
(mypacf <- c(rpacf$acf))
lengthx <- length(x)
sqrtn <- sqrt(lengthx)
load(file='createtable')
a<-table.start()
a<-table.row.start(a)
a<-table.element(a,'Autocorrelation Function',4,TRUE)
a<-table.row.end(a)
a<-table.row.start(a)
a<-table.element(a,'Time lag k',header=TRUE)
a<-table.element(a,hyperlink('basics.htm','ACF(k)','click here for more information about the Autocorrelation Function'),header=TRUE)
a<-table.element(a,'T-STAT',header=TRUE)
a<-table.element(a,'P-value',header=TRUE)
a<-table.row.end(a)
for (i in 2:(par1+1)) {
a<-table.row.start(a)
a<-table.element(a,i-1,header=TRUE)
a<-table.element(a,round(myacf[i],6))
mytstat <- myacf[i]*sqrtn
a<-table.element(a,round(mytstat,4))
a<-table.element(a,round(1-pt(abs(mytstat),lengthx),6))
a<-table.row.end(a)
}
a<-table.end(a)
table.save(a,file='mytable.tab')
a<-table.start()
a<-table.row.start(a)
a<-table.element(a,'Partial Autocorrelation Function',4,TRUE)
a<-table.row.end(a)
a<-table.row.start(a)
a<-table.element(a,'Time lag k',header=TRUE)
a<-table.element(a,hyperlink('basics.htm','PACF(k)','click here for more information about the Partial Autocorrelation Function'),header=TRUE)
a<-table.element(a,'T-STAT',header=TRUE)
a<-table.element(a,'P-value',header=TRUE)
a<-table.row.end(a)
for (i in 1:par1) {
a<-table.row.start(a)
a<-table.element(a,i,header=TRUE)
a<-table.element(a,round(mypacf[i],6))
mytstat <- mypacf[i]*sqrtn
a<-table.element(a,round(mytstat,4))
a<-table.element(a,round(1-pt(abs(mytstat),lengthx),6))
a<-table.row.end(a)
}
a<-table.end(a)
table.save(a,file='mytable1.tab')