Free Statistics

of Irreproducible Research!

Author's title

Author*The author of this computation has been verified*
R Software Modulerwasp_centraltendency.wasp
Title produced by softwareCentral Tendency
Date of computationTue, 16 Dec 2008 08:59:22 -0700
Cite this page as followsStatistical Computations at FreeStatistics.org, Office for Research Development and Education, URL https://freestatistics.org/blog/index.php?v=date/2008/Dec/16/t122944320453yx340bdmam52f.htm/, Retrieved Wed, 15 May 2024 07:28:04 +0000
Statistical Computations at FreeStatistics.org, Office for Research Development and Education, URL https://freestatistics.org/blog/index.php?pk=33994, Retrieved Wed, 15 May 2024 07:28:04 +0000
QR Codes:

Original text written by user:
IsPrivate?No (this computation is public)
User-defined keywords
Estimated Impact194
Family? (F = Feedback message, R = changed R code, M = changed R Module, P = changed Parameters, D = changed Data)
-     [Central Tendency] [Paper: Central Te...] [2008-12-16 15:47:28] [9e54d1454d464f1bf9ee4a54d5d56945]
-    D    [Central Tendency] [Paper: Central Te...] [2008-12-16 15:59:22] [8da7502cfecb272886bc60b3f290b8b8] [Current]
-    D      [Central Tendency] [Paper: Central Te...] [2008-12-16 16:45:52] [9e54d1454d464f1bf9ee4a54d5d56945]
-    D        [Central Tendency] [Paper: Central Te...] [2008-12-16 16:49:56] [9e54d1454d464f1bf9ee4a54d5d56945]
- RMPD        [Histogram] [Paper: histogram ...] [2008-12-16 17:12:52] [9e54d1454d464f1bf9ee4a54d5d56945]
-    D          [Histogram] [Paper: Histogram ...] [2008-12-16 17:16:37] [9e54d1454d464f1bf9ee4a54d5d56945]
-    D            [Histogram] [] [2008-12-22 22:01:25] [187876c4ad94aebda16017e4a72ae602]
-                 [Histogram] [] [2008-12-22 22:08:37] [187876c4ad94aebda16017e4a72ae602]
- RMPD          [Back to Back Histogram] [Paper: Bihistogra...] [2008-12-16 17:21:03] [9e54d1454d464f1bf9ee4a54d5d56945]
-                 [Back to Back Histogram] [] [2008-12-22 22:11:19] [187876c4ad94aebda16017e4a72ae602]
-               [Histogram] [] [2008-12-22 21:53:40] [84af9210cb1d82626c16de257e3e8f09]
-    D          [Histogram] [] [2008-12-22 22:06:44] [187876c4ad94aebda16017e4a72ae602]
Feedback Forum

Post a new message
Dataseries X:
1190,8
728,8
995,6
1260,3
994
957,3
975,6
884,9
908,4
1022,8
958,6
825,1
1116,6
724,2
1004,5
1058,9
854,7
943,4
792,4
873,2
1101,4
987,1
1038,8
1060,7
1047,7
840
1044
1097,4
987,5
934
977
881,1
1083,3
1074,7
1182,2
1117,5
1117,4
936,2
1246,3
1175,1
1177,7
1035,8
1091,6
998,7
1247,9
1034,7
1287,7
994,0
1122,8
1017,3
1106,0
1191,8
1030,1
989,4
979,6
1088,0
1389,2
1043,9
1182,1
1109,6
1463,3
1276,2
1082,4
1360,4
1130,2
1019,6
1077,0
958,8
959,6
907,2
880,8
759,6
1137,2


Summary of computational transaction
Raw Inputview raw input (R code)
Raw Outputview raw output of R engine
Computing time10 seconds
R Server'George Udny Yule' @ 72.249.76.132

\begin{tabular}{lllllllll}
\hline
Summary of computational transaction \tabularnewline
Raw Input & view raw input (R code)  \tabularnewline
Raw Output & view raw output of R engine  \tabularnewline
Computing time & 10 seconds \tabularnewline
R Server & 'George Udny Yule' @ 72.249.76.132 \tabularnewline
\hline
\end{tabular}
%Source: https://freestatistics.org/blog/index.php?pk=33994&T=0

[TABLE]
[ROW][C]Summary of computational transaction[/C][/ROW]
[ROW][C]Raw Input[/C][C]view raw input (R code) [/C][/ROW]
[ROW][C]Raw Output[/C][C]view raw output of R engine [/C][/ROW]
[ROW][C]Computing time[/C][C]10 seconds[/C][/ROW]
[ROW][C]R Server[/C][C]'George Udny Yule' @ 72.249.76.132[/C][/ROW]
[/TABLE]
Source: https://freestatistics.org/blog/index.php?pk=33994&T=0

Globally Unique Identifier (entire table): ba.freestatistics.org/blog/index.php?pk=33994&T=0

As an alternative you can also use a QR Code:  

The GUIDs for individual cells are displayed in the table below:

Summary of computational transaction
Raw Inputview raw input (R code)
Raw Outputview raw output of R engine
Computing time10 seconds
R Server'George Udny Yule' @ 72.249.76.132


Central Tendency - Ungrouped Data
MeasureValueS.E.Value/S.E.
Arithmetic Mean1042.8726027397317.069565591529861.0954389640247
Geometric Mean1032.82095493291
Harmonic Mean1022.69675824341
Quadratic Mean1052.88266703747
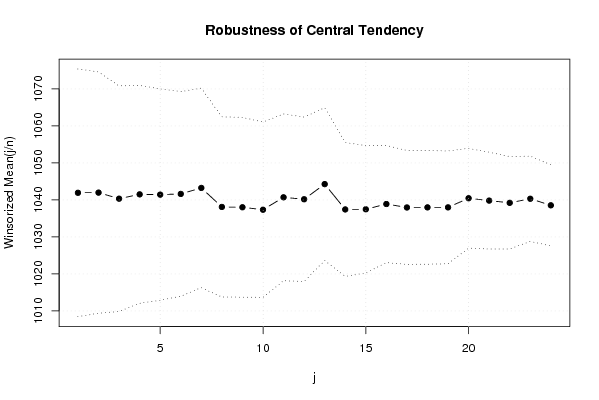
Winsorized Mean ( 1 / 24 )1041.9205479452116.73301723842662.2673444423711
Winsorized Mean ( 2 / 24 )1041.9753424657516.300898834694963.9213428064476
Winsorized Mean ( 3 / 24 )1040.3356164383615.241832077896868.2552865771969
Winsorized Mean ( 4 / 24 )1041.4972602739714.715268421115970.7766403213864
Winsorized Mean ( 5 / 24 )1041.4287671232914.274318814692672.9582112213541
Winsorized Mean ( 6 / 24 )1041.6178082191813.828277166753475.3252046989253
Winsorized Mean ( 7 / 24 )1043.2383561643813.474201719835777.4248729428334
Winsorized Mean ( 8 / 24 )1038.0986301369912.172636068149185.281333009969
Winsorized Mean ( 9 / 24 )1038.0123287671212.144416375708085.4723929626964
Winsorized Mean ( 10 / 24 )1037.3547945205511.848216417337087.5536669808486
Winsorized Mean ( 11 / 24 )1040.711.268304236454492.356398812272
Winsorized Mean ( 12 / 24 )1040.1739726027411.110621302875593.6197845509808
Winsorized Mean ( 13 / 24 )1044.2698630137010.3147669197771101.240277277760
Winsorized Mean ( 14 / 24 )1037.423287671239.04848127567832114.651647725652
Winsorized Mean ( 15 / 24 )1037.464383561648.60327854435782120.589421603934
Winsorized Mean ( 16 / 24 )1038.889041095897.91230871680317131.300367349119
Winsorized Mean ( 17 / 24 )1037.957534246587.68933835546207134.986586135759
Winsorized Mean ( 18 / 24 )1037.982191780827.6787301711511135.176281578497
Winsorized Mean ( 19 / 24 )1037.982191780827.61906837988865136.234791450447
Winsorized Mean ( 20 / 24 )1040.447945205486.73750100165444154.426388203874
Winsorized Mean ( 21 / 24 )1039.815068493156.53706318586684159.064558338863
Winsorized Mean ( 22 / 24 )1039.212328767126.23932145442023166.558549092048
Winsorized Mean ( 23 / 24 )1040.315068493155.75660089357584180.716900081454
Winsorized Mean ( 24 / 24 )1038.539726027405.48004986274727189.512824160099
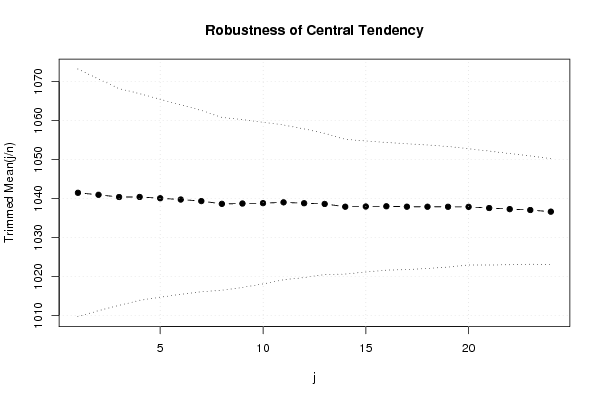
Trimmed Mean ( 1 / 24 )1041.4394366197215.877953975566165.5902793409243
Trimmed Mean ( 2 / 24 )1040.9304347826114.847083051060870.1100971283538
Trimmed Mean ( 3 / 24 )1040.3611940298513.889267769842274.9039626328457
Trimmed Mean ( 4 / 24 )1040.3707692307713.250494860693178.515616221774
Trimmed Mean ( 5 / 24 )1040.0444444444412.684187449472081.995354340789
Trimmed Mean ( 6 / 24 )1039.7131147541012.145451930573485.6051401543044
Trimmed Mean ( 7 / 24 )1039.3203389830511.623265072215789.417244855531
Trimmed Mean ( 8 / 24 )1038.6035087719311.079674985086093.7395284762382
Trimmed Mean ( 9 / 24 )1038.6872727272710.753996377056696.5861653945955
Trimmed Mean ( 10 / 24 )1038.7905660377410.3547957183976100.31975466132
Trimmed Mean ( 11 / 24 )1038.996078431379.9262484119411104.671577348546
Trimmed Mean ( 12 / 24 )1038.765306122459.52531962031832109.053065674214
Trimmed Mean ( 13 / 24 )1038.582978723409.05072217394932114.751393177525
Trimmed Mean ( 14 / 24 )1037.873333333338.6311717195596120.247095881704
Trimmed Mean ( 15 / 24 )1037.927906976748.39569995247158123.626131573603
Trimmed Mean ( 16 / 24 )1037.982926829278.18427768647035126.826455136681
Trimmed Mean ( 17 / 24 )1037.876923076928.05459731721514128.855221707814
Trimmed Mean ( 18 / 24 )1037.867567567577.91861574305111131.066792637127
Trimmed Mean ( 19 / 24 )1037.854285714297.7212609921258134.415128147164
Trimmed Mean ( 20 / 24 )1037.839393939397.4506354459957139.295420029868
Trimmed Mean ( 21 / 24 )1037.532258064527.30255425500163142.077993786064
Trimmed Mean ( 22 / 24 )1037.258620689667.12660234724778145.547425006845
Trimmed Mean ( 23 / 24 )1037.018518518526.93889084677021149.450184679186
Trimmed Mean ( 24 / 24 )1036.66.78943787560257152.678324626102
Median1035.8
Midrange1093.75
Midmean - Weighted Average at Xnp1035.65833333333
Midmean - Weighted Average at X(n+1)p1037.86756756757
Midmean - Empirical Distribution Function1037.86756756757
Midmean - Empirical Distribution Function - Averaging1037.86756756757
Midmean - Empirical Distribution Function - Interpolation1037.86756756757
Midmean - Closest Observation1035.78157894737
Midmean - True Basic - Statistics Graphics Toolkit1037.86756756757
Midmean - MS Excel (old versions)1037.86756756757
Number of observations73

\begin{tabular}{lllllllll}
\hline
Central Tendency - Ungrouped Data \tabularnewline
Measure & Value & S.E. & Value/S.E. \tabularnewline
Arithmetic Mean & 1042.87260273973 & 17.0695655915298 & 61.0954389640247 \tabularnewline
Geometric Mean & 1032.82095493291 &  &  \tabularnewline
Harmonic Mean & 1022.69675824341 &  &  \tabularnewline
Quadratic Mean & 1052.88266703747 &  &  \tabularnewline
Winsorized Mean ( 1 / 24 ) & 1041.92054794521 & 16.733017238426 & 62.2673444423711 \tabularnewline
Winsorized Mean ( 2 / 24 ) & 1041.97534246575 & 16.3008988346949 & 63.9213428064476 \tabularnewline
Winsorized Mean ( 3 / 24 ) & 1040.33561643836 & 15.2418320778968 & 68.2552865771969 \tabularnewline
Winsorized Mean ( 4 / 24 ) & 1041.49726027397 & 14.7152684211159 & 70.7766403213864 \tabularnewline
Winsorized Mean ( 5 / 24 ) & 1041.42876712329 & 14.2743188146926 & 72.9582112213541 \tabularnewline
Winsorized Mean ( 6 / 24 ) & 1041.61780821918 & 13.8282771667534 & 75.3252046989253 \tabularnewline
Winsorized Mean ( 7 / 24 ) & 1043.23835616438 & 13.4742017198357 & 77.4248729428334 \tabularnewline
Winsorized Mean ( 8 / 24 ) & 1038.09863013699 & 12.1726360681491 & 85.281333009969 \tabularnewline
Winsorized Mean ( 9 / 24 ) & 1038.01232876712 & 12.1444163757080 & 85.4723929626964 \tabularnewline
Winsorized Mean ( 10 / 24 ) & 1037.35479452055 & 11.8482164173370 & 87.5536669808486 \tabularnewline
Winsorized Mean ( 11 / 24 ) & 1040.7 & 11.2683042364544 & 92.356398812272 \tabularnewline
Winsorized Mean ( 12 / 24 ) & 1040.17397260274 & 11.1106213028755 & 93.6197845509808 \tabularnewline
Winsorized Mean ( 13 / 24 ) & 1044.26986301370 & 10.3147669197771 & 101.240277277760 \tabularnewline
Winsorized Mean ( 14 / 24 ) & 1037.42328767123 & 9.04848127567832 & 114.651647725652 \tabularnewline
Winsorized Mean ( 15 / 24 ) & 1037.46438356164 & 8.60327854435782 & 120.589421603934 \tabularnewline
Winsorized Mean ( 16 / 24 ) & 1038.88904109589 & 7.91230871680317 & 131.300367349119 \tabularnewline
Winsorized Mean ( 17 / 24 ) & 1037.95753424658 & 7.68933835546207 & 134.986586135759 \tabularnewline
Winsorized Mean ( 18 / 24 ) & 1037.98219178082 & 7.6787301711511 & 135.176281578497 \tabularnewline
Winsorized Mean ( 19 / 24 ) & 1037.98219178082 & 7.61906837988865 & 136.234791450447 \tabularnewline
Winsorized Mean ( 20 / 24 ) & 1040.44794520548 & 6.73750100165444 & 154.426388203874 \tabularnewline
Winsorized Mean ( 21 / 24 ) & 1039.81506849315 & 6.53706318586684 & 159.064558338863 \tabularnewline
Winsorized Mean ( 22 / 24 ) & 1039.21232876712 & 6.23932145442023 & 166.558549092048 \tabularnewline
Winsorized Mean ( 23 / 24 ) & 1040.31506849315 & 5.75660089357584 & 180.716900081454 \tabularnewline
Winsorized Mean ( 24 / 24 ) & 1038.53972602740 & 5.48004986274727 & 189.512824160099 \tabularnewline
Trimmed Mean ( 1 / 24 ) & 1041.43943661972 & 15.8779539755661 & 65.5902793409243 \tabularnewline
Trimmed Mean ( 2 / 24 ) & 1040.93043478261 & 14.8470830510608 & 70.1100971283538 \tabularnewline
Trimmed Mean ( 3 / 24 ) & 1040.36119402985 & 13.8892677698422 & 74.9039626328457 \tabularnewline
Trimmed Mean ( 4 / 24 ) & 1040.37076923077 & 13.2504948606931 & 78.515616221774 \tabularnewline
Trimmed Mean ( 5 / 24 ) & 1040.04444444444 & 12.6841874494720 & 81.995354340789 \tabularnewline
Trimmed Mean ( 6 / 24 ) & 1039.71311475410 & 12.1454519305734 & 85.6051401543044 \tabularnewline
Trimmed Mean ( 7 / 24 ) & 1039.32033898305 & 11.6232650722157 & 89.417244855531 \tabularnewline
Trimmed Mean ( 8 / 24 ) & 1038.60350877193 & 11.0796749850860 & 93.7395284762382 \tabularnewline
Trimmed Mean ( 9 / 24 ) & 1038.68727272727 & 10.7539963770566 & 96.5861653945955 \tabularnewline
Trimmed Mean ( 10 / 24 ) & 1038.79056603774 & 10.3547957183976 & 100.31975466132 \tabularnewline
Trimmed Mean ( 11 / 24 ) & 1038.99607843137 & 9.9262484119411 & 104.671577348546 \tabularnewline
Trimmed Mean ( 12 / 24 ) & 1038.76530612245 & 9.52531962031832 & 109.053065674214 \tabularnewline
Trimmed Mean ( 13 / 24 ) & 1038.58297872340 & 9.05072217394932 & 114.751393177525 \tabularnewline
Trimmed Mean ( 14 / 24 ) & 1037.87333333333 & 8.6311717195596 & 120.247095881704 \tabularnewline
Trimmed Mean ( 15 / 24 ) & 1037.92790697674 & 8.39569995247158 & 123.626131573603 \tabularnewline
Trimmed Mean ( 16 / 24 ) & 1037.98292682927 & 8.18427768647035 & 126.826455136681 \tabularnewline
Trimmed Mean ( 17 / 24 ) & 1037.87692307692 & 8.05459731721514 & 128.855221707814 \tabularnewline
Trimmed Mean ( 18 / 24 ) & 1037.86756756757 & 7.91861574305111 & 131.066792637127 \tabularnewline
Trimmed Mean ( 19 / 24 ) & 1037.85428571429 & 7.7212609921258 & 134.415128147164 \tabularnewline
Trimmed Mean ( 20 / 24 ) & 1037.83939393939 & 7.4506354459957 & 139.295420029868 \tabularnewline
Trimmed Mean ( 21 / 24 ) & 1037.53225806452 & 7.30255425500163 & 142.077993786064 \tabularnewline
Trimmed Mean ( 22 / 24 ) & 1037.25862068966 & 7.12660234724778 & 145.547425006845 \tabularnewline
Trimmed Mean ( 23 / 24 ) & 1037.01851851852 & 6.93889084677021 & 149.450184679186 \tabularnewline
Trimmed Mean ( 24 / 24 ) & 1036.6 & 6.78943787560257 & 152.678324626102 \tabularnewline
Median & 1035.8 &  &  \tabularnewline
Midrange & 1093.75 &  &  \tabularnewline
Midmean - Weighted Average at Xnp & 1035.65833333333 &  &  \tabularnewline
Midmean - Weighted Average at X(n+1)p & 1037.86756756757 &  &  \tabularnewline
Midmean - Empirical Distribution Function & 1037.86756756757 &  &  \tabularnewline
Midmean - Empirical Distribution Function - Averaging & 1037.86756756757 &  &  \tabularnewline
Midmean - Empirical Distribution Function - Interpolation & 1037.86756756757 &  &  \tabularnewline
Midmean - Closest Observation & 1035.78157894737 &  &  \tabularnewline
Midmean - True Basic - Statistics Graphics Toolkit & 1037.86756756757 &  &  \tabularnewline
Midmean - MS Excel (old versions) & 1037.86756756757 &  &  \tabularnewline
Number of observations & 73 &  &  \tabularnewline
\hline
\end{tabular}
%Source: https://freestatistics.org/blog/index.php?pk=33994&T=1

[TABLE]
[ROW][C]Central Tendency - Ungrouped Data[/C][/ROW]
[ROW][C]Measure[/C][C]Value[/C][C]S.E.[/C][C]Value/S.E.[/C][/ROW]
[ROW][C]Arithmetic Mean[/C][C]1042.87260273973[/C][C]17.0695655915298[/C][C]61.0954389640247[/C][/ROW]
[ROW][C]Geometric Mean[/C][C]1032.82095493291[/C][C][/C][C][/C][/ROW]
[ROW][C]Harmonic Mean[/C][C]1022.69675824341[/C][C][/C][C][/C][/ROW]
[ROW][C]Quadratic Mean[/C][C]1052.88266703747[/C][C][/C][C][/C][/ROW]
[ROW][C]Winsorized Mean ( 1 / 24 )[/C][C]1041.92054794521[/C][C]16.733017238426[/C][C]62.2673444423711[/C][/ROW]
[ROW][C]Winsorized Mean ( 2 / 24 )[/C][C]1041.97534246575[/C][C]16.3008988346949[/C][C]63.9213428064476[/C][/ROW]
[ROW][C]Winsorized Mean ( 3 / 24 )[/C][C]1040.33561643836[/C][C]15.2418320778968[/C][C]68.2552865771969[/C][/ROW]
[ROW][C]Winsorized Mean ( 4 / 24 )[/C][C]1041.49726027397[/C][C]14.7152684211159[/C][C]70.7766403213864[/C][/ROW]
[ROW][C]Winsorized Mean ( 5 / 24 )[/C][C]1041.42876712329[/C][C]14.2743188146926[/C][C]72.9582112213541[/C][/ROW]
[ROW][C]Winsorized Mean ( 6 / 24 )[/C][C]1041.61780821918[/C][C]13.8282771667534[/C][C]75.3252046989253[/C][/ROW]
[ROW][C]Winsorized Mean ( 7 / 24 )[/C][C]1043.23835616438[/C][C]13.4742017198357[/C][C]77.4248729428334[/C][/ROW]
[ROW][C]Winsorized Mean ( 8 / 24 )[/C][C]1038.09863013699[/C][C]12.1726360681491[/C][C]85.281333009969[/C][/ROW]
[ROW][C]Winsorized Mean ( 9 / 24 )[/C][C]1038.01232876712[/C][C]12.1444163757080[/C][C]85.4723929626964[/C][/ROW]
[ROW][C]Winsorized Mean ( 10 / 24 )[/C][C]1037.35479452055[/C][C]11.8482164173370[/C][C]87.5536669808486[/C][/ROW]
[ROW][C]Winsorized Mean ( 11 / 24 )[/C][C]1040.7[/C][C]11.2683042364544[/C][C]92.356398812272[/C][/ROW]
[ROW][C]Winsorized Mean ( 12 / 24 )[/C][C]1040.17397260274[/C][C]11.1106213028755[/C][C]93.6197845509808[/C][/ROW]
[ROW][C]Winsorized Mean ( 13 / 24 )[/C][C]1044.26986301370[/C][C]10.3147669197771[/C][C]101.240277277760[/C][/ROW]
[ROW][C]Winsorized Mean ( 14 / 24 )[/C][C]1037.42328767123[/C][C]9.04848127567832[/C][C]114.651647725652[/C][/ROW]
[ROW][C]Winsorized Mean ( 15 / 24 )[/C][C]1037.46438356164[/C][C]8.60327854435782[/C][C]120.589421603934[/C][/ROW]
[ROW][C]Winsorized Mean ( 16 / 24 )[/C][C]1038.88904109589[/C][C]7.91230871680317[/C][C]131.300367349119[/C][/ROW]
[ROW][C]Winsorized Mean ( 17 / 24 )[/C][C]1037.95753424658[/C][C]7.68933835546207[/C][C]134.986586135759[/C][/ROW]
[ROW][C]Winsorized Mean ( 18 / 24 )[/C][C]1037.98219178082[/C][C]7.6787301711511[/C][C]135.176281578497[/C][/ROW]
[ROW][C]Winsorized Mean ( 19 / 24 )[/C][C]1037.98219178082[/C][C]7.61906837988865[/C][C]136.234791450447[/C][/ROW]
[ROW][C]Winsorized Mean ( 20 / 24 )[/C][C]1040.44794520548[/C][C]6.73750100165444[/C][C]154.426388203874[/C][/ROW]
[ROW][C]Winsorized Mean ( 21 / 24 )[/C][C]1039.81506849315[/C][C]6.53706318586684[/C][C]159.064558338863[/C][/ROW]
[ROW][C]Winsorized Mean ( 22 / 24 )[/C][C]1039.21232876712[/C][C]6.23932145442023[/C][C]166.558549092048[/C][/ROW]
[ROW][C]Winsorized Mean ( 23 / 24 )[/C][C]1040.31506849315[/C][C]5.75660089357584[/C][C]180.716900081454[/C][/ROW]
[ROW][C]Winsorized Mean ( 24 / 24 )[/C][C]1038.53972602740[/C][C]5.48004986274727[/C][C]189.512824160099[/C][/ROW]
[ROW][C]Trimmed Mean ( 1 / 24 )[/C][C]1041.43943661972[/C][C]15.8779539755661[/C][C]65.5902793409243[/C][/ROW]
[ROW][C]Trimmed Mean ( 2 / 24 )[/C][C]1040.93043478261[/C][C]14.8470830510608[/C][C]70.1100971283538[/C][/ROW]
[ROW][C]Trimmed Mean ( 3 / 24 )[/C][C]1040.36119402985[/C][C]13.8892677698422[/C][C]74.9039626328457[/C][/ROW]
[ROW][C]Trimmed Mean ( 4 / 24 )[/C][C]1040.37076923077[/C][C]13.2504948606931[/C][C]78.515616221774[/C][/ROW]
[ROW][C]Trimmed Mean ( 5 / 24 )[/C][C]1040.04444444444[/C][C]12.6841874494720[/C][C]81.995354340789[/C][/ROW]
[ROW][C]Trimmed Mean ( 6 / 24 )[/C][C]1039.71311475410[/C][C]12.1454519305734[/C][C]85.6051401543044[/C][/ROW]
[ROW][C]Trimmed Mean ( 7 / 24 )[/C][C]1039.32033898305[/C][C]11.6232650722157[/C][C]89.417244855531[/C][/ROW]
[ROW][C]Trimmed Mean ( 8 / 24 )[/C][C]1038.60350877193[/C][C]11.0796749850860[/C][C]93.7395284762382[/C][/ROW]
[ROW][C]Trimmed Mean ( 9 / 24 )[/C][C]1038.68727272727[/C][C]10.7539963770566[/C][C]96.5861653945955[/C][/ROW]
[ROW][C]Trimmed Mean ( 10 / 24 )[/C][C]1038.79056603774[/C][C]10.3547957183976[/C][C]100.31975466132[/C][/ROW]
[ROW][C]Trimmed Mean ( 11 / 24 )[/C][C]1038.99607843137[/C][C]9.9262484119411[/C][C]104.671577348546[/C][/ROW]
[ROW][C]Trimmed Mean ( 12 / 24 )[/C][C]1038.76530612245[/C][C]9.52531962031832[/C][C]109.053065674214[/C][/ROW]
[ROW][C]Trimmed Mean ( 13 / 24 )[/C][C]1038.58297872340[/C][C]9.05072217394932[/C][C]114.751393177525[/C][/ROW]
[ROW][C]Trimmed Mean ( 14 / 24 )[/C][C]1037.87333333333[/C][C]8.6311717195596[/C][C]120.247095881704[/C][/ROW]
[ROW][C]Trimmed Mean ( 15 / 24 )[/C][C]1037.92790697674[/C][C]8.39569995247158[/C][C]123.626131573603[/C][/ROW]
[ROW][C]Trimmed Mean ( 16 / 24 )[/C][C]1037.98292682927[/C][C]8.18427768647035[/C][C]126.826455136681[/C][/ROW]
[ROW][C]Trimmed Mean ( 17 / 24 )[/C][C]1037.87692307692[/C][C]8.05459731721514[/C][C]128.855221707814[/C][/ROW]
[ROW][C]Trimmed Mean ( 18 / 24 )[/C][C]1037.86756756757[/C][C]7.91861574305111[/C][C]131.066792637127[/C][/ROW]
[ROW][C]Trimmed Mean ( 19 / 24 )[/C][C]1037.85428571429[/C][C]7.7212609921258[/C][C]134.415128147164[/C][/ROW]
[ROW][C]Trimmed Mean ( 20 / 24 )[/C][C]1037.83939393939[/C][C]7.4506354459957[/C][C]139.295420029868[/C][/ROW]
[ROW][C]Trimmed Mean ( 21 / 24 )[/C][C]1037.53225806452[/C][C]7.30255425500163[/C][C]142.077993786064[/C][/ROW]
[ROW][C]Trimmed Mean ( 22 / 24 )[/C][C]1037.25862068966[/C][C]7.12660234724778[/C][C]145.547425006845[/C][/ROW]
[ROW][C]Trimmed Mean ( 23 / 24 )[/C][C]1037.01851851852[/C][C]6.93889084677021[/C][C]149.450184679186[/C][/ROW]
[ROW][C]Trimmed Mean ( 24 / 24 )[/C][C]1036.6[/C][C]6.78943787560257[/C][C]152.678324626102[/C][/ROW]
[ROW][C]Median[/C][C]1035.8[/C][C][/C][C][/C][/ROW]
[ROW][C]Midrange[/C][C]1093.75[/C][C][/C][C][/C][/ROW]
[ROW][C]Midmean - Weighted Average at Xnp[/C][C]1035.65833333333[/C][C][/C][C][/C][/ROW]
[ROW][C]Midmean - Weighted Average at X(n+1)p[/C][C]1037.86756756757[/C][C][/C][C][/C][/ROW]
[ROW][C]Midmean - Empirical Distribution Function[/C][C]1037.86756756757[/C][C][/C][C][/C][/ROW]
[ROW][C]Midmean - Empirical Distribution Function - Averaging[/C][C]1037.86756756757[/C][C][/C][C][/C][/ROW]
[ROW][C]Midmean - Empirical Distribution Function - Interpolation[/C][C]1037.86756756757[/C][C][/C][C][/C][/ROW]
[ROW][C]Midmean - Closest Observation[/C][C]1035.78157894737[/C][C][/C][C][/C][/ROW]
[ROW][C]Midmean - True Basic - Statistics Graphics Toolkit[/C][C]1037.86756756757[/C][C][/C][C][/C][/ROW]
[ROW][C]Midmean - MS Excel (old versions)[/C][C]1037.86756756757[/C][C][/C][C][/C][/ROW]
[ROW][C]Number of observations[/C][C]73[/C][C][/C][C][/C][/ROW]
[/TABLE]
Source: https://freestatistics.org/blog/index.php?pk=33994&T=1

Globally Unique Identifier (entire table): ba.freestatistics.org/blog/index.php?pk=33994&T=1

As an alternative you can also use a QR Code:  

The GUIDs for individual cells are displayed in the table below:

Central Tendency - Ungrouped Data
MeasureValueS.E.Value/S.E.
Arithmetic Mean1042.8726027397317.069565591529861.0954389640247
Geometric Mean1032.82095493291
Harmonic Mean1022.69675824341
Quadratic Mean1052.88266703747
Winsorized Mean ( 1 / 24 )1041.9205479452116.73301723842662.2673444423711
Winsorized Mean ( 2 / 24 )1041.9753424657516.300898834694963.9213428064476
Winsorized Mean ( 3 / 24 )1040.3356164383615.241832077896868.2552865771969
Winsorized Mean ( 4 / 24 )1041.4972602739714.715268421115970.7766403213864
Winsorized Mean ( 5 / 24 )1041.4287671232914.274318814692672.9582112213541
Winsorized Mean ( 6 / 24 )1041.6178082191813.828277166753475.3252046989253
Winsorized Mean ( 7 / 24 )1043.2383561643813.474201719835777.4248729428334
Winsorized Mean ( 8 / 24 )1038.0986301369912.172636068149185.281333009969
Winsorized Mean ( 9 / 24 )1038.0123287671212.144416375708085.4723929626964
Winsorized Mean ( 10 / 24 )1037.3547945205511.848216417337087.5536669808486
Winsorized Mean ( 11 / 24 )1040.711.268304236454492.356398812272
Winsorized Mean ( 12 / 24 )1040.1739726027411.110621302875593.6197845509808
Winsorized Mean ( 13 / 24 )1044.2698630137010.3147669197771101.240277277760
Winsorized Mean ( 14 / 24 )1037.423287671239.04848127567832114.651647725652
Winsorized Mean ( 15 / 24 )1037.464383561648.60327854435782120.589421603934
Winsorized Mean ( 16 / 24 )1038.889041095897.91230871680317131.300367349119
Winsorized Mean ( 17 / 24 )1037.957534246587.68933835546207134.986586135759
Winsorized Mean ( 18 / 24 )1037.982191780827.6787301711511135.176281578497
Winsorized Mean ( 19 / 24 )1037.982191780827.61906837988865136.234791450447
Winsorized Mean ( 20 / 24 )1040.447945205486.73750100165444154.426388203874
Winsorized Mean ( 21 / 24 )1039.815068493156.53706318586684159.064558338863
Winsorized Mean ( 22 / 24 )1039.212328767126.23932145442023166.558549092048
Winsorized Mean ( 23 / 24 )1040.315068493155.75660089357584180.716900081454
Winsorized Mean ( 24 / 24 )1038.539726027405.48004986274727189.512824160099
Trimmed Mean ( 1 / 24 )1041.4394366197215.877953975566165.5902793409243
Trimmed Mean ( 2 / 24 )1040.9304347826114.847083051060870.1100971283538
Trimmed Mean ( 3 / 24 )1040.3611940298513.889267769842274.9039626328457
Trimmed Mean ( 4 / 24 )1040.3707692307713.250494860693178.515616221774
Trimmed Mean ( 5 / 24 )1040.0444444444412.684187449472081.995354340789
Trimmed Mean ( 6 / 24 )1039.7131147541012.145451930573485.6051401543044
Trimmed Mean ( 7 / 24 )1039.3203389830511.623265072215789.417244855531
Trimmed Mean ( 8 / 24 )1038.6035087719311.079674985086093.7395284762382
Trimmed Mean ( 9 / 24 )1038.6872727272710.753996377056696.5861653945955
Trimmed Mean ( 10 / 24 )1038.7905660377410.3547957183976100.31975466132
Trimmed Mean ( 11 / 24 )1038.996078431379.9262484119411104.671577348546
Trimmed Mean ( 12 / 24 )1038.765306122459.52531962031832109.053065674214
Trimmed Mean ( 13 / 24 )1038.582978723409.05072217394932114.751393177525
Trimmed Mean ( 14 / 24 )1037.873333333338.6311717195596120.247095881704
Trimmed Mean ( 15 / 24 )1037.927906976748.39569995247158123.626131573603
Trimmed Mean ( 16 / 24 )1037.982926829278.18427768647035126.826455136681
Trimmed Mean ( 17 / 24 )1037.876923076928.05459731721514128.855221707814
Trimmed Mean ( 18 / 24 )1037.867567567577.91861574305111131.066792637127
Trimmed Mean ( 19 / 24 )1037.854285714297.7212609921258134.415128147164
Trimmed Mean ( 20 / 24 )1037.839393939397.4506354459957139.295420029868
Trimmed Mean ( 21 / 24 )1037.532258064527.30255425500163142.077993786064
Trimmed Mean ( 22 / 24 )1037.258620689667.12660234724778145.547425006845
Trimmed Mean ( 23 / 24 )1037.018518518526.93889084677021149.450184679186
Trimmed Mean ( 24 / 24 )1036.66.78943787560257152.678324626102
Median1035.8
Midrange1093.75
Midmean - Weighted Average at Xnp1035.65833333333
Midmean - Weighted Average at X(n+1)p1037.86756756757
Midmean - Empirical Distribution Function1037.86756756757
Midmean - Empirical Distribution Function - Averaging1037.86756756757
Midmean - Empirical Distribution Function - Interpolation1037.86756756757
Midmean - Closest Observation1035.78157894737
Midmean - True Basic - Statistics Graphics Toolkit1037.86756756757
Midmean - MS Excel (old versions)1037.86756756757
Number of observations73


Parameters (Session):
Parameters (R input):
R code (references can be found in the software module):
geomean <- function(x) {
return(exp(mean(log(x))))
}
harmean <- function(x) {
return(1/mean(1/x))
}
quamean <- function(x) {
return(sqrt(mean(x*x)))
}
winmean <- function(x) {
x <-sort(x[!is.na(x)])
n<-length(x)
denom <- 3
nodenom <- n/denom
if (nodenom>40) denom <- n/40
sqrtn = sqrt(n)
roundnodenom = floor(nodenom)
win <- array(NA,dim=c(roundnodenom,2))
for (j in 1:roundnodenom) {
win[j,1] <- (j*x[j+1]+sum(x[(j+1):(n-j)])+j*x[n-j])/n
win[j,2] <- sd(c(rep(x[j+1],j),x[(j+1):(n-j)],rep(x[n-j],j)))/sqrtn
}
return(win)
}
trimean <- function(x) {
x <-sort(x[!is.na(x)])
n<-length(x)
denom <- 3
nodenom <- n/denom
if (nodenom>40) denom <- n/40
sqrtn = sqrt(n)
roundnodenom = floor(nodenom)
tri <- array(NA,dim=c(roundnodenom,2))
for (j in 1:roundnodenom) {
tri[j,1] <- mean(x,trim=j/n)
tri[j,2] <- sd(x[(j+1):(n-j)]) / sqrt(n-j*2)
}
return(tri)
}
midrange <- function(x) {
return((max(x)+min(x))/2)
}
q1 <- function(data,n,p,i,f) {
np <- n*p;
i <<- floor(np)
f <<- np - i
qvalue <- (1-f)*data[i] + f*data[i+1]
}
q2 <- function(data,n,p,i,f) {
np <- (n+1)*p
i <<- floor(np)
f <<- np - i
qvalue <- (1-f)*data[i] + f*data[i+1]
}
q3 <- function(data,n,p,i,f) {
np <- n*p
i <<- floor(np)
f <<- np - i
if (f==0) {
qvalue <- data[i]
} else {
qvalue <- data[i+1]
}
}
q4 <- function(data,n,p,i,f) {
np <- n*p
i <<- floor(np)
f <<- np - i
if (f==0) {
qvalue <- (data[i]+data[i+1])/2
} else {
qvalue <- data[i+1]
}
}
q5 <- function(data,n,p,i,f) {
np <- (n-1)*p
i <<- floor(np)
f <<- np - i
if (f==0) {
qvalue <- data[i+1]
} else {
qvalue <- data[i+1] + f*(data[i+2]-data[i+1])
}
}
q6 <- function(data,n,p,i,f) {
np <- n*p+0.5
i <<- floor(np)
f <<- np - i
qvalue <- data[i]
}
q7 <- function(data,n,p,i,f) {
np <- (n+1)*p
i <<- floor(np)
f <<- np - i
if (f==0) {
qvalue <- data[i]
} else {
qvalue <- f*data[i] + (1-f)*data[i+1]
}
}
q8 <- function(data,n,p,i,f) {
np <- (n+1)*p
i <<- floor(np)
f <<- np - i
if (f==0) {
qvalue <- data[i]
} else {
if (f == 0.5) {
qvalue <- (data[i]+data[i+1])/2
} else {
if (f < 0.5) {
qvalue <- data[i]
} else {
qvalue <- data[i+1]
}
}
}
}
midmean <- function(x,def) {
x <-sort(x[!is.na(x)])
n<-length(x)
if (def==1) {
qvalue1 <- q1(x,n,0.25,i,f)
qvalue3 <- q1(x,n,0.75,i,f)
}
if (def==2) {
qvalue1 <- q2(x,n,0.25,i,f)
qvalue3 <- q2(x,n,0.75,i,f)
}
if (def==3) {
qvalue1 <- q3(x,n,0.25,i,f)
qvalue3 <- q3(x,n,0.75,i,f)
}
if (def==4) {
qvalue1 <- q4(x,n,0.25,i,f)
qvalue3 <- q4(x,n,0.75,i,f)
}
if (def==5) {
qvalue1 <- q5(x,n,0.25,i,f)
qvalue3 <- q5(x,n,0.75,i,f)
}
if (def==6) {
qvalue1 <- q6(x,n,0.25,i,f)
qvalue3 <- q6(x,n,0.75,i,f)
}
if (def==7) {
qvalue1 <- q7(x,n,0.25,i,f)
qvalue3 <- q7(x,n,0.75,i,f)
}
if (def==8) {
qvalue1 <- q8(x,n,0.25,i,f)
qvalue3 <- q8(x,n,0.75,i,f)
}
midm <- 0
myn <- 0
roundno4 <- round(n/4)
round3no4 <- round(3*n/4)
for (i in 1:n) {
if ((x[i]>=qvalue1) & (x[i]<=qvalue3)){
midm = midm + x[i]
myn = myn + 1
}
}
midm = midm / myn
return(midm)
}
(arm <- mean(x))
sqrtn <- sqrt(length(x))
(armse <- sd(x) / sqrtn)
(armose <- arm / armse)
(geo <- geomean(x))
(har <- harmean(x))
(qua <- quamean(x))
(win <- winmean(x))
(tri <- trimean(x))
(midr <- midrange(x))
midm <- array(NA,dim=8)
for (j in 1:8) midm[j] <- midmean(x,j)
midm
bitmap(file='test1.png')
lb <- win[,1] - 2*win[,2]
ub <- win[,1] + 2*win[,2]
if ((ylimmin == '') | (ylimmax == '')) plot(win[,1],type='b',main=main, xlab='j', pch=19, ylab='Winsorized Mean(j/n)', ylim=c(min(lb),max(ub))) else plot(win[,1],type='l',main=main, xlab='j', pch=19, ylab='Winsorized Mean(j/n)', ylim=c(ylimmin,ylimmax))
lines(ub,lty=3)
lines(lb,lty=3)
grid()
dev.off()
bitmap(file='test2.png')
lb <- tri[,1] - 2*tri[,2]
ub <- tri[,1] + 2*tri[,2]
if ((ylimmin == '') | (ylimmax == '')) plot(tri[,1],type='b',main=main, xlab='j', pch=19, ylab='Trimmed Mean(j/n)', ylim=c(min(lb),max(ub))) else plot(tri[,1],type='l',main=main, xlab='j', pch=19, ylab='Trimmed Mean(j/n)', ylim=c(ylimmin,ylimmax))
lines(ub,lty=3)
lines(lb,lty=3)
grid()
dev.off()
load(file='createtable')
a<-table.start()
a<-table.row.start(a)
a<-table.element(a,'Central Tendency - Ungrouped Data',4,TRUE)
a<-table.row.end(a)
a<-table.row.start(a)
a<-table.element(a,'Measure',header=TRUE)
a<-table.element(a,'Value',header=TRUE)
a<-table.element(a,'S.E.',header=TRUE)
a<-table.element(a,'Value/S.E.',header=TRUE)
a<-table.row.end(a)
a<-table.row.start(a)
a<-table.element(a,hyperlink('arithmetic_mean.htm', 'Arithmetic Mean', 'click to view the definition of the Arithmetic Mean'),header=TRUE)
a<-table.element(a,arm)
a<-table.element(a,hyperlink('arithmetic_mean_standard_error.htm', armse, 'click to view the definition of the Standard Error of the Arithmetic Mean'))
a<-table.element(a,armose)
a<-table.row.end(a)
a<-table.row.start(a)
a<-table.element(a,hyperlink('geometric_mean.htm', 'Geometric Mean', 'click to view the definition of the Geometric Mean'),header=TRUE)
a<-table.element(a,geo)
a<-table.element(a,'')
a<-table.row.end(a)
a<-table.row.start(a)
a<-table.element(a,hyperlink('harmonic_mean.htm', 'Harmonic Mean', 'click to view the definition of the Harmonic Mean'),header=TRUE)
a<-table.element(a,har)
a<-table.element(a,'')
a<-table.row.end(a)
a<-table.row.start(a)
a<-table.element(a,hyperlink('quadratic_mean.htm', 'Quadratic Mean', 'click to view the definition of the Quadratic Mean'),header=TRUE)
a<-table.element(a,qua)
a<-table.element(a,'')
a<-table.row.end(a)
for (j in 1:length(win[,1])) {
a<-table.row.start(a)
mylabel <- paste('Winsorized Mean (',j)
mylabel <- paste(mylabel,'/')
mylabel <- paste(mylabel,length(win[,1]))
mylabel <- paste(mylabel,')')
a<-table.element(a,hyperlink('winsorized_mean.htm', mylabel, 'click to view the definition of the Winsorized Mean'),header=TRUE)
a<-table.element(a,win[j,1])
a<-table.element(a,win[j,2])
a<-table.element(a,win[j,1]/win[j,2])
a<-table.row.end(a)
}
for (j in 1:length(tri[,1])) {
a<-table.row.start(a)
mylabel <- paste('Trimmed Mean (',j)
mylabel <- paste(mylabel,'/')
mylabel <- paste(mylabel,length(tri[,1]))
mylabel <- paste(mylabel,')')
a<-table.element(a,hyperlink('arithmetic_mean.htm', mylabel, 'click to view the definition of the Trimmed Mean'),header=TRUE)
a<-table.element(a,tri[j,1])
a<-table.element(a,tri[j,2])
a<-table.element(a,tri[j,1]/tri[j,2])
a<-table.row.end(a)
}
a<-table.row.start(a)
a<-table.element(a,hyperlink('median_1.htm', 'Median', 'click to view the definition of the Median'),header=TRUE)
a<-table.element(a,median(x))
a<-table.element(a,'')
a<-table.row.end(a)
a<-table.row.start(a)
a<-table.element(a,hyperlink('midrange.htm', 'Midrange', 'click to view the definition of the Midrange'),header=TRUE)
a<-table.element(a,midr)
a<-table.element(a,'')
a<-table.row.end(a)
a<-table.row.start(a)
mymid <- hyperlink('midmean.htm', 'Midmean', 'click to view the definition of the Midmean')
mylabel <- paste(mymid,hyperlink('method_1.htm','Weighted Average at Xnp',''),sep=' - ')
a<-table.element(a,mylabel,header=TRUE)
a<-table.element(a,midm[1])
a<-table.element(a,'')
a<-table.row.end(a)
a<-table.row.start(a)
mymid <- hyperlink('midmean.htm', 'Midmean', 'click to view the definition of the Midmean')
mylabel <- paste(mymid,hyperlink('method_2.htm','Weighted Average at X(n+1)p',''),sep=' - ')
a<-table.element(a,mylabel,header=TRUE)
a<-table.element(a,midm[2])
a<-table.element(a,'')
a<-table.row.end(a)
a<-table.row.start(a)
mymid <- hyperlink('midmean.htm', 'Midmean', 'click to view the definition of the Midmean')
mylabel <- paste(mymid,hyperlink('method_3.htm','Empirical Distribution Function',''),sep=' - ')
a<-table.element(a,mylabel,header=TRUE)
a<-table.element(a,midm[3])
a<-table.element(a,'')
a<-table.row.end(a)
a<-table.row.start(a)
mymid <- hyperlink('midmean.htm', 'Midmean', 'click to view the definition of the Midmean')
mylabel <- paste(mymid,hyperlink('method_4.htm','Empirical Distribution Function - Averaging',''),sep=' - ')
a<-table.element(a,mylabel,header=TRUE)
a<-table.element(a,midm[4])
a<-table.element(a,'')
a<-table.row.end(a)
a<-table.row.start(a)
mymid <- hyperlink('midmean.htm', 'Midmean', 'click to view the definition of the Midmean')
mylabel <- paste(mymid,hyperlink('method_5.htm','Empirical Distribution Function - Interpolation',''),sep=' - ')
a<-table.element(a,mylabel,header=TRUE)
a<-table.element(a,midm[5])
a<-table.element(a,'')
a<-table.row.end(a)
a<-table.row.start(a)
mymid <- hyperlink('midmean.htm', 'Midmean', 'click to view the definition of the Midmean')
mylabel <- paste(mymid,hyperlink('method_6.htm','Closest Observation',''),sep=' - ')
a<-table.element(a,mylabel,header=TRUE)
a<-table.element(a,midm[6])
a<-table.element(a,'')
a<-table.row.end(a)
a<-table.row.start(a)
mymid <- hyperlink('midmean.htm', 'Midmean', 'click to view the definition of the Midmean')
mylabel <- paste(mymid,hyperlink('method_7.htm','True Basic - Statistics Graphics Toolkit',''),sep=' - ')
a<-table.element(a,mylabel,header=TRUE)
a<-table.element(a,midm[7])
a<-table.element(a,'')
a<-table.row.end(a)
a<-table.row.start(a)
mymid <- hyperlink('midmean.htm', 'Midmean', 'click to view the definition of the Midmean')
mylabel <- paste(mymid,hyperlink('method_8.htm','MS Excel (old versions)',''),sep=' - ')
a<-table.element(a,mylabel,header=TRUE)
a<-table.element(a,midm[8])
a<-table.element(a,'')
a<-table.row.end(a)
a<-table.row.start(a)
a<-table.element(a,'Number of observations',header=TRUE)
a<-table.element(a,length(x))
a<-table.element(a,'')
a<-table.row.end(a)
a<-table.end(a)
table.save(a,file='mytable.tab')