Free Statistics

of Irreproducible Research!

Author's title

Author*The author of this computation has been verified*
R Software Modulerwasp_multipleregression.wasp
Title produced by softwareMultiple Regression
Date of computationTue, 16 Dec 2008 08:40:51 -0700
Cite this page as followsStatistical Computations at FreeStatistics.org, Office for Research Development and Education, URL https://freestatistics.org/blog/index.php?v=date/2008/Dec/16/t1229442259qz7f8v0wlsgs9jn.htm/, Retrieved Wed, 15 May 2024 12:48:59 +0000
Statistical Computations at FreeStatistics.org, Office for Research Development and Education, URL https://freestatistics.org/blog/index.php?pk=33987, Retrieved Wed, 15 May 2024 12:48:59 +0000
QR Codes:

Original text written by user:
IsPrivate?No (this computation is public)
User-defined keywordssamenwerking VDAB en Syntra
Estimated Impact175
Family? (F = Feedback message, R = changed R code, M = changed R Module, P = changed Parameters, D = changed Data)
-       [Multiple Regression] [Regressie paper] [2008-12-16 15:40:51] [3bdbbe597ac6c61989658933956ee6ac] [Current]
-    D    [Multiple Regression] [regression paper] [2008-12-16 16:24:45] [c96f3dce3a823a83b6ede18389e1cfd4]
Feedback Forum

Post a new message
Dataseries X:
25	0
23.6	0
22.3	0
21.8	0
20.8	0
19.7	0
18.3	0
17.4	0
17	0
18.1	0
23.9	0
25.6	0
25.3	0
23.6	0
21.9	0
21.4	0
20.6	0
20.5	0
20.2	0
20.6	0
19.7	0
19.3	0
22.8	0
23.5	0
23.8	0
22.6	0
22	0
21.7	0
20.7	0
20.2	0
19.1	0
19.5	0
18.7	0
18.6	0
22.2	0
23.2	0
23.5	1
21.3	1
20	1
18.7	1
18.9	1
18.3	1
18.4	1
19.9	1
19.2	1
18.5	1
20.9	1
20.5	1
19.4	1
18.1	1
17	1
17	1
17.3	1
16.7	1
15.5	1
15.3	1
13.7	1
14.1	1
17.3	1
18.1	1
18.1	1


Summary of computational transaction
Raw Inputview raw input (R code)
Raw Outputview raw output of R engine
Computing time3 seconds
R Server'Gwilym Jenkins' @ 72.249.127.135

\begin{tabular}{lllllllll}
\hline
Summary of computational transaction \tabularnewline
Raw Input & view raw input (R code)  \tabularnewline
Raw Output & view raw output of R engine  \tabularnewline
Computing time & 3 seconds \tabularnewline
R Server & 'Gwilym Jenkins' @ 72.249.127.135 \tabularnewline
\hline
\end{tabular}
%Source: https://freestatistics.org/blog/index.php?pk=33987&T=0

[TABLE]
[ROW][C]Summary of computational transaction[/C][/ROW]
[ROW][C]Raw Input[/C][C]view raw input (R code) [/C][/ROW]
[ROW][C]Raw Output[/C][C]view raw output of R engine [/C][/ROW]
[ROW][C]Computing time[/C][C]3 seconds[/C][/ROW]
[ROW][C]R Server[/C][C]'Gwilym Jenkins' @ 72.249.127.135[/C][/ROW]
[/TABLE]
Source: https://freestatistics.org/blog/index.php?pk=33987&T=0

Globally Unique Identifier (entire table): ba.freestatistics.org/blog/index.php?pk=33987&T=0

As an alternative you can also use a QR Code:  

The GUIDs for individual cells are displayed in the table below:

Summary of computational transaction
Raw Inputview raw input (R code)
Raw Outputview raw output of R engine
Computing time3 seconds
R Server'Gwilym Jenkins' @ 72.249.127.135


Multiple Linear Regression - Estimated Regression Equation
<25j[t] = + 24.9764743589744 -1.15608974358974samenwerking[t] + 0.128103632478631M1[t] -0.988344017094017M2[t] -2.12350961538462M3[t] -2.57867521367522M4[t] -2.97384081196581M5[t] -3.48900641025642M6[t] -4.20417200854701M7[t] -3.89933760683761M8[t] -4.71450320512821M9[t] -4.58966880341881M10[t] -0.824834401709404M11[t] -0.0648344017094017t + e[t]

\begin{tabular}{lllllllll}
\hline
Multiple Linear Regression - Estimated Regression Equation \tabularnewline
<25j[t] =  +  24.9764743589744 -1.15608974358974samenwerking[t] +  0.128103632478631M1[t] -0.988344017094017M2[t] -2.12350961538462M3[t] -2.57867521367522M4[t] -2.97384081196581M5[t] -3.48900641025642M6[t] -4.20417200854701M7[t] -3.89933760683761M8[t] -4.71450320512821M9[t] -4.58966880341881M10[t] -0.824834401709404M11[t] -0.0648344017094017t  + e[t] \tabularnewline
\hline
\end{tabular}
%Source: https://freestatistics.org/blog/index.php?pk=33987&T=1

[TABLE]
[ROW][C]Multiple Linear Regression - Estimated Regression Equation[/C][/ROW]
[ROW][C]<25j[t] =  +  24.9764743589744 -1.15608974358974samenwerking[t] +  0.128103632478631M1[t] -0.988344017094017M2[t] -2.12350961538462M3[t] -2.57867521367522M4[t] -2.97384081196581M5[t] -3.48900641025642M6[t] -4.20417200854701M7[t] -3.89933760683761M8[t] -4.71450320512821M9[t] -4.58966880341881M10[t] -0.824834401709404M11[t] -0.0648344017094017t  + e[t][/C][/ROW]
[/TABLE]
Source: https://freestatistics.org/blog/index.php?pk=33987&T=1

Globally Unique Identifier (entire table): ba.freestatistics.org/blog/index.php?pk=33987&T=1

As an alternative you can also use a QR Code:  

The GUIDs for individual cells are displayed in the table below:

Multiple Linear Regression - Estimated Regression Equation
<25j[t] = + 24.9764743589744 -1.15608974358974samenwerking[t] + 0.128103632478631M1[t] -0.988344017094017M2[t] -2.12350961538462M3[t] -2.57867521367522M4[t] -2.97384081196581M5[t] -3.48900641025642M6[t] -4.20417200854701M7[t] -3.89933760683761M8[t] -4.71450320512821M9[t] -4.58966880341881M10[t] -0.824834401709404M11[t] -0.0648344017094017t + e[t]


Multiple Linear Regression - Ordinary Least Squares
VariableParameterS.D.T-STATH0: parameter = 02-tail p-value1-tail p-value
(Intercept)24.97647435897440.80874230.883100
samenwerking-1.156089743589740.730442-1.58270.120190.060095
M10.1281036324786310.8643960.14820.8828190.441409
M2-0.9883440170940170.908894-1.08740.2823990.1412
M3-2.123509615384620.904418-2.34790.0231390.011569
M4-2.578675213675220.900394-2.86390.0062350.003117
M5-2.973840811965810.896829-3.3160.0017670.000883
M6-3.489006410256420.893727-3.90390.0003010.000151
M7-4.204172008547010.891094-4.7182.2e-051.1e-05
M8-3.899337606837610.888935-4.38656.5e-053.2e-05
M9-4.714503205128210.887251-5.31363e-061e-06
M10-4.589668803418810.886047-5.17995e-062e-06
M11-0.8248344017094040.885323-0.93170.3562650.178133
t-0.06483440170940170.020668-3.13690.0029450.001472

\begin{tabular}{lllllllll}
\hline
Multiple Linear Regression - Ordinary Least Squares \tabularnewline
Variable & Parameter & S.D. & T-STATH0: parameter = 0 & 2-tail p-value & 1-tail p-value \tabularnewline
(Intercept) & 24.9764743589744 & 0.808742 & 30.8831 & 0 & 0 \tabularnewline
samenwerking & -1.15608974358974 & 0.730442 & -1.5827 & 0.12019 & 0.060095 \tabularnewline
M1 & 0.128103632478631 & 0.864396 & 0.1482 & 0.882819 & 0.441409 \tabularnewline
M2 & -0.988344017094017 & 0.908894 & -1.0874 & 0.282399 & 0.1412 \tabularnewline
M3 & -2.12350961538462 & 0.904418 & -2.3479 & 0.023139 & 0.011569 \tabularnewline
M4 & -2.57867521367522 & 0.900394 & -2.8639 & 0.006235 & 0.003117 \tabularnewline
M5 & -2.97384081196581 & 0.896829 & -3.316 & 0.001767 & 0.000883 \tabularnewline
M6 & -3.48900641025642 & 0.893727 & -3.9039 & 0.000301 & 0.000151 \tabularnewline
M7 & -4.20417200854701 & 0.891094 & -4.718 & 2.2e-05 & 1.1e-05 \tabularnewline
M8 & -3.89933760683761 & 0.888935 & -4.3865 & 6.5e-05 & 3.2e-05 \tabularnewline
M9 & -4.71450320512821 & 0.887251 & -5.3136 & 3e-06 & 1e-06 \tabularnewline
M10 & -4.58966880341881 & 0.886047 & -5.1799 & 5e-06 & 2e-06 \tabularnewline
M11 & -0.824834401709404 & 0.885323 & -0.9317 & 0.356265 & 0.178133 \tabularnewline
t & -0.0648344017094017 & 0.020668 & -3.1369 & 0.002945 & 0.001472 \tabularnewline
\hline
\end{tabular}
%Source: https://freestatistics.org/blog/index.php?pk=33987&T=2

[TABLE]
[ROW][C]Multiple Linear Regression - Ordinary Least Squares[/C][/ROW]
[ROW][C]Variable[/C][C]Parameter[/C][C]S.D.[/C][C]T-STATH0: parameter = 0[/C][C]2-tail p-value[/C][C]1-tail p-value[/C][/ROW]
[ROW][C](Intercept)[/C][C]24.9764743589744[/C][C]0.808742[/C][C]30.8831[/C][C]0[/C][C]0[/C][/ROW]
[ROW][C]samenwerking[/C][C]-1.15608974358974[/C][C]0.730442[/C][C]-1.5827[/C][C]0.12019[/C][C]0.060095[/C][/ROW]
[ROW][C]M1[/C][C]0.128103632478631[/C][C]0.864396[/C][C]0.1482[/C][C]0.882819[/C][C]0.441409[/C][/ROW]
[ROW][C]M2[/C][C]-0.988344017094017[/C][C]0.908894[/C][C]-1.0874[/C][C]0.282399[/C][C]0.1412[/C][/ROW]
[ROW][C]M3[/C][C]-2.12350961538462[/C][C]0.904418[/C][C]-2.3479[/C][C]0.023139[/C][C]0.011569[/C][/ROW]
[ROW][C]M4[/C][C]-2.57867521367522[/C][C]0.900394[/C][C]-2.8639[/C][C]0.006235[/C][C]0.003117[/C][/ROW]
[ROW][C]M5[/C][C]-2.97384081196581[/C][C]0.896829[/C][C]-3.316[/C][C]0.001767[/C][C]0.000883[/C][/ROW]
[ROW][C]M6[/C][C]-3.48900641025642[/C][C]0.893727[/C][C]-3.9039[/C][C]0.000301[/C][C]0.000151[/C][/ROW]
[ROW][C]M7[/C][C]-4.20417200854701[/C][C]0.891094[/C][C]-4.718[/C][C]2.2e-05[/C][C]1.1e-05[/C][/ROW]
[ROW][C]M8[/C][C]-3.89933760683761[/C][C]0.888935[/C][C]-4.3865[/C][C]6.5e-05[/C][C]3.2e-05[/C][/ROW]
[ROW][C]M9[/C][C]-4.71450320512821[/C][C]0.887251[/C][C]-5.3136[/C][C]3e-06[/C][C]1e-06[/C][/ROW]
[ROW][C]M10[/C][C]-4.58966880341881[/C][C]0.886047[/C][C]-5.1799[/C][C]5e-06[/C][C]2e-06[/C][/ROW]
[ROW][C]M11[/C][C]-0.824834401709404[/C][C]0.885323[/C][C]-0.9317[/C][C]0.356265[/C][C]0.178133[/C][/ROW]
[ROW][C]t[/C][C]-0.0648344017094017[/C][C]0.020668[/C][C]-3.1369[/C][C]0.002945[/C][C]0.001472[/C][/ROW]
[/TABLE]
Source: https://freestatistics.org/blog/index.php?pk=33987&T=2

Globally Unique Identifier (entire table): ba.freestatistics.org/blog/index.php?pk=33987&T=2

As an alternative you can also use a QR Code:  

The GUIDs for individual cells are displayed in the table below:

Multiple Linear Regression - Ordinary Least Squares
VariableParameterS.D.T-STATH0: parameter = 02-tail p-value1-tail p-value
(Intercept)24.97647435897440.80874230.883100
samenwerking-1.156089743589740.730442-1.58270.120190.060095
M10.1281036324786310.8643960.14820.8828190.441409
M2-0.9883440170940170.908894-1.08740.2823990.1412
M3-2.123509615384620.904418-2.34790.0231390.011569
M4-2.578675213675220.900394-2.86390.0062350.003117
M5-2.973840811965810.896829-3.3160.0017670.000883
M6-3.489006410256420.893727-3.90390.0003010.000151
M7-4.204172008547010.891094-4.7182.2e-051.1e-05
M8-3.899337606837610.888935-4.38656.5e-053.2e-05
M9-4.714503205128210.887251-5.31363e-061e-06
M10-4.589668803418810.886047-5.17995e-062e-06
M11-0.8248344017094040.885323-0.93170.3562650.178133
t-0.06483440170940170.020668-3.13690.0029450.001472


Multiple Linear Regression - Regression Statistics
Multiple R0.886671674815299
R-squared0.786186658919767
Adjusted R-squared0.72704679862098
F-TEST (value)13.2936847491316
F-TEST (DF numerator)13
F-TEST (DF denominator)47
p-value1.24500409981465e-11
Multiple Linear Regression - Residual Statistics
Residual Standard Deviation1.39943713843066
Sum Squared Residuals92.0459423076923

\begin{tabular}{lllllllll}
\hline
Multiple Linear Regression - Regression Statistics \tabularnewline
Multiple R & 0.886671674815299 \tabularnewline
R-squared & 0.786186658919767 \tabularnewline
Adjusted R-squared & 0.72704679862098 \tabularnewline
F-TEST (value) & 13.2936847491316 \tabularnewline
F-TEST (DF numerator) & 13 \tabularnewline
F-TEST (DF denominator) & 47 \tabularnewline
p-value & 1.24500409981465e-11 \tabularnewline
Multiple Linear Regression - Residual Statistics \tabularnewline
Residual Standard Deviation & 1.39943713843066 \tabularnewline
Sum Squared Residuals & 92.0459423076923 \tabularnewline
\hline
\end{tabular}
%Source: https://freestatistics.org/blog/index.php?pk=33987&T=3

[TABLE]
[ROW][C]Multiple Linear Regression - Regression Statistics[/C][/ROW]
[ROW][C]Multiple R[/C][C]0.886671674815299[/C][/ROW]
[ROW][C]R-squared[/C][C]0.786186658919767[/C][/ROW]
[ROW][C]Adjusted R-squared[/C][C]0.72704679862098[/C][/ROW]
[ROW][C]F-TEST (value)[/C][C]13.2936847491316[/C][/ROW]
[ROW][C]F-TEST (DF numerator)[/C][C]13[/C][/ROW]
[ROW][C]F-TEST (DF denominator)[/C][C]47[/C][/ROW]
[ROW][C]p-value[/C][C]1.24500409981465e-11[/C][/ROW]
[ROW][C]Multiple Linear Regression - Residual Statistics[/C][/ROW]
[ROW][C]Residual Standard Deviation[/C][C]1.39943713843066[/C][/ROW]
[ROW][C]Sum Squared Residuals[/C][C]92.0459423076923[/C][/ROW]
[/TABLE]
Source: https://freestatistics.org/blog/index.php?pk=33987&T=3

Globally Unique Identifier (entire table): ba.freestatistics.org/blog/index.php?pk=33987&T=3

As an alternative you can also use a QR Code:  

The GUIDs for individual cells are displayed in the table below:

Multiple Linear Regression - Regression Statistics
Multiple R0.886671674815299
R-squared0.786186658919767
Adjusted R-squared0.72704679862098
F-TEST (value)13.2936847491316
F-TEST (DF numerator)13
F-TEST (DF denominator)47
p-value1.24500409981465e-11
Multiple Linear Regression - Residual Statistics
Residual Standard Deviation1.39943713843066
Sum Squared Residuals92.0459423076923


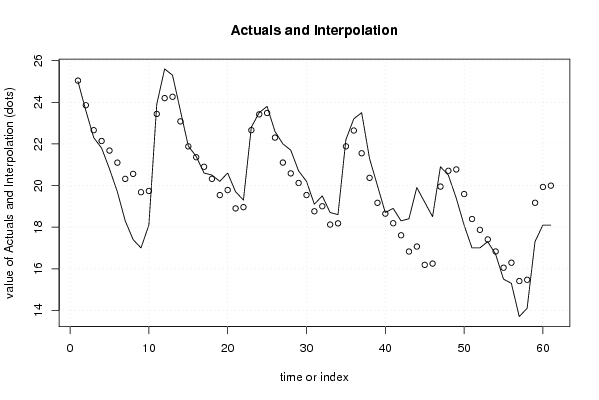
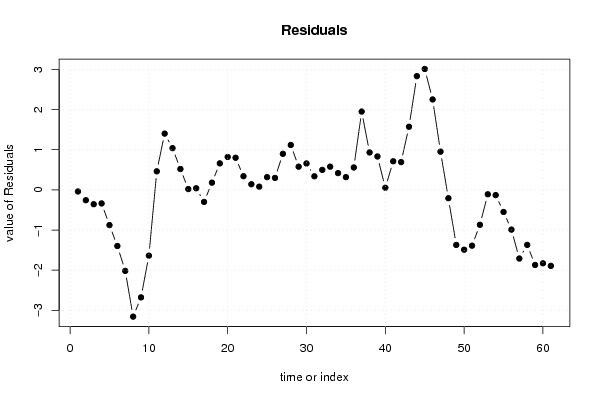
Multiple Linear Regression - Actuals, Interpolation, and Residuals
Time or IndexActualsInterpolationForecastResidualsPrediction Error
12525.0397435897436-0.0397435897435853
223.623.8584615384615-0.258461538461536
322.322.6584615384615-0.358461538461538
421.822.1384615384615-0.338461538461541
520.821.6784615384615-0.878461538461533
619.721.0984615384615-1.39846153846154
718.320.3184615384615-2.01846153846154
817.420.5584615384615-3.15846153846154
91719.6784615384615-2.67846153846154
1018.119.7384615384615-1.63846153846154
1123.923.43846153846150.46153846153846
1225.624.19846153846151.40153846153847
1325.324.26173076923081.03826923076923
1423.623.08044871794870.51955128205128
1521.921.88044871794870.0195512820512812
1621.421.36044871794870.0395512820512814
1720.620.9004487179487-0.300448717948719
1820.520.32044871794870.179551282051283
1920.219.54044871794870.659551282051284
2020.619.78044871794870.819551282051282
2119.718.90044871794870.79955128205128
2219.318.96044871794870.339551282051282
2322.822.66044871794870.139551282051282
2423.523.42044871794870.0795512820512797
2523.823.48371794871790.316282051282051
2622.622.30243589743590.297564102564103
272221.10243589743590.897564102564104
2821.720.58243589743591.11756410256410
2920.720.12243589743590.5775641025641
3020.219.54243589743590.657564102564103
3119.118.76243589743590.337564102564107
3219.519.00243589743590.497564102564102
3318.718.12243589743590.577564102564102
3418.618.18243589743590.417564102564103
3522.221.88243589743590.317564102564102
3623.222.64243589743590.5575641025641
3723.521.54961538461541.95038461538461
3821.320.36833333333330.931666666666665
392019.16833333333330.831666666666667
4018.718.64833333333330.0516666666666665
4118.918.18833333333330.711666666666663
4218.317.60833333333330.69166666666667
4318.416.82833333333331.57166666666667
4419.917.06833333333332.83166666666666
4519.216.18833333333333.01166666666667
4618.516.24833333333332.25166666666667
4720.919.94833333333330.951666666666666
4820.520.7083333333333-0.208333333333335
4919.420.7716025641026-1.37160256410257
5018.119.5903205128205-1.49032051282051
511718.3903205128205-1.39032051282051
521717.8703205128205-0.870320512820512
5317.317.4103205128205-0.110320512820514
5416.716.8303205128205-0.130320512820511
5515.516.0503205128205-0.55032051282051
5615.316.2903205128205-0.990320512820512
5713.715.4103205128205-1.71032051282051
5814.115.4703205128205-1.37032051282051
5917.319.1703205128205-1.87032051282051
6018.119.9303205128205-1.83032051282051
6118.119.9935897435897-1.89358974358974

\begin{tabular}{lllllllll}
\hline
Multiple Linear Regression - Actuals, Interpolation, and Residuals \tabularnewline
Time or Index & Actuals & InterpolationForecast & ResidualsPrediction Error \tabularnewline
1 & 25 & 25.0397435897436 & -0.0397435897435853 \tabularnewline
2 & 23.6 & 23.8584615384615 & -0.258461538461536 \tabularnewline
3 & 22.3 & 22.6584615384615 & -0.358461538461538 \tabularnewline
4 & 21.8 & 22.1384615384615 & -0.338461538461541 \tabularnewline
5 & 20.8 & 21.6784615384615 & -0.878461538461533 \tabularnewline
6 & 19.7 & 21.0984615384615 & -1.39846153846154 \tabularnewline
7 & 18.3 & 20.3184615384615 & -2.01846153846154 \tabularnewline
8 & 17.4 & 20.5584615384615 & -3.15846153846154 \tabularnewline
9 & 17 & 19.6784615384615 & -2.67846153846154 \tabularnewline
10 & 18.1 & 19.7384615384615 & -1.63846153846154 \tabularnewline
11 & 23.9 & 23.4384615384615 & 0.46153846153846 \tabularnewline
12 & 25.6 & 24.1984615384615 & 1.40153846153847 \tabularnewline
13 & 25.3 & 24.2617307692308 & 1.03826923076923 \tabularnewline
14 & 23.6 & 23.0804487179487 & 0.51955128205128 \tabularnewline
15 & 21.9 & 21.8804487179487 & 0.0195512820512812 \tabularnewline
16 & 21.4 & 21.3604487179487 & 0.0395512820512814 \tabularnewline
17 & 20.6 & 20.9004487179487 & -0.300448717948719 \tabularnewline
18 & 20.5 & 20.3204487179487 & 0.179551282051283 \tabularnewline
19 & 20.2 & 19.5404487179487 & 0.659551282051284 \tabularnewline
20 & 20.6 & 19.7804487179487 & 0.819551282051282 \tabularnewline
21 & 19.7 & 18.9004487179487 & 0.79955128205128 \tabularnewline
22 & 19.3 & 18.9604487179487 & 0.339551282051282 \tabularnewline
23 & 22.8 & 22.6604487179487 & 0.139551282051282 \tabularnewline
24 & 23.5 & 23.4204487179487 & 0.0795512820512797 \tabularnewline
25 & 23.8 & 23.4837179487179 & 0.316282051282051 \tabularnewline
26 & 22.6 & 22.3024358974359 & 0.297564102564103 \tabularnewline
27 & 22 & 21.1024358974359 & 0.897564102564104 \tabularnewline
28 & 21.7 & 20.5824358974359 & 1.11756410256410 \tabularnewline
29 & 20.7 & 20.1224358974359 & 0.5775641025641 \tabularnewline
30 & 20.2 & 19.5424358974359 & 0.657564102564103 \tabularnewline
31 & 19.1 & 18.7624358974359 & 0.337564102564107 \tabularnewline
32 & 19.5 & 19.0024358974359 & 0.497564102564102 \tabularnewline
33 & 18.7 & 18.1224358974359 & 0.577564102564102 \tabularnewline
34 & 18.6 & 18.1824358974359 & 0.417564102564103 \tabularnewline
35 & 22.2 & 21.8824358974359 & 0.317564102564102 \tabularnewline
36 & 23.2 & 22.6424358974359 & 0.5575641025641 \tabularnewline
37 & 23.5 & 21.5496153846154 & 1.95038461538461 \tabularnewline
38 & 21.3 & 20.3683333333333 & 0.931666666666665 \tabularnewline
39 & 20 & 19.1683333333333 & 0.831666666666667 \tabularnewline
40 & 18.7 & 18.6483333333333 & 0.0516666666666665 \tabularnewline
41 & 18.9 & 18.1883333333333 & 0.711666666666663 \tabularnewline
42 & 18.3 & 17.6083333333333 & 0.69166666666667 \tabularnewline
43 & 18.4 & 16.8283333333333 & 1.57166666666667 \tabularnewline
44 & 19.9 & 17.0683333333333 & 2.83166666666666 \tabularnewline
45 & 19.2 & 16.1883333333333 & 3.01166666666667 \tabularnewline
46 & 18.5 & 16.2483333333333 & 2.25166666666667 \tabularnewline
47 & 20.9 & 19.9483333333333 & 0.951666666666666 \tabularnewline
48 & 20.5 & 20.7083333333333 & -0.208333333333335 \tabularnewline
49 & 19.4 & 20.7716025641026 & -1.37160256410257 \tabularnewline
50 & 18.1 & 19.5903205128205 & -1.49032051282051 \tabularnewline
51 & 17 & 18.3903205128205 & -1.39032051282051 \tabularnewline
52 & 17 & 17.8703205128205 & -0.870320512820512 \tabularnewline
53 & 17.3 & 17.4103205128205 & -0.110320512820514 \tabularnewline
54 & 16.7 & 16.8303205128205 & -0.130320512820511 \tabularnewline
55 & 15.5 & 16.0503205128205 & -0.55032051282051 \tabularnewline
56 & 15.3 & 16.2903205128205 & -0.990320512820512 \tabularnewline
57 & 13.7 & 15.4103205128205 & -1.71032051282051 \tabularnewline
58 & 14.1 & 15.4703205128205 & -1.37032051282051 \tabularnewline
59 & 17.3 & 19.1703205128205 & -1.87032051282051 \tabularnewline
60 & 18.1 & 19.9303205128205 & -1.83032051282051 \tabularnewline
61 & 18.1 & 19.9935897435897 & -1.89358974358974 \tabularnewline
\hline
\end{tabular}
%Source: https://freestatistics.org/blog/index.php?pk=33987&T=4

[TABLE]
[ROW][C]Multiple Linear Regression - Actuals, Interpolation, and Residuals[/C][/ROW]
[ROW][C]Time or Index[/C][C]Actuals[/C][C]InterpolationForecast[/C][C]ResidualsPrediction Error[/C][/ROW]
[ROW][C]1[/C][C]25[/C][C]25.0397435897436[/C][C]-0.0397435897435853[/C][/ROW]
[ROW][C]2[/C][C]23.6[/C][C]23.8584615384615[/C][C]-0.258461538461536[/C][/ROW]
[ROW][C]3[/C][C]22.3[/C][C]22.6584615384615[/C][C]-0.358461538461538[/C][/ROW]
[ROW][C]4[/C][C]21.8[/C][C]22.1384615384615[/C][C]-0.338461538461541[/C][/ROW]
[ROW][C]5[/C][C]20.8[/C][C]21.6784615384615[/C][C]-0.878461538461533[/C][/ROW]
[ROW][C]6[/C][C]19.7[/C][C]21.0984615384615[/C][C]-1.39846153846154[/C][/ROW]
[ROW][C]7[/C][C]18.3[/C][C]20.3184615384615[/C][C]-2.01846153846154[/C][/ROW]
[ROW][C]8[/C][C]17.4[/C][C]20.5584615384615[/C][C]-3.15846153846154[/C][/ROW]
[ROW][C]9[/C][C]17[/C][C]19.6784615384615[/C][C]-2.67846153846154[/C][/ROW]
[ROW][C]10[/C][C]18.1[/C][C]19.7384615384615[/C][C]-1.63846153846154[/C][/ROW]
[ROW][C]11[/C][C]23.9[/C][C]23.4384615384615[/C][C]0.46153846153846[/C][/ROW]
[ROW][C]12[/C][C]25.6[/C][C]24.1984615384615[/C][C]1.40153846153847[/C][/ROW]
[ROW][C]13[/C][C]25.3[/C][C]24.2617307692308[/C][C]1.03826923076923[/C][/ROW]
[ROW][C]14[/C][C]23.6[/C][C]23.0804487179487[/C][C]0.51955128205128[/C][/ROW]
[ROW][C]15[/C][C]21.9[/C][C]21.8804487179487[/C][C]0.0195512820512812[/C][/ROW]
[ROW][C]16[/C][C]21.4[/C][C]21.3604487179487[/C][C]0.0395512820512814[/C][/ROW]
[ROW][C]17[/C][C]20.6[/C][C]20.9004487179487[/C][C]-0.300448717948719[/C][/ROW]
[ROW][C]18[/C][C]20.5[/C][C]20.3204487179487[/C][C]0.179551282051283[/C][/ROW]
[ROW][C]19[/C][C]20.2[/C][C]19.5404487179487[/C][C]0.659551282051284[/C][/ROW]
[ROW][C]20[/C][C]20.6[/C][C]19.7804487179487[/C][C]0.819551282051282[/C][/ROW]
[ROW][C]21[/C][C]19.7[/C][C]18.9004487179487[/C][C]0.79955128205128[/C][/ROW]
[ROW][C]22[/C][C]19.3[/C][C]18.9604487179487[/C][C]0.339551282051282[/C][/ROW]
[ROW][C]23[/C][C]22.8[/C][C]22.6604487179487[/C][C]0.139551282051282[/C][/ROW]
[ROW][C]24[/C][C]23.5[/C][C]23.4204487179487[/C][C]0.0795512820512797[/C][/ROW]
[ROW][C]25[/C][C]23.8[/C][C]23.4837179487179[/C][C]0.316282051282051[/C][/ROW]
[ROW][C]26[/C][C]22.6[/C][C]22.3024358974359[/C][C]0.297564102564103[/C][/ROW]
[ROW][C]27[/C][C]22[/C][C]21.1024358974359[/C][C]0.897564102564104[/C][/ROW]
[ROW][C]28[/C][C]21.7[/C][C]20.5824358974359[/C][C]1.11756410256410[/C][/ROW]
[ROW][C]29[/C][C]20.7[/C][C]20.1224358974359[/C][C]0.5775641025641[/C][/ROW]
[ROW][C]30[/C][C]20.2[/C][C]19.5424358974359[/C][C]0.657564102564103[/C][/ROW]
[ROW][C]31[/C][C]19.1[/C][C]18.7624358974359[/C][C]0.337564102564107[/C][/ROW]
[ROW][C]32[/C][C]19.5[/C][C]19.0024358974359[/C][C]0.497564102564102[/C][/ROW]
[ROW][C]33[/C][C]18.7[/C][C]18.1224358974359[/C][C]0.577564102564102[/C][/ROW]
[ROW][C]34[/C][C]18.6[/C][C]18.1824358974359[/C][C]0.417564102564103[/C][/ROW]
[ROW][C]35[/C][C]22.2[/C][C]21.8824358974359[/C][C]0.317564102564102[/C][/ROW]
[ROW][C]36[/C][C]23.2[/C][C]22.6424358974359[/C][C]0.5575641025641[/C][/ROW]
[ROW][C]37[/C][C]23.5[/C][C]21.5496153846154[/C][C]1.95038461538461[/C][/ROW]
[ROW][C]38[/C][C]21.3[/C][C]20.3683333333333[/C][C]0.931666666666665[/C][/ROW]
[ROW][C]39[/C][C]20[/C][C]19.1683333333333[/C][C]0.831666666666667[/C][/ROW]
[ROW][C]40[/C][C]18.7[/C][C]18.6483333333333[/C][C]0.0516666666666665[/C][/ROW]
[ROW][C]41[/C][C]18.9[/C][C]18.1883333333333[/C][C]0.711666666666663[/C][/ROW]
[ROW][C]42[/C][C]18.3[/C][C]17.6083333333333[/C][C]0.69166666666667[/C][/ROW]
[ROW][C]43[/C][C]18.4[/C][C]16.8283333333333[/C][C]1.57166666666667[/C][/ROW]
[ROW][C]44[/C][C]19.9[/C][C]17.0683333333333[/C][C]2.83166666666666[/C][/ROW]
[ROW][C]45[/C][C]19.2[/C][C]16.1883333333333[/C][C]3.01166666666667[/C][/ROW]
[ROW][C]46[/C][C]18.5[/C][C]16.2483333333333[/C][C]2.25166666666667[/C][/ROW]
[ROW][C]47[/C][C]20.9[/C][C]19.9483333333333[/C][C]0.951666666666666[/C][/ROW]
[ROW][C]48[/C][C]20.5[/C][C]20.7083333333333[/C][C]-0.208333333333335[/C][/ROW]
[ROW][C]49[/C][C]19.4[/C][C]20.7716025641026[/C][C]-1.37160256410257[/C][/ROW]
[ROW][C]50[/C][C]18.1[/C][C]19.5903205128205[/C][C]-1.49032051282051[/C][/ROW]
[ROW][C]51[/C][C]17[/C][C]18.3903205128205[/C][C]-1.39032051282051[/C][/ROW]
[ROW][C]52[/C][C]17[/C][C]17.8703205128205[/C][C]-0.870320512820512[/C][/ROW]
[ROW][C]53[/C][C]17.3[/C][C]17.4103205128205[/C][C]-0.110320512820514[/C][/ROW]
[ROW][C]54[/C][C]16.7[/C][C]16.8303205128205[/C][C]-0.130320512820511[/C][/ROW]
[ROW][C]55[/C][C]15.5[/C][C]16.0503205128205[/C][C]-0.55032051282051[/C][/ROW]
[ROW][C]56[/C][C]15.3[/C][C]16.2903205128205[/C][C]-0.990320512820512[/C][/ROW]
[ROW][C]57[/C][C]13.7[/C][C]15.4103205128205[/C][C]-1.71032051282051[/C][/ROW]
[ROW][C]58[/C][C]14.1[/C][C]15.4703205128205[/C][C]-1.37032051282051[/C][/ROW]
[ROW][C]59[/C][C]17.3[/C][C]19.1703205128205[/C][C]-1.87032051282051[/C][/ROW]
[ROW][C]60[/C][C]18.1[/C][C]19.9303205128205[/C][C]-1.83032051282051[/C][/ROW]
[ROW][C]61[/C][C]18.1[/C][C]19.9935897435897[/C][C]-1.89358974358974[/C][/ROW]
[/TABLE]
Source: https://freestatistics.org/blog/index.php?pk=33987&T=4

Globally Unique Identifier (entire table): ba.freestatistics.org/blog/index.php?pk=33987&T=4

As an alternative you can also use a QR Code:  

The GUIDs for individual cells are displayed in the table below:

Multiple Linear Regression - Actuals, Interpolation, and Residuals
Time or IndexActualsInterpolationForecastResidualsPrediction Error
12525.0397435897436-0.0397435897435853
223.623.8584615384615-0.258461538461536
322.322.6584615384615-0.358461538461538
421.822.1384615384615-0.338461538461541
520.821.6784615384615-0.878461538461533
619.721.0984615384615-1.39846153846154
718.320.3184615384615-2.01846153846154
817.420.5584615384615-3.15846153846154
91719.6784615384615-2.67846153846154
1018.119.7384615384615-1.63846153846154
1123.923.43846153846150.46153846153846
1225.624.19846153846151.40153846153847
1325.324.26173076923081.03826923076923
1423.623.08044871794870.51955128205128
1521.921.88044871794870.0195512820512812
1621.421.36044871794870.0395512820512814
1720.620.9004487179487-0.300448717948719
1820.520.32044871794870.179551282051283
1920.219.54044871794870.659551282051284
2020.619.78044871794870.819551282051282
2119.718.90044871794870.79955128205128
2219.318.96044871794870.339551282051282
2322.822.66044871794870.139551282051282
2423.523.42044871794870.0795512820512797
2523.823.48371794871790.316282051282051
2622.622.30243589743590.297564102564103
272221.10243589743590.897564102564104
2821.720.58243589743591.11756410256410
2920.720.12243589743590.5775641025641
3020.219.54243589743590.657564102564103
3119.118.76243589743590.337564102564107
3219.519.00243589743590.497564102564102
3318.718.12243589743590.577564102564102
3418.618.18243589743590.417564102564103
3522.221.88243589743590.317564102564102
3623.222.64243589743590.5575641025641
3723.521.54961538461541.95038461538461
3821.320.36833333333330.931666666666665
392019.16833333333330.831666666666667
4018.718.64833333333330.0516666666666665
4118.918.18833333333330.711666666666663
4218.317.60833333333330.69166666666667
4318.416.82833333333331.57166666666667
4419.917.06833333333332.83166666666666
4519.216.18833333333333.01166666666667
4618.516.24833333333332.25166666666667
4720.919.94833333333330.951666666666666
4820.520.7083333333333-0.208333333333335
4919.420.7716025641026-1.37160256410257
5018.119.5903205128205-1.49032051282051
511718.3903205128205-1.39032051282051
521717.8703205128205-0.870320512820512
5317.317.4103205128205-0.110320512820514
5416.716.8303205128205-0.130320512820511
5515.516.0503205128205-0.55032051282051
5615.316.2903205128205-0.990320512820512
5713.715.4103205128205-1.71032051282051
5814.115.4703205128205-1.37032051282051
5917.319.1703205128205-1.87032051282051
6018.119.9303205128205-1.83032051282051
6118.119.9935897435897-1.89358974358974


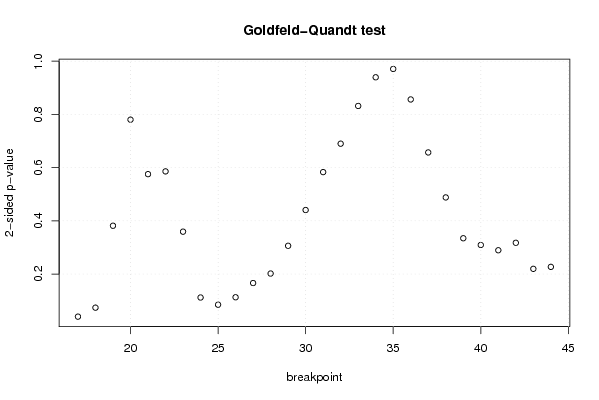
Goldfeld-Quandt test for Heteroskedasticity
p-valuesAlternative Hypothesis
breakpoint indexgreater2-sidedless
170.01996158811626680.03992317623253350.980038411883733
180.03683471289488750.07366942578977510.963165287105112
190.1907683836366860.3815367672733730.809231616363314
200.6099536495197730.7800927009604530.390046350480227
210.7122510513411150.5754978973177710.287748948658885
220.7070824040633950.585835191873210.292917595936605
230.8203519563769970.3592960872460060.179648043623003
240.9440647081825450.1118705836349100.0559352918174549
250.9575877609262060.08482447814758790.0424122390737940
260.9436198769896060.1127602460207880.056380123010394
270.9168827568145510.1662344863708970.0831172431854486
280.8990271575987230.2019456848025540.100972842401277
290.8468922853921480.3062154292157040.153107714607852
300.7797432084734740.4405135830530510.220256791526526
310.7084507720195960.5830984559608080.291549227980404
320.655031645249680.689936709500640.34496835475032
330.5841561730723390.8316876538553220.415843826927661
340.5302731911256530.9394536177486940.469726808874347
350.4853956976877120.9707913953754240.514604302312288
360.4280788763719960.8561577527439920.571921123628004
370.3284915665362020.6569831330724040.671508433463798
380.2439870459142230.4879740918284450.756012954085777
390.1672773719052620.3345547438105250.832722628094738
400.1546413976250880.3092827952501770.845358602374912
410.1447237197978670.2894474395957330.855276280202133
420.1587245299672180.3174490599344350.841275470032782
430.1098175370144580.2196350740289170.890182462985542
440.1135122249658110.2270244499316230.886487775034189

\begin{tabular}{lllllllll}
\hline
Goldfeld-Quandt test for Heteroskedasticity \tabularnewline
p-values & Alternative Hypothesis \tabularnewline
breakpoint index & greater & 2-sided & less \tabularnewline
17 & 0.0199615881162668 & 0.0399231762325335 & 0.980038411883733 \tabularnewline
18 & 0.0368347128948875 & 0.0736694257897751 & 0.963165287105112 \tabularnewline
19 & 0.190768383636686 & 0.381536767273373 & 0.809231616363314 \tabularnewline
20 & 0.609953649519773 & 0.780092700960453 & 0.390046350480227 \tabularnewline
21 & 0.712251051341115 & 0.575497897317771 & 0.287748948658885 \tabularnewline
22 & 0.707082404063395 & 0.58583519187321 & 0.292917595936605 \tabularnewline
23 & 0.820351956376997 & 0.359296087246006 & 0.179648043623003 \tabularnewline
24 & 0.944064708182545 & 0.111870583634910 & 0.0559352918174549 \tabularnewline
25 & 0.957587760926206 & 0.0848244781475879 & 0.0424122390737940 \tabularnewline
26 & 0.943619876989606 & 0.112760246020788 & 0.056380123010394 \tabularnewline
27 & 0.916882756814551 & 0.166234486370897 & 0.0831172431854486 \tabularnewline
28 & 0.899027157598723 & 0.201945684802554 & 0.100972842401277 \tabularnewline
29 & 0.846892285392148 & 0.306215429215704 & 0.153107714607852 \tabularnewline
30 & 0.779743208473474 & 0.440513583053051 & 0.220256791526526 \tabularnewline
31 & 0.708450772019596 & 0.583098455960808 & 0.291549227980404 \tabularnewline
32 & 0.65503164524968 & 0.68993670950064 & 0.34496835475032 \tabularnewline
33 & 0.584156173072339 & 0.831687653855322 & 0.415843826927661 \tabularnewline
34 & 0.530273191125653 & 0.939453617748694 & 0.469726808874347 \tabularnewline
35 & 0.485395697687712 & 0.970791395375424 & 0.514604302312288 \tabularnewline
36 & 0.428078876371996 & 0.856157752743992 & 0.571921123628004 \tabularnewline
37 & 0.328491566536202 & 0.656983133072404 & 0.671508433463798 \tabularnewline
38 & 0.243987045914223 & 0.487974091828445 & 0.756012954085777 \tabularnewline
39 & 0.167277371905262 & 0.334554743810525 & 0.832722628094738 \tabularnewline
40 & 0.154641397625088 & 0.309282795250177 & 0.845358602374912 \tabularnewline
41 & 0.144723719797867 & 0.289447439595733 & 0.855276280202133 \tabularnewline
42 & 0.158724529967218 & 0.317449059934435 & 0.841275470032782 \tabularnewline
43 & 0.109817537014458 & 0.219635074028917 & 0.890182462985542 \tabularnewline
44 & 0.113512224965811 & 0.227024449931623 & 0.886487775034189 \tabularnewline
\hline
\end{tabular}
%Source: https://freestatistics.org/blog/index.php?pk=33987&T=5

[TABLE]
[ROW][C]Goldfeld-Quandt test for Heteroskedasticity[/C][/ROW]
[ROW][C]p-values[/C][C]Alternative Hypothesis[/C][/ROW]
[ROW][C]breakpoint index[/C][C]greater[/C][C]2-sided[/C][C]less[/C][/ROW]
[ROW][C]17[/C][C]0.0199615881162668[/C][C]0.0399231762325335[/C][C]0.980038411883733[/C][/ROW]
[ROW][C]18[/C][C]0.0368347128948875[/C][C]0.0736694257897751[/C][C]0.963165287105112[/C][/ROW]
[ROW][C]19[/C][C]0.190768383636686[/C][C]0.381536767273373[/C][C]0.809231616363314[/C][/ROW]
[ROW][C]20[/C][C]0.609953649519773[/C][C]0.780092700960453[/C][C]0.390046350480227[/C][/ROW]
[ROW][C]21[/C][C]0.712251051341115[/C][C]0.575497897317771[/C][C]0.287748948658885[/C][/ROW]
[ROW][C]22[/C][C]0.707082404063395[/C][C]0.58583519187321[/C][C]0.292917595936605[/C][/ROW]
[ROW][C]23[/C][C]0.820351956376997[/C][C]0.359296087246006[/C][C]0.179648043623003[/C][/ROW]
[ROW][C]24[/C][C]0.944064708182545[/C][C]0.111870583634910[/C][C]0.0559352918174549[/C][/ROW]
[ROW][C]25[/C][C]0.957587760926206[/C][C]0.0848244781475879[/C][C]0.0424122390737940[/C][/ROW]
[ROW][C]26[/C][C]0.943619876989606[/C][C]0.112760246020788[/C][C]0.056380123010394[/C][/ROW]
[ROW][C]27[/C][C]0.916882756814551[/C][C]0.166234486370897[/C][C]0.0831172431854486[/C][/ROW]
[ROW][C]28[/C][C]0.899027157598723[/C][C]0.201945684802554[/C][C]0.100972842401277[/C][/ROW]
[ROW][C]29[/C][C]0.846892285392148[/C][C]0.306215429215704[/C][C]0.153107714607852[/C][/ROW]
[ROW][C]30[/C][C]0.779743208473474[/C][C]0.440513583053051[/C][C]0.220256791526526[/C][/ROW]
[ROW][C]31[/C][C]0.708450772019596[/C][C]0.583098455960808[/C][C]0.291549227980404[/C][/ROW]
[ROW][C]32[/C][C]0.65503164524968[/C][C]0.68993670950064[/C][C]0.34496835475032[/C][/ROW]
[ROW][C]33[/C][C]0.584156173072339[/C][C]0.831687653855322[/C][C]0.415843826927661[/C][/ROW]
[ROW][C]34[/C][C]0.530273191125653[/C][C]0.939453617748694[/C][C]0.469726808874347[/C][/ROW]
[ROW][C]35[/C][C]0.485395697687712[/C][C]0.970791395375424[/C][C]0.514604302312288[/C][/ROW]
[ROW][C]36[/C][C]0.428078876371996[/C][C]0.856157752743992[/C][C]0.571921123628004[/C][/ROW]
[ROW][C]37[/C][C]0.328491566536202[/C][C]0.656983133072404[/C][C]0.671508433463798[/C][/ROW]
[ROW][C]38[/C][C]0.243987045914223[/C][C]0.487974091828445[/C][C]0.756012954085777[/C][/ROW]
[ROW][C]39[/C][C]0.167277371905262[/C][C]0.334554743810525[/C][C]0.832722628094738[/C][/ROW]
[ROW][C]40[/C][C]0.154641397625088[/C][C]0.309282795250177[/C][C]0.845358602374912[/C][/ROW]
[ROW][C]41[/C][C]0.144723719797867[/C][C]0.289447439595733[/C][C]0.855276280202133[/C][/ROW]
[ROW][C]42[/C][C]0.158724529967218[/C][C]0.317449059934435[/C][C]0.841275470032782[/C][/ROW]
[ROW][C]43[/C][C]0.109817537014458[/C][C]0.219635074028917[/C][C]0.890182462985542[/C][/ROW]
[ROW][C]44[/C][C]0.113512224965811[/C][C]0.227024449931623[/C][C]0.886487775034189[/C][/ROW]
[/TABLE]
Source: https://freestatistics.org/blog/index.php?pk=33987&T=5

Globally Unique Identifier (entire table): ba.freestatistics.org/blog/index.php?pk=33987&T=5

As an alternative you can also use a QR Code:  

The GUIDs for individual cells are displayed in the table below:

Goldfeld-Quandt test for Heteroskedasticity
p-valuesAlternative Hypothesis
breakpoint indexgreater2-sidedless
170.01996158811626680.03992317623253350.980038411883733
180.03683471289488750.07366942578977510.963165287105112
190.1907683836366860.3815367672733730.809231616363314
200.6099536495197730.7800927009604530.390046350480227
210.7122510513411150.5754978973177710.287748948658885
220.7070824040633950.585835191873210.292917595936605
230.8203519563769970.3592960872460060.179648043623003
240.9440647081825450.1118705836349100.0559352918174549
250.9575877609262060.08482447814758790.0424122390737940
260.9436198769896060.1127602460207880.056380123010394
270.9168827568145510.1662344863708970.0831172431854486
280.8990271575987230.2019456848025540.100972842401277
290.8468922853921480.3062154292157040.153107714607852
300.7797432084734740.4405135830530510.220256791526526
310.7084507720195960.5830984559608080.291549227980404
320.655031645249680.689936709500640.34496835475032
330.5841561730723390.8316876538553220.415843826927661
340.5302731911256530.9394536177486940.469726808874347
350.4853956976877120.9707913953754240.514604302312288
360.4280788763719960.8561577527439920.571921123628004
370.3284915665362020.6569831330724040.671508433463798
380.2439870459142230.4879740918284450.756012954085777
390.1672773719052620.3345547438105250.832722628094738
400.1546413976250880.3092827952501770.845358602374912
410.1447237197978670.2894474395957330.855276280202133
420.1587245299672180.3174490599344350.841275470032782
430.1098175370144580.2196350740289170.890182462985542
440.1135122249658110.2270244499316230.886487775034189


Meta Analysis of Goldfeld-Quandt test for Heteroskedasticity
Description# significant tests% significant testsOK/NOK
1% type I error level00OK
5% type I error level10.0357142857142857OK
10% type I error level30.107142857142857NOK

\begin{tabular}{lllllllll}
\hline
Meta Analysis of Goldfeld-Quandt test for Heteroskedasticity \tabularnewline
Description & # significant tests & % significant tests & OK/NOK \tabularnewline
1% type I error level & 0 & 0 & OK \tabularnewline
5% type I error level & 1 & 0.0357142857142857 & OK \tabularnewline
10% type I error level & 3 & 0.107142857142857 & NOK \tabularnewline
\hline
\end{tabular}
%Source: https://freestatistics.org/blog/index.php?pk=33987&T=6

[TABLE]
[ROW][C]Meta Analysis of Goldfeld-Quandt test for Heteroskedasticity[/C][/ROW]
[ROW][C]Description[/C][C]# significant tests[/C][C]% significant tests[/C][C]OK/NOK[/C][/ROW]
[ROW][C]1% type I error level[/C][C]0[/C][C]0[/C][C]OK[/C][/ROW]
[ROW][C]5% type I error level[/C][C]1[/C][C]0.0357142857142857[/C][C]OK[/C][/ROW]
[ROW][C]10% type I error level[/C][C]3[/C][C]0.107142857142857[/C][C]NOK[/C][/ROW]
[/TABLE]
Source: https://freestatistics.org/blog/index.php?pk=33987&T=6

Globally Unique Identifier (entire table): ba.freestatistics.org/blog/index.php?pk=33987&T=6

As an alternative you can also use a QR Code:  

The GUIDs for individual cells are displayed in the table below:

Meta Analysis of Goldfeld-Quandt test for Heteroskedasticity
Description# significant tests% significant testsOK/NOK
1% type I error level00OK
5% type I error level10.0357142857142857OK
10% type I error level30.107142857142857NOK


Parameters (Session):
par1 = 1 ; par2 = Include Monthly Dummies ; par3 = Linear Trend ;
Parameters (R input):
par1 = 1 ; par2 = Include Monthly Dummies ; par3 = Linear Trend ;
R code (references can be found in the software module):
library(lattice)
library(lmtest)
n25 <- 25 #minimum number of obs. for Goldfeld-Quandt test
par1 <- as.numeric(par1)
x <- t(y)
k <- length(x[1,])
n <- length(x[,1])
x1 <- cbind(x[,par1], x[,1:k!=par1])
mycolnames <- c(colnames(x)[par1], colnames(x)[1:k!=par1])
colnames(x1) <- mycolnames #colnames(x)[par1]
x <- x1
if (par3 == 'First Differences'){
x2 <- array(0, dim=c(n-1,k), dimnames=list(1:(n-1), paste('(1-B)',colnames(x),sep='')))
for (i in 1:n-1) {
for (j in 1:k) {
x2[i,j] <- x[i+1,j] - x[i,j]
}
}
x <- x2
}
if (par2 == 'Include Monthly Dummies'){
x2 <- array(0, dim=c(n,11), dimnames=list(1:n, paste('M', seq(1:11), sep ='')))
for (i in 1:11){
x2[seq(i,n,12),i] <- 1
}
x <- cbind(x, x2)
}
if (par2 == 'Include Quarterly Dummies'){
x2 <- array(0, dim=c(n,3), dimnames=list(1:n, paste('Q', seq(1:3), sep ='')))
for (i in 1:3){
x2[seq(i,n,4),i] <- 1
}
x <- cbind(x, x2)
}
k <- length(x[1,])
if (par3 == 'Linear Trend'){
x <- cbind(x, c(1:n))
colnames(x)[k+1] <- 't'
}
x
k <- length(x[1,])
df <- as.data.frame(x)
(mylm <- lm(df))
(mysum <- summary(mylm))
if (n > n25) {
kp3 <- k + 3
nmkm3 <- n - k - 3
gqarr <- array(NA, dim=c(nmkm3-kp3+1,3))
numgqtests <- 0
numsignificant1 <- 0
numsignificant5 <- 0
numsignificant10 <- 0
for (mypoint in kp3:nmkm3) {
j <- 0
numgqtests <- numgqtests + 1
for (myalt in c('greater', 'two.sided', 'less')) {
j <- j + 1
gqarr[mypoint-kp3+1,j] <- gqtest(mylm, point=mypoint, alternative=myalt)$p.value
}
if (gqarr[mypoint-kp3+1,2] < 0.01) numsignificant1 <- numsignificant1 + 1
if (gqarr[mypoint-kp3+1,2] < 0.05) numsignificant5 <- numsignificant5 + 1
if (gqarr[mypoint-kp3+1,2] < 0.10) numsignificant10 <- numsignificant10 + 1
}
gqarr
}
bitmap(file='test0.png')
plot(x[,1], type='l', main='Actuals and Interpolation', ylab='value of Actuals and Interpolation (dots)', xlab='time or index')
points(x[,1]-mysum$resid)
grid()
dev.off()
bitmap(file='test1.png')
plot(mysum$resid, type='b', pch=19, main='Residuals', ylab='value of Residuals', xlab='time or index')
grid()
dev.off()
bitmap(file='test2.png')
hist(mysum$resid, main='Residual Histogram', xlab='values of Residuals')
grid()
dev.off()
bitmap(file='test3.png')
densityplot(~mysum$resid,col='black',main='Residual Density Plot', xlab='values of Residuals')
dev.off()
bitmap(file='test4.png')
qqnorm(mysum$resid, main='Residual Normal Q-Q Plot')
qqline(mysum$resid)
grid()
dev.off()
(myerror <- as.ts(mysum$resid))
bitmap(file='test5.png')
dum <- cbind(lag(myerror,k=1),myerror)
dum
dum1 <- dum[2:length(myerror),]
dum1
z <- as.data.frame(dum1)
z
plot(z,main=paste('Residual Lag plot, lowess, and regression line'), ylab='values of Residuals', xlab='lagged values of Residuals')
lines(lowess(z))
abline(lm(z))
grid()
dev.off()
bitmap(file='test6.png')
acf(mysum$resid, lag.max=length(mysum$resid)/2, main='Residual Autocorrelation Function')
grid()
dev.off()
bitmap(file='test7.png')
pacf(mysum$resid, lag.max=length(mysum$resid)/2, main='Residual Partial Autocorrelation Function')
grid()
dev.off()
bitmap(file='test8.png')
opar <- par(mfrow = c(2,2), oma = c(0, 0, 1.1, 0))
plot(mylm, las = 1, sub='Residual Diagnostics')
par(opar)
dev.off()
if (n > n25) {
bitmap(file='test9.png')
plot(kp3:nmkm3,gqarr[,2], main='Goldfeld-Quandt test',ylab='2-sided p-value',xlab='breakpoint')
grid()
dev.off()
}
load(file='createtable')
a<-table.start()
a<-table.row.start(a)
a<-table.element(a, 'Multiple Linear Regression - Estimated Regression Equation', 1, TRUE)
a<-table.row.end(a)
myeq <- colnames(x)[1]
myeq <- paste(myeq, '[t] = ', sep='')
for (i in 1:k){
if (mysum$coefficients[i,1] > 0) myeq <- paste(myeq, '+', '')
myeq <- paste(myeq, mysum$coefficients[i,1], sep=' ')
if (rownames(mysum$coefficients)[i] != '(Intercept)') {
myeq <- paste(myeq, rownames(mysum$coefficients)[i], sep='')
if (rownames(mysum$coefficients)[i] != 't') myeq <- paste(myeq, '[t]', sep='')
}
}
myeq <- paste(myeq, ' + e[t]')
a<-table.row.start(a)
a<-table.element(a, myeq)
a<-table.row.end(a)
a<-table.end(a)
table.save(a,file='mytable1.tab')
a<-table.start()
a<-table.row.start(a)
a<-table.element(a,hyperlink('ols1.htm','Multiple Linear Regression - Ordinary Least Squares',''), 6, TRUE)
a<-table.row.end(a)
a<-table.row.start(a)
a<-table.element(a,'Variable',header=TRUE)
a<-table.element(a,'Parameter',header=TRUE)
a<-table.element(a,'S.D.',header=TRUE)
a<-table.element(a,'T-STAT
H0: parameter = 0',header=TRUE)
a<-table.element(a,'2-tail p-value',header=TRUE)
a<-table.element(a,'1-tail p-value',header=TRUE)
a<-table.row.end(a)
for (i in 1:k){
a<-table.row.start(a)
a<-table.element(a,rownames(mysum$coefficients)[i],header=TRUE)
a<-table.element(a,mysum$coefficients[i,1])
a<-table.element(a, round(mysum$coefficients[i,2],6))
a<-table.element(a, round(mysum$coefficients[i,3],4))
a<-table.element(a, round(mysum$coefficients[i,4],6))
a<-table.element(a, round(mysum$coefficients[i,4]/2,6))
a<-table.row.end(a)
}
a<-table.end(a)
table.save(a,file='mytable2.tab')
a<-table.start()
a<-table.row.start(a)
a<-table.element(a, 'Multiple Linear Regression - Regression Statistics', 2, TRUE)
a<-table.row.end(a)
a<-table.row.start(a)
a<-table.element(a, 'Multiple R',1,TRUE)
a<-table.element(a, sqrt(mysum$r.squared))
a<-table.row.end(a)
a<-table.row.start(a)
a<-table.element(a, 'R-squared',1,TRUE)
a<-table.element(a, mysum$r.squared)
a<-table.row.end(a)
a<-table.row.start(a)
a<-table.element(a, 'Adjusted R-squared',1,TRUE)
a<-table.element(a, mysum$adj.r.squared)
a<-table.row.end(a)
a<-table.row.start(a)
a<-table.element(a, 'F-TEST (value)',1,TRUE)
a<-table.element(a, mysum$fstatistic[1])
a<-table.row.end(a)
a<-table.row.start(a)
a<-table.element(a, 'F-TEST (DF numerator)',1,TRUE)
a<-table.element(a, mysum$fstatistic[2])
a<-table.row.end(a)
a<-table.row.start(a)
a<-table.element(a, 'F-TEST (DF denominator)',1,TRUE)
a<-table.element(a, mysum$fstatistic[3])
a<-table.row.end(a)
a<-table.row.start(a)
a<-table.element(a, 'p-value',1,TRUE)
a<-table.element(a, 1-pf(mysum$fstatistic[1],mysum$fstatistic[2],mysum$fstatistic[3]))
a<-table.row.end(a)
a<-table.row.start(a)
a<-table.element(a, 'Multiple Linear Regression - Residual Statistics', 2, TRUE)
a<-table.row.end(a)
a<-table.row.start(a)
a<-table.element(a, 'Residual Standard Deviation',1,TRUE)
a<-table.element(a, mysum$sigma)
a<-table.row.end(a)
a<-table.row.start(a)
a<-table.element(a, 'Sum Squared Residuals',1,TRUE)
a<-table.element(a, sum(myerror*myerror))
a<-table.row.end(a)
a<-table.end(a)
table.save(a,file='mytable3.tab')
a<-table.start()
a<-table.row.start(a)
a<-table.element(a, 'Multiple Linear Regression - Actuals, Interpolation, and Residuals', 4, TRUE)
a<-table.row.end(a)
a<-table.row.start(a)
a<-table.element(a, 'Time or Index', 1, TRUE)
a<-table.element(a, 'Actuals', 1, TRUE)
a<-table.element(a, 'Interpolation
Forecast', 1, TRUE)
a<-table.element(a, 'Residuals
Prediction Error', 1, TRUE)
a<-table.row.end(a)
for (i in 1:n) {
a<-table.row.start(a)
a<-table.element(a,i, 1, TRUE)
a<-table.element(a,x[i])
a<-table.element(a,x[i]-mysum$resid[i])
a<-table.element(a,mysum$resid[i])
a<-table.row.end(a)
}
a<-table.end(a)
table.save(a,file='mytable4.tab')
if (n > n25) {
a<-table.start()
a<-table.row.start(a)
a<-table.element(a,'Goldfeld-Quandt test for Heteroskedasticity',4,TRUE)
a<-table.row.end(a)
a<-table.row.start(a)
a<-table.element(a,'p-values',header=TRUE)
a<-table.element(a,'Alternative Hypothesis',3,header=TRUE)
a<-table.row.end(a)
a<-table.row.start(a)
a<-table.element(a,'breakpoint index',header=TRUE)
a<-table.element(a,'greater',header=TRUE)
a<-table.element(a,'2-sided',header=TRUE)
a<-table.element(a,'less',header=TRUE)
a<-table.row.end(a)
for (mypoint in kp3:nmkm3) {
a<-table.row.start(a)
a<-table.element(a,mypoint,header=TRUE)
a<-table.element(a,gqarr[mypoint-kp3+1,1])
a<-table.element(a,gqarr[mypoint-kp3+1,2])
a<-table.element(a,gqarr[mypoint-kp3+1,3])
a<-table.row.end(a)
}
a<-table.end(a)
table.save(a,file='mytable5.tab')
a<-table.start()
a<-table.row.start(a)
a<-table.element(a,'Meta Analysis of Goldfeld-Quandt test for Heteroskedasticity',4,TRUE)
a<-table.row.end(a)
a<-table.row.start(a)
a<-table.element(a,'Description',header=TRUE)
a<-table.element(a,'# significant tests',header=TRUE)
a<-table.element(a,'% significant tests',header=TRUE)
a<-table.element(a,'OK/NOK',header=TRUE)
a<-table.row.end(a)
a<-table.row.start(a)
a<-table.element(a,'1% type I error level',header=TRUE)
a<-table.element(a,numsignificant1)
a<-table.element(a,numsignificant1/numgqtests)
if (numsignificant1/numgqtests < 0.01) dum <- 'OK' else dum <- 'NOK'
a<-table.element(a,dum)
a<-table.row.end(a)
a<-table.row.start(a)
a<-table.element(a,'5% type I error level',header=TRUE)
a<-table.element(a,numsignificant5)
a<-table.element(a,numsignificant5/numgqtests)
if (numsignificant5/numgqtests < 0.05) dum <- 'OK' else dum <- 'NOK'
a<-table.element(a,dum)
a<-table.row.end(a)
a<-table.row.start(a)
a<-table.element(a,'10% type I error level',header=TRUE)
a<-table.element(a,numsignificant10)
a<-table.element(a,numsignificant10/numgqtests)
if (numsignificant10/numgqtests < 0.1) dum <- 'OK' else dum <- 'NOK'
a<-table.element(a,dum)
a<-table.row.end(a)
a<-table.end(a)
table.save(a,file='mytable6.tab')
}