Free Statistics

of Irreproducible Research!

Author's title

Author*The author of this computation has been verified*
R Software Modulerwasp_arimaforecasting.wasp
Title produced by softwareARIMA Forecasting
Date of computationTue, 16 Dec 2008 08:38:35 -0700
Cite this page as followsStatistical Computations at FreeStatistics.org, Office for Research Development and Education, URL https://freestatistics.org/blog/index.php?v=date/2008/Dec/16/t12294419943pqp6zm0ullvmmn.htm/, Retrieved Wed, 15 May 2024 22:32:14 +0000
Statistical Computations at FreeStatistics.org, Office for Research Development and Education, URL https://freestatistics.org/blog/index.php?pk=33984, Retrieved Wed, 15 May 2024 22:32:14 +0000
QR Codes:

Original text written by user:
IsPrivate?No (this computation is public)
User-defined keywords
Estimated Impact151
Family? (F = Feedback message, R = changed R code, M = changed R Module, P = changed Parameters, D = changed Data)
F       [ARIMA Forecasting] [] [2008-12-16 15:38:35] [962e6c9020896982bc8283b8971710a9] [Current]
Feedback Forum
2008-12-23 20:52:12 [Toon Wouters] [reply
Step 1 : het was inderdaad de bedoeling om een uitspraak te doen over de explosiviteit van de voorspelling. Aangezien deze binnen het betrouwbaarheidsinterval ligt (te zien op de grafiek), wil zeggen da er geen explosiviteit aanwezig is en dan kunnen we concluderen dat de AR-processen stabiel zijn en dat de MA-processen omkeerbaar ziijn.

Step 2 : juiste conclusie, we zien inderdaad nog pieken die wijzen op seizoenaliteit

Step 3 : De percentages die jij geeft zijn iets wat te overdreven. Voor maand 50 is dat 2%. Het is ook van belang dat de standaard fouten lager liggen dan 5 %, hier is het voor de helft van de voorspelling geldig. Hier kon men ook nog concluderen dat meestal de procentuele werkelijke fout kleiner is dan de procentuele standaardfout.

Step 4 : Over de onderliggende assumpties kon men zeggen of de residu's al dan wel of niet normaal verdeeld zijn.

Step 5 : Juiste conclusie, niets extra aan toe te voegen
2008-12-24 11:20:39 [Aurélie Van Impe] [reply
Step 1:
Je had nog wat meer uitleg kunnen geven bij de verschillende kolommen. Bijvoorbeeld dat de tijdreeks ingekort is met 12 maanden, waarna voor die 12 weggelaten maanden een voorspelling gemaakt is op basis van de maanden daarvoor. Op die manier kan je de voorspelde waarden vergelijken met de werkelijke waarden. Daarom zie je ook enkel voor de laatste 12 maanden dat de tabel volledig ingevuld is.
De p-waarde is inderdaad de kans dat je je vergist bij het verwerpen van de nulhypothese. Deze nulhypothese is de volgende: De waarde die weggelaten is (Yt), is niet significant verschillend van de voorspelde waarde (Ft). Als de p-waarde dus kleiner is dan 0.05, dan is het verschil wel significant. In jouw tabel is de p-waarde nergens groter dan 0.05, dus de verschillen tussen de voorspelde en de werkelijke waarden is niet significant verschillend. Hieruit kan je besluiten dat er een vrij goede voorspelling gemaakt is.
De kolom daarnaast geeft inderdaad de waarschijnlijkheid dat je gestegen bent ten opzichte van de maand daarvoor. Het zijn percentages. In de maanden 57, 58 en 59 is er een opvallend hoog percentage, hier zijn de gegevens dus opvallend gestegen tegenover de vorige maand. Alle andere percentages liggen vrij laag.
De achtste kolom geeft inderdaad de kans weer dat je gestegen bent tov dezelfde maand maar het jaar daarvoor. Deze percentages zijn allemaal opvallend klein. Vaak zelfs kleiner dan 0.05. Dit wil zeggen dat de metingen voor dat laatste jaar ongeveer even hoog liggen als de metingen van het jaar daarvoor. We kunnen hier spreken van een wederkerende golf, of een conjunctuurcyclus. Dit is logisch aangezien we het over werkloosheid hebben.
De laatste kolom geeft de waarschijnlijkheid weer dat je gestegen bent ten opzichte van de laatst gekende waarde, hier dus de waarde op t= 49. Indien deze percentages in een stijgende lijn zouden zijn, zou je kunnen zeggen dat er een stijgende lange termijntrend is, maar dit is niet het geval. Er is zelfs geen dalende trend. Wel valt op dat de laatste voorspellingen een redelijk groot percentage van stijging ten opzichte van de laatst gekende waarde hebben. Maar er is geen trend merkbaar. Dit zou wel kunnen liggen aan het feit dat hoe verder in de toekomst je voorspelt, hoe moeilijker het is om nog een juiste voorspelling te maken.
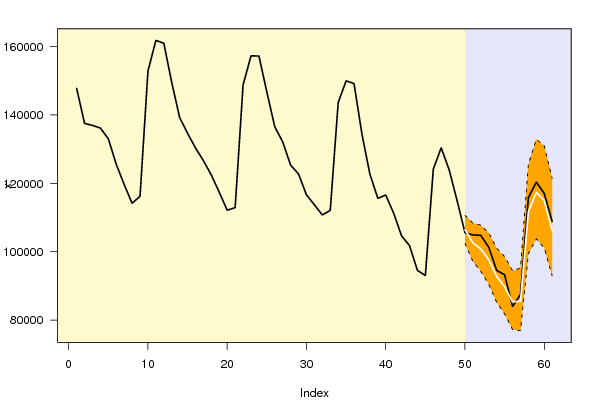
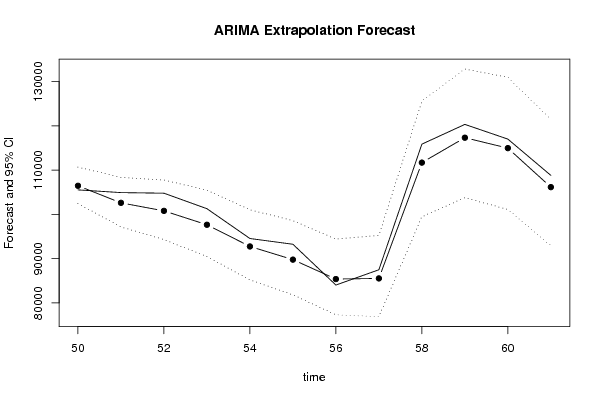
Deze getallen zijn inderdaad niet explosief. Ze bleven telkens binnen het 95 betrouwbaarheidsinterval. Dit is dus een goed voorspellingsmodel voor deze tijdreeks.

Bij de tweede tabel zit je er telkens naast met je percentages. In periode 50 zit je voorspelling niet 20% maar slechts 2% naast de werkelijke waarde. Ook in periode 61 zit je er niet 73% maar slechts 7,3% naast. Dit is dus zeer weinig, zeker als je ziet dat de werkelijke fout die je gemaakt hebt daar nog eens onder ligt. Dit is dus een zeer goed model! De foutpercentages worden inderdaad groter naar het einde toe, omwille van de reden die je zelf hebt aangehaald.

Step 2:
Bij de eerste grafiek had je nog kunnen zeggen dat het blauwgrijze gedeelde voor het gedeelte staat dat je voorspeld hebt. De oranje zone is het betrouwbaarheidsinterval, afgebakend door stippellijnen. De zwarte lijn stelt de werkelijke waarden voor, terwijl de witte lijn staat voor wat je voorspeld hebt. Deze twee lijnen zouden zo dicht mogelijk bij elkaar moeten liggen voor een goede voorspelling. Er is inderdaad zowel een seizoenale als een niet seizoenale trend merkbaar, maar ik denk niet dat dat hier van belang is. Het gaat erom of je voorspelling goed is. Aangezien je op de eerste grafiek niet echt iets duidelijk kan zien, kijken we naar de tweede grafiek. Deze is een uitvergroting van de blauwgrijze zone in de eerste grafiek. Alleen is hier de voorspelling weergegeven door een lijn met bollen, in plaats van een witte lijn. Je ziet dat beide lijnen vrij dicht bij elkaar liggen, wat wil zeggen dat de conjunctuurtrend die aanwezig was, niet onderbroken is, maar gewoon verder gezet. Het is een goede voorspelling, de voorspelde waarden komen nooit buiten het 95%betrouwbaarheidsinterval, zelfs niet naar het einde toe.

Step 3:
Je zit er opnieuw een veelvoud van 10 naast met je percentages. Je gaat van een fout van 2% naar een fout van 7.3%. De fout wordt inderdaad groter naar het einde toe, maar ze blijft zeer klein! Je hebt een goed voorspellingsmodel gevonden!

Step 4:
Hier moest je doen wat je al in step 1 gedaan hebt, al die waarschijnlijkheden uitleggen, de stijging ten opzichte van de vorige maand, vorig jaar, en de laatst gekende waarde. Voor de uitleg: zie dus bij step 1.

Step 5:
Je conclusie is correct, niets aan toe te voegen.

Post a new message
Dataseries X:
147768
137507
136919
136151
133001
125554
119647
114158
116193
152803
161761
160942
149470
139208
134588
130322
126611
122401
117352
112135
112879
148729
157230
157221
146681
136524
132111
125326
122716
116615
113719
110737
112093
143565
149946
149147
134339
122683
115614
116566
111272
104609
101802
94542
93051
124129
130374
123946
114971
105531
104919
104782
101281
94545
93248
84031
87486
115867
120327
117008
108811


Summary of computational transaction
Raw Inputview raw input (R code)
Raw Outputview raw output of R engine
Computing time3 seconds
R Server'Sir Ronald Aylmer Fisher' @ 193.190.124.24

\begin{tabular}{lllllllll}
\hline
Summary of computational transaction \tabularnewline
Raw Input & view raw input (R code)  \tabularnewline
Raw Output & view raw output of R engine  \tabularnewline
Computing time & 3 seconds \tabularnewline
R Server & 'Sir Ronald Aylmer Fisher' @ 193.190.124.24 \tabularnewline
\hline
\end{tabular}
%Source: https://freestatistics.org/blog/index.php?pk=33984&T=0

[TABLE]
[ROW][C]Summary of computational transaction[/C][/ROW]
[ROW][C]Raw Input[/C][C]view raw input (R code) [/C][/ROW]
[ROW][C]Raw Output[/C][C]view raw output of R engine [/C][/ROW]
[ROW][C]Computing time[/C][C]3 seconds[/C][/ROW]
[ROW][C]R Server[/C][C]'Sir Ronald Aylmer Fisher' @ 193.190.124.24[/C][/ROW]
[/TABLE]
Source: https://freestatistics.org/blog/index.php?pk=33984&T=0

Globally Unique Identifier (entire table): ba.freestatistics.org/blog/index.php?pk=33984&T=0

As an alternative you can also use a QR Code:  

The GUIDs for individual cells are displayed in the table below:

Summary of computational transaction
Raw Inputview raw input (R code)
Raw Outputview raw output of R engine
Computing time3 seconds
R Server'Sir Ronald Aylmer Fisher' @ 193.190.124.24


Univariate ARIMA Extrapolation Forecast
timeY[t]F[t]95% LB95% UBp-value(H0: Y[t] = F[t])P(F[t]>Y[t-1])P(F[t]>Y[t-s])P(F[t]>Y[49])
37134339.000000000-------
38122683.000000000-------
39115614.000000000-------
40116566-------
41111272-------
42104609-------
43101802-------
4494542.0000000001-------
4593051.0000000001-------
46124129.000000000-------
47130374-------
48123946-------
49114971-------
50105531106461.8945102429.3144110669.7990.3323000
51104919102605.541397176.3354108370.27430.21580.1600
52104782100789.570194312.229107759.62610.13080.122800
5310128197653.856790469.2113105471.12420.18160.0373e-040
549454592752.227485197.0891101050.89010.3360.0220.00260
559324889774.647381823.788198583.63170.21980.14430.00370
568403185384.596777287.810394424.23690.38460.04410.02350
578748685531.290476891.259995251.29150.34670.61890.06470
58115867111690.408799462.5712125592.24160.2780.99970.03970.3219
59120327117324.2856103768.187132853.95140.35240.5730.04980.6168
60117008114964.0089101103.2253130943.81540.4010.25530.13530.4997
61108811106153.682992925.1568121483.28360.3670.08260.12980.1298

\begin{tabular}{lllllllll}
\hline
Univariate ARIMA Extrapolation Forecast \tabularnewline
time & Y[t] & F[t] & 95% LB & 95% UB & p-value(H0: Y[t] = F[t]) & P(F[t]>Y[t-1]) & P(F[t]>Y[t-s]) & P(F[t]>Y[49]) \tabularnewline
37 & 134339.000000000 & - & - & - & - & - & - & - \tabularnewline
38 & 122683.000000000 & - & - & - & - & - & - & - \tabularnewline
39 & 115614.000000000 & - & - & - & - & - & - & - \tabularnewline
40 & 116566 & - & - & - & - & - & - & - \tabularnewline
41 & 111272 & - & - & - & - & - & - & - \tabularnewline
42 & 104609 & - & - & - & - & - & - & - \tabularnewline
43 & 101802 & - & - & - & - & - & - & - \tabularnewline
44 & 94542.0000000001 & - & - & - & - & - & - & - \tabularnewline
45 & 93051.0000000001 & - & - & - & - & - & - & - \tabularnewline
46 & 124129.000000000 & - & - & - & - & - & - & - \tabularnewline
47 & 130374 & - & - & - & - & - & - & - \tabularnewline
48 & 123946 & - & - & - & - & - & - & - \tabularnewline
49 & 114971 & - & - & - & - & - & - & - \tabularnewline
50 & 105531 & 106461.8945 & 102429.3144 & 110669.799 & 0.3323 & 0 & 0 & 0 \tabularnewline
51 & 104919 & 102605.5413 & 97176.3354 & 108370.2743 & 0.2158 & 0.16 & 0 & 0 \tabularnewline
52 & 104782 & 100789.5701 & 94312.229 & 107759.6261 & 0.1308 & 0.1228 & 0 & 0 \tabularnewline
53 & 101281 & 97653.8567 & 90469.2113 & 105471.1242 & 0.1816 & 0.037 & 3e-04 & 0 \tabularnewline
54 & 94545 & 92752.2274 & 85197.0891 & 101050.8901 & 0.336 & 0.022 & 0.0026 & 0 \tabularnewline
55 & 93248 & 89774.6473 & 81823.7881 & 98583.6317 & 0.2198 & 0.1443 & 0.0037 & 0 \tabularnewline
56 & 84031 & 85384.5967 & 77287.8103 & 94424.2369 & 0.3846 & 0.0441 & 0.0235 & 0 \tabularnewline
57 & 87486 & 85531.2904 & 76891.2599 & 95251.2915 & 0.3467 & 0.6189 & 0.0647 & 0 \tabularnewline
58 & 115867 & 111690.4087 & 99462.5712 & 125592.2416 & 0.278 & 0.9997 & 0.0397 & 0.3219 \tabularnewline
59 & 120327 & 117324.2856 & 103768.187 & 132853.9514 & 0.3524 & 0.573 & 0.0498 & 0.6168 \tabularnewline
60 & 117008 & 114964.0089 & 101103.2253 & 130943.8154 & 0.401 & 0.2553 & 0.1353 & 0.4997 \tabularnewline
61 & 108811 & 106153.6829 & 92925.1568 & 121483.2836 & 0.367 & 0.0826 & 0.1298 & 0.1298 \tabularnewline
\hline
\end{tabular}
%Source: https://freestatistics.org/blog/index.php?pk=33984&T=1

[TABLE]
[ROW][C]Univariate ARIMA Extrapolation Forecast[/C][/ROW]
[ROW][C]time[/C][C]Y[t][/C][C]F[t][/C][C]95% LB[/C][C]95% UB[/C][C]p-value(H0: Y[t] = F[t])[/C][C]P(F[t]>Y[t-1])[/C][C]P(F[t]>Y[t-s])[/C][C]P(F[t]>Y[49])[/C][/ROW]
[ROW][C]37[/C][C]134339.000000000[/C][C]-[/C][C]-[/C][C]-[/C][C]-[/C][C]-[/C][C]-[/C][C]-[/C][/ROW]
[ROW][C]38[/C][C]122683.000000000[/C][C]-[/C][C]-[/C][C]-[/C][C]-[/C][C]-[/C][C]-[/C][C]-[/C][/ROW]
[ROW][C]39[/C][C]115614.000000000[/C][C]-[/C][C]-[/C][C]-[/C][C]-[/C][C]-[/C][C]-[/C][C]-[/C][/ROW]
[ROW][C]40[/C][C]116566[/C][C]-[/C][C]-[/C][C]-[/C][C]-[/C][C]-[/C][C]-[/C][C]-[/C][/ROW]
[ROW][C]41[/C][C]111272[/C][C]-[/C][C]-[/C][C]-[/C][C]-[/C][C]-[/C][C]-[/C][C]-[/C][/ROW]
[ROW][C]42[/C][C]104609[/C][C]-[/C][C]-[/C][C]-[/C][C]-[/C][C]-[/C][C]-[/C][C]-[/C][/ROW]
[ROW][C]43[/C][C]101802[/C][C]-[/C][C]-[/C][C]-[/C][C]-[/C][C]-[/C][C]-[/C][C]-[/C][/ROW]
[ROW][C]44[/C][C]94542.0000000001[/C][C]-[/C][C]-[/C][C]-[/C][C]-[/C][C]-[/C][C]-[/C][C]-[/C][/ROW]
[ROW][C]45[/C][C]93051.0000000001[/C][C]-[/C][C]-[/C][C]-[/C][C]-[/C][C]-[/C][C]-[/C][C]-[/C][/ROW]
[ROW][C]46[/C][C]124129.000000000[/C][C]-[/C][C]-[/C][C]-[/C][C]-[/C][C]-[/C][C]-[/C][C]-[/C][/ROW]
[ROW][C]47[/C][C]130374[/C][C]-[/C][C]-[/C][C]-[/C][C]-[/C][C]-[/C][C]-[/C][C]-[/C][/ROW]
[ROW][C]48[/C][C]123946[/C][C]-[/C][C]-[/C][C]-[/C][C]-[/C][C]-[/C][C]-[/C][C]-[/C][/ROW]
[ROW][C]49[/C][C]114971[/C][C]-[/C][C]-[/C][C]-[/C][C]-[/C][C]-[/C][C]-[/C][C]-[/C][/ROW]
[ROW][C]50[/C][C]105531[/C][C]106461.8945[/C][C]102429.3144[/C][C]110669.799[/C][C]0.3323[/C][C]0[/C][C]0[/C][C]0[/C][/ROW]
[ROW][C]51[/C][C]104919[/C][C]102605.5413[/C][C]97176.3354[/C][C]108370.2743[/C][C]0.2158[/C][C]0.16[/C][C]0[/C][C]0[/C][/ROW]
[ROW][C]52[/C][C]104782[/C][C]100789.5701[/C][C]94312.229[/C][C]107759.6261[/C][C]0.1308[/C][C]0.1228[/C][C]0[/C][C]0[/C][/ROW]
[ROW][C]53[/C][C]101281[/C][C]97653.8567[/C][C]90469.2113[/C][C]105471.1242[/C][C]0.1816[/C][C]0.037[/C][C]3e-04[/C][C]0[/C][/ROW]
[ROW][C]54[/C][C]94545[/C][C]92752.2274[/C][C]85197.0891[/C][C]101050.8901[/C][C]0.336[/C][C]0.022[/C][C]0.0026[/C][C]0[/C][/ROW]
[ROW][C]55[/C][C]93248[/C][C]89774.6473[/C][C]81823.7881[/C][C]98583.6317[/C][C]0.2198[/C][C]0.1443[/C][C]0.0037[/C][C]0[/C][/ROW]
[ROW][C]56[/C][C]84031[/C][C]85384.5967[/C][C]77287.8103[/C][C]94424.2369[/C][C]0.3846[/C][C]0.0441[/C][C]0.0235[/C][C]0[/C][/ROW]
[ROW][C]57[/C][C]87486[/C][C]85531.2904[/C][C]76891.2599[/C][C]95251.2915[/C][C]0.3467[/C][C]0.6189[/C][C]0.0647[/C][C]0[/C][/ROW]
[ROW][C]58[/C][C]115867[/C][C]111690.4087[/C][C]99462.5712[/C][C]125592.2416[/C][C]0.278[/C][C]0.9997[/C][C]0.0397[/C][C]0.3219[/C][/ROW]
[ROW][C]59[/C][C]120327[/C][C]117324.2856[/C][C]103768.187[/C][C]132853.9514[/C][C]0.3524[/C][C]0.573[/C][C]0.0498[/C][C]0.6168[/C][/ROW]
[ROW][C]60[/C][C]117008[/C][C]114964.0089[/C][C]101103.2253[/C][C]130943.8154[/C][C]0.401[/C][C]0.2553[/C][C]0.1353[/C][C]0.4997[/C][/ROW]
[ROW][C]61[/C][C]108811[/C][C]106153.6829[/C][C]92925.1568[/C][C]121483.2836[/C][C]0.367[/C][C]0.0826[/C][C]0.1298[/C][C]0.1298[/C][/ROW]
[/TABLE]
Source: https://freestatistics.org/blog/index.php?pk=33984&T=1

Globally Unique Identifier (entire table): ba.freestatistics.org/blog/index.php?pk=33984&T=1

As an alternative you can also use a QR Code:  

The GUIDs for individual cells are displayed in the table below:

Univariate ARIMA Extrapolation Forecast
timeY[t]F[t]95% LB95% UBp-value(H0: Y[t] = F[t])P(F[t]>Y[t-1])P(F[t]>Y[t-s])P(F[t]>Y[49])
37134339.000000000-------
38122683.000000000-------
39115614.000000000-------
40116566-------
41111272-------
42104609-------
43101802-------
4494542.0000000001-------
4593051.0000000001-------
46124129.000000000-------
47130374-------
48123946-------
49114971-------
50105531106461.8945102429.3144110669.7990.3323000
51104919102605.541397176.3354108370.27430.21580.1600
52104782100789.570194312.229107759.62610.13080.122800
5310128197653.856790469.2113105471.12420.18160.0373e-040
549454592752.227485197.0891101050.89010.3360.0220.00260
559324889774.647381823.788198583.63170.21980.14430.00370
568403185384.596777287.810394424.23690.38460.04410.02350
578748685531.290476891.259995251.29150.34670.61890.06470
58115867111690.408799462.5712125592.24160.2780.99970.03970.3219
59120327117324.2856103768.187132853.95140.35240.5730.04980.6168
60117008114964.0089101103.2253130943.81540.4010.25530.13530.4997
61108811106153.682992925.1568121483.28360.3670.08260.12980.1298


Univariate ARIMA Extrapolation Forecast Performance
time% S.E.PEMAPESq.EMSERMSE
500.0202-0.00877e-04866564.53372213.7111268.7261
510.02870.02250.00195352091.346446007.6122667.838
520.03530.03960.003315939496.57941328291.38161152.5152
530.04080.03710.003113156168.87251096347.4061047.0661
540.04560.01930.00163214033.4801267836.1233517.5289
550.05010.03870.003212064178.7541005348.22951002.6705
560.054-0.01590.00131832223.9782152685.3315390.7497
570.0580.02290.00193820889.6128318407.4677564.2761
580.06350.03740.003117443914.90741453659.57561205.6781
590.06750.02560.00219016293.8192751357.8183866.809
600.07090.01780.00154177899.688348158.3073590.0494
610.07370.0250.00217061334.4038588444.5337767.1014

\begin{tabular}{lllllllll}
\hline
Univariate ARIMA Extrapolation Forecast Performance \tabularnewline
time & % S.E. & PE & MAPE & Sq.E & MSE & RMSE \tabularnewline
50 & 0.0202 & -0.0087 & 7e-04 & 866564.533 & 72213.7111 & 268.7261 \tabularnewline
51 & 0.0287 & 0.0225 & 0.0019 & 5352091.346 & 446007.6122 & 667.838 \tabularnewline
52 & 0.0353 & 0.0396 & 0.0033 & 15939496.5794 & 1328291.3816 & 1152.5152 \tabularnewline
53 & 0.0408 & 0.0371 & 0.0031 & 13156168.8725 & 1096347.406 & 1047.0661 \tabularnewline
54 & 0.0456 & 0.0193 & 0.0016 & 3214033.4801 & 267836.1233 & 517.5289 \tabularnewline
55 & 0.0501 & 0.0387 & 0.0032 & 12064178.754 & 1005348.2295 & 1002.6705 \tabularnewline
56 & 0.054 & -0.0159 & 0.0013 & 1832223.9782 & 152685.3315 & 390.7497 \tabularnewline
57 & 0.058 & 0.0229 & 0.0019 & 3820889.6128 & 318407.4677 & 564.2761 \tabularnewline
58 & 0.0635 & 0.0374 & 0.0031 & 17443914.9074 & 1453659.5756 & 1205.6781 \tabularnewline
59 & 0.0675 & 0.0256 & 0.0021 & 9016293.8192 & 751357.8183 & 866.809 \tabularnewline
60 & 0.0709 & 0.0178 & 0.0015 & 4177899.688 & 348158.3073 & 590.0494 \tabularnewline
61 & 0.0737 & 0.025 & 0.0021 & 7061334.4038 & 588444.5337 & 767.1014 \tabularnewline
\hline
\end{tabular}
%Source: https://freestatistics.org/blog/index.php?pk=33984&T=2

[TABLE]
[ROW][C]Univariate ARIMA Extrapolation Forecast Performance[/C][/ROW]
[ROW][C]time[/C][C]% S.E.[/C][C]PE[/C][C]MAPE[/C][C]Sq.E[/C][C]MSE[/C][C]RMSE[/C][/ROW]
[ROW][C]50[/C][C]0.0202[/C][C]-0.0087[/C][C]7e-04[/C][C]866564.533[/C][C]72213.7111[/C][C]268.7261[/C][/ROW]
[ROW][C]51[/C][C]0.0287[/C][C]0.0225[/C][C]0.0019[/C][C]5352091.346[/C][C]446007.6122[/C][C]667.838[/C][/ROW]
[ROW][C]52[/C][C]0.0353[/C][C]0.0396[/C][C]0.0033[/C][C]15939496.5794[/C][C]1328291.3816[/C][C]1152.5152[/C][/ROW]
[ROW][C]53[/C][C]0.0408[/C][C]0.0371[/C][C]0.0031[/C][C]13156168.8725[/C][C]1096347.406[/C][C]1047.0661[/C][/ROW]
[ROW][C]54[/C][C]0.0456[/C][C]0.0193[/C][C]0.0016[/C][C]3214033.4801[/C][C]267836.1233[/C][C]517.5289[/C][/ROW]
[ROW][C]55[/C][C]0.0501[/C][C]0.0387[/C][C]0.0032[/C][C]12064178.754[/C][C]1005348.2295[/C][C]1002.6705[/C][/ROW]
[ROW][C]56[/C][C]0.054[/C][C]-0.0159[/C][C]0.0013[/C][C]1832223.9782[/C][C]152685.3315[/C][C]390.7497[/C][/ROW]
[ROW][C]57[/C][C]0.058[/C][C]0.0229[/C][C]0.0019[/C][C]3820889.6128[/C][C]318407.4677[/C][C]564.2761[/C][/ROW]
[ROW][C]58[/C][C]0.0635[/C][C]0.0374[/C][C]0.0031[/C][C]17443914.9074[/C][C]1453659.5756[/C][C]1205.6781[/C][/ROW]
[ROW][C]59[/C][C]0.0675[/C][C]0.0256[/C][C]0.0021[/C][C]9016293.8192[/C][C]751357.8183[/C][C]866.809[/C][/ROW]
[ROW][C]60[/C][C]0.0709[/C][C]0.0178[/C][C]0.0015[/C][C]4177899.688[/C][C]348158.3073[/C][C]590.0494[/C][/ROW]
[ROW][C]61[/C][C]0.0737[/C][C]0.025[/C][C]0.0021[/C][C]7061334.4038[/C][C]588444.5337[/C][C]767.1014[/C][/ROW]
[/TABLE]
Source: https://freestatistics.org/blog/index.php?pk=33984&T=2

Globally Unique Identifier (entire table): ba.freestatistics.org/blog/index.php?pk=33984&T=2

As an alternative you can also use a QR Code:  

The GUIDs for individual cells are displayed in the table below:

Univariate ARIMA Extrapolation Forecast Performance
time% S.E.PEMAPESq.EMSERMSE
500.0202-0.00877e-04866564.53372213.7111268.7261
510.02870.02250.00195352091.346446007.6122667.838
520.03530.03960.003315939496.57941328291.38161152.5152
530.04080.03710.003113156168.87251096347.4061047.0661
540.04560.01930.00163214033.4801267836.1233517.5289
550.05010.03870.003212064178.7541005348.22951002.6705
560.054-0.01590.00131832223.9782152685.3315390.7497
570.0580.02290.00193820889.6128318407.4677564.2761
580.06350.03740.003117443914.90741453659.57561205.6781
590.06750.02560.00219016293.8192751357.8183866.809
600.07090.01780.00154177899.688348158.3073590.0494
610.07370.0250.00217061334.4038588444.5337767.1014


Parameters (Session):
par1 = 12 ; par2 = -0.1 ; par3 = 1 ; par4 = 1 ; par5 = 12 ; par6 = 0 ; par7 = 0 ; par8 = 0 ; par9 = 1 ; par10 = FALSE ;
Parameters (R input):
par1 = 12 ; par2 = -0.1 ; par3 = 1 ; par4 = 1 ; par5 = 12 ; par6 = 0 ; par7 = 0 ; par8 = 0 ; par9 = 1 ; par10 = FALSE ;
R code (references can be found in the software module):
par1 <- as.numeric(par1) #cut off periods
par2 <- as.numeric(par2) #lambda
par3 <- as.numeric(par3) #degree of non-seasonal differencing
par4 <- as.numeric(par4) #degree of seasonal differencing
par5 <- as.numeric(par5) #seasonal period
par6 <- as.numeric(par6) #p
par7 <- as.numeric(par7) #q
par8 <- as.numeric(par8) #P
par9 <- as.numeric(par9) #Q
if (par10 == 'TRUE') par10 <- TRUE
if (par10 == 'FALSE') par10 <- FALSE
if (par2 == 0) x <- log(x)
if (par2 != 0) x <- x^par2
lx <- length(x)
first <- lx - 2*par1
nx <- lx - par1
nx1 <- nx + 1
fx <- lx - nx
if (fx < 1) {
fx <- par5
nx1 <- lx + fx - 1
first <- lx - 2*fx
}
first <- 1
if (fx < 3) fx <- round(lx/10,0)
(arima.out <- arima(x[1:nx], order=c(par6,par3,par7), seasonal=list(order=c(par8,par4,par9), period=par5), include.mean=par10, method='ML'))
(forecast <- predict(arima.out,fx))
(lb <- forecast$pred - 1.96 * forecast$se)
(ub <- forecast$pred + 1.96 * forecast$se)
if (par2 == 0) {
x <- exp(x)
forecast$pred <- exp(forecast$pred)
lb <- exp(lb)
ub <- exp(ub)
}
if (par2 != 0) {
x <- x^(1/par2)
forecast$pred <- forecast$pred^(1/par2)
lb <- lb^(1/par2)
ub <- ub^(1/par2)
}
if (par2 < 0) {
olb <- lb
lb <- ub
ub <- olb
}
(actandfor <- c(x[1:nx], forecast$pred))
(perc.se <- (ub-forecast$pred)/1.96/forecast$pred)
bitmap(file='test1.png')
opar <- par(mar=c(4,4,2,2),las=1)
ylim <- c( min(x[first:nx],lb), max(x[first:nx],ub))
plot(x,ylim=ylim,type='n',xlim=c(first,lx))
usr <- par('usr')
rect(usr[1],usr[3],nx+1,usr[4],border=NA,col='lemonchiffon')
rect(nx1,usr[3],usr[2],usr[4],border=NA,col='lavender')
abline(h= (-3:3)*2 , col ='gray', lty =3)
polygon( c(nx1:lx,lx:nx1), c(lb,rev(ub)), col = 'orange', lty=2,border=NA)
lines(nx1:lx, lb , lty=2)
lines(nx1:lx, ub , lty=2)
lines(x, lwd=2)
lines(nx1:lx, forecast$pred , lwd=2 , col ='white')
box()
par(opar)
dev.off()
prob.dec <- array(NA, dim=fx)
prob.sdec <- array(NA, dim=fx)
prob.ldec <- array(NA, dim=fx)
prob.pval <- array(NA, dim=fx)
perf.pe <- array(0, dim=fx)
perf.mape <- array(0, dim=fx)
perf.se <- array(0, dim=fx)
perf.mse <- array(0, dim=fx)
perf.rmse <- array(0, dim=fx)
for (i in 1:fx) {
locSD <- (ub[i] - forecast$pred[i]) / 1.96
perf.pe[i] = (x[nx+i] - forecast$pred[i]) / forecast$pred[i]
perf.mape[i] = perf.mape[i] + abs(perf.pe[i])
perf.se[i] = (x[nx+i] - forecast$pred[i])^2
perf.mse[i] = perf.mse[i] + perf.se[i]
prob.dec[i] = pnorm((x[nx+i-1] - forecast$pred[i]) / locSD)
prob.sdec[i] = pnorm((x[nx+i-par5] - forecast$pred[i]) / locSD)
prob.ldec[i] = pnorm((x[nx] - forecast$pred[i]) / locSD)
prob.pval[i] = pnorm(abs(x[nx+i] - forecast$pred[i]) / locSD)
}
perf.mape = perf.mape / fx
perf.mse = perf.mse / fx
perf.rmse = sqrt(perf.mse)
bitmap(file='test2.png')
plot(forecast$pred, pch=19, type='b',main='ARIMA Extrapolation Forecast', ylab='Forecast and 95% CI', xlab='time',ylim=c(min(lb),max(ub)))
dum <- forecast$pred
dum[1:12] <- x[(nx+1):lx]
lines(dum, lty=1)
lines(ub,lty=3)
lines(lb,lty=3)
dev.off()
load(file='createtable')
a<-table.start()
a<-table.row.start(a)
a<-table.element(a,'Univariate ARIMA Extrapolation Forecast',9,TRUE)
a<-table.row.end(a)
a<-table.row.start(a)
a<-table.element(a,'time',1,header=TRUE)
a<-table.element(a,'Y[t]',1,header=TRUE)
a<-table.element(a,'F[t]',1,header=TRUE)
a<-table.element(a,'95% LB',1,header=TRUE)
a<-table.element(a,'95% UB',1,header=TRUE)
a<-table.element(a,'p-value
(H0: Y[t] = F[t])',1,header=TRUE)
a<-table.element(a,'P(F[t]>Y[t-1])',1,header=TRUE)
a<-table.element(a,'P(F[t]>Y[t-s])',1,header=TRUE)
mylab <- paste('P(F[t]>Y[',nx,sep='')
mylab <- paste(mylab,'])',sep='')
a<-table.element(a,mylab,1,header=TRUE)
a<-table.row.end(a)
for (i in (nx-par5):nx) {
a<-table.row.start(a)
a<-table.element(a,i,header=TRUE)
a<-table.element(a,x[i])
a<-table.element(a,'-')
a<-table.row.end(a)
}
for (i in 1:fx) {
a<-table.row.start(a)
a<-table.element(a,nx+i,header=TRUE)
a<-table.element(a,round(x[nx+i],4))
a<-table.element(a,round(forecast$pred[i],4))
a<-table.element(a,round(lb[i],4))
a<-table.element(a,round(ub[i],4))
a<-table.element(a,round((1-prob.pval[i]),4))
a<-table.element(a,round((1-prob.dec[i]),4))
a<-table.element(a,round((1-prob.sdec[i]),4))
a<-table.element(a,round((1-prob.ldec[i]),4))
a<-table.row.end(a)
}
a<-table.end(a)
table.save(a,file='mytable.tab')
a<-table.start()
a<-table.row.start(a)
a<-table.element(a,'Univariate ARIMA Extrapolation Forecast Performance',7,TRUE)
a<-table.row.end(a)
a<-table.row.start(a)
a<-table.element(a,'time',1,header=TRUE)
a<-table.element(a,'% S.E.',1,header=TRUE)
a<-table.element(a,'PE',1,header=TRUE)
a<-table.element(a,'MAPE',1,header=TRUE)
a<-table.element(a,'Sq.E',1,header=TRUE)
a<-table.element(a,'MSE',1,header=TRUE)
a<-table.element(a,'RMSE',1,header=TRUE)
a<-table.row.end(a)
for (i in 1:fx) {
a<-table.row.start(a)
a<-table.element(a,nx+i,header=TRUE)
a<-table.element(a,round(perc.se[i],4))
a<-table.element(a,round(perf.pe[i],4))
a<-table.element(a,round(perf.mape[i],4))
a<-table.element(a,round(perf.se[i],4))
a<-table.element(a,round(perf.mse[i],4))
a<-table.element(a,round(perf.rmse[i],4))
a<-table.row.end(a)
}
a<-table.end(a)
table.save(a,file='mytable1.tab')