Free Statistics

of Irreproducible Research!

Author's title

Author*The author of this computation has been verified*
R Software Modulerwasp_arimaforecasting.wasp
Title produced by softwareARIMA Forecasting
Date of computationTue, 16 Dec 2008 06:10:36 -0700
Cite this page as followsStatistical Computations at FreeStatistics.org, Office for Research Development and Education, URL https://freestatistics.org/blog/index.php?v=date/2008/Dec/16/t1229433117rox6fzqfe88nt34.htm/, Retrieved Wed, 15 May 2024 17:14:45 +0000
Statistical Computations at FreeStatistics.org, Office for Research Development and Education, URL https://freestatistics.org/blog/index.php?pk=33944, Retrieved Wed, 15 May 2024 17:14:45 +0000
QR Codes:

Original text written by user:
IsPrivate?No (this computation is public)
User-defined keywords
Estimated Impact163
Family? (F = Feedback message, R = changed R code, M = changed R Module, P = changed Parameters, D = changed Data)
F       [ARIMA Forecasting] [ARIMA forecast] [2008-12-16 13:10:36] [5bd06487453d0eec7a1bf04bf9f25085] [Current]
Feedback Forum
2008-12-23 14:48:21 [Annemiek Hoofman] [reply
Met wat extra uitleg over de gegevens in de tabel, begrijp je misschien beter hoe het in elkaar zit:

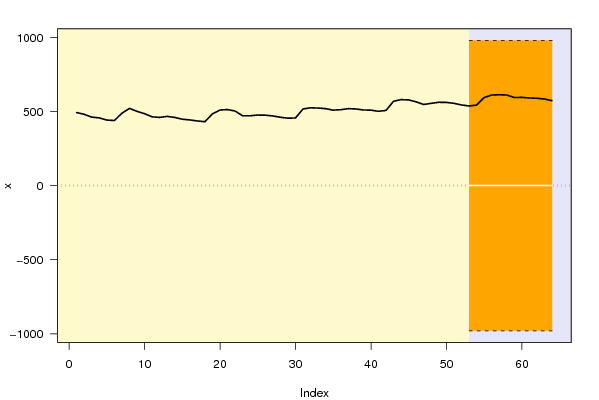
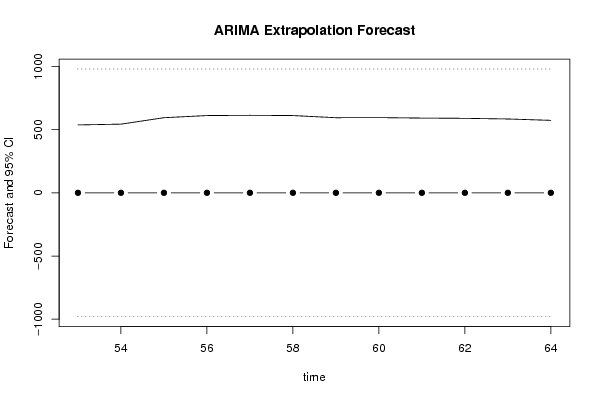
Y[t] = zijn de werkelijke waarden van de 12 maanden die we hebben ‘afgeknipt’ van de tijdreeks en waarvoor we een voorspelling hebben gedaan.

F[t] = de waarden die voorspeld werden op basis van het model

95% Lower en Upper bound = met een waarschijnlijkheid van 95% ligt de volgende waarde binnen deze grenzen. Dit geldt wel enkel ceteris paribus. Dat wil zeggen dat we veronderstellen dat de omstandigheden normaal zijn en zo blijven.

H0 Y(t) = F (t) De nulhypothese veronderstelt dat de voorspelde waarden gelijk zijn aan de werkelijke waarden en dat ons model dus volledig correct is.

P-value van H0 = de kans dat we ons vergissen bij het verwerpen van de nulhypothese. Y(t) en F (t) mogen niet significant van elkaar verschillen. Dit betekent dat de P-waarde in dit geval niet kleiner mag zijn dan 5%.

P(F[t]>Y[t-1]) = Wat is de waarschijnlijkheid dat de volgende waarde groter is dan de vorige gekende periode?

P(F[t]>Y[t-s]) = de kans op stijgen in vergelijking met dezelfde maand vorig jaar

P(F[t]>Y[81]) = de kans op stijgen tov de laatst gekende waarde.

De onderliggende assumpties veronderstellen dat in de residus geen autocorrelatie meer voorkomt en dat deze normaal verdeeld zijn en dat de spreiding ervan constant is. Het gemiddelde van de residus moet gelijk zijn aan nul. Dit kunnen we testen in bv de module arima backward selection dat een ACF, PACF, Q-Q plot, Density Plot en histogram van de residus weergeeft.

Post a new message
Dataseries X:
493
481
462
457
442
439
488
521
501
485
464
460
467
460
448
443
436
431
484
510
513
503
471
471
476
475
470
461
455
456
517
525
523
519
509
512
519
517
510
509
501
507
569
580
578
565
547
555
562
561
555
544
537
543
594
611
613
611
594
595
591
589
584
573


Summary of computational transaction
Raw Inputview raw input (R code)
Raw Outputview raw output of R engine
Computing time1 seconds
R Server'George Udny Yule' @ 72.249.76.132

\begin{tabular}{lllllllll}
\hline
Summary of computational transaction \tabularnewline
Raw Input & view raw input (R code)  \tabularnewline
Raw Output & view raw output of R engine  \tabularnewline
Computing time & 1 seconds \tabularnewline
R Server & 'George Udny Yule' @ 72.249.76.132 \tabularnewline
\hline
\end{tabular}
%Source: https://freestatistics.org/blog/index.php?pk=33944&T=0

[TABLE]
[ROW][C]Summary of computational transaction[/C][/ROW]
[ROW][C]Raw Input[/C][C]view raw input (R code) [/C][/ROW]
[ROW][C]Raw Output[/C][C]view raw output of R engine [/C][/ROW]
[ROW][C]Computing time[/C][C]1 seconds[/C][/ROW]
[ROW][C]R Server[/C][C]'George Udny Yule' @ 72.249.76.132[/C][/ROW]
[/TABLE]
Source: https://freestatistics.org/blog/index.php?pk=33944&T=0

Globally Unique Identifier (entire table): ba.freestatistics.org/blog/index.php?pk=33944&T=0

As an alternative you can also use a QR Code:  

The GUIDs for individual cells are displayed in the table below:

Summary of computational transaction
Raw Inputview raw input (R code)
Raw Outputview raw output of R engine
Computing time1 seconds
R Server'George Udny Yule' @ 72.249.76.132


Univariate ARIMA Extrapolation Forecast
timeY[t]F[t]95% LB95% UBp-value(H0: Y[t] = F[t])P(F[t]>Y[t-1])P(F[t]>Y[t-s])P(F[t]>Y[52])
51555-------
52544-------
535370-979.6582979.65820.14130.13820.13820.1382
545430-979.6582979.65820.13870.14130.14130.1382
555940-979.6582979.65820.11730.13870.13870.1382
566110-979.6582979.65820.11080.11730.11730.1382
576130-979.6582979.65820.110.11080.11080.1382
586110-979.6582979.65820.11080.110.110.1382
595940-979.6582979.65820.11730.11080.11080.1382
605950-979.6582979.65820.11690.11730.11730.1382
615910-979.6582979.65820.11850.11690.11690.1382
625890-979.6582979.65820.11930.11850.11850.1382
635840-979.6582979.65820.12130.11930.11930.1382
645730-979.6582979.65820.12580.12130.12130.1382

\begin{tabular}{lllllllll}
\hline
Univariate ARIMA Extrapolation Forecast \tabularnewline
time & Y[t] & F[t] & 95% LB & 95% UB & p-value(H0: Y[t] = F[t]) & P(F[t]>Y[t-1]) & P(F[t]>Y[t-s]) & P(F[t]>Y[52]) \tabularnewline
51 & 555 & - & - & - & - & - & - & - \tabularnewline
52 & 544 & - & - & - & - & - & - & - \tabularnewline
53 & 537 & 0 & -979.6582 & 979.6582 & 0.1413 & 0.1382 & 0.1382 & 0.1382 \tabularnewline
54 & 543 & 0 & -979.6582 & 979.6582 & 0.1387 & 0.1413 & 0.1413 & 0.1382 \tabularnewline
55 & 594 & 0 & -979.6582 & 979.6582 & 0.1173 & 0.1387 & 0.1387 & 0.1382 \tabularnewline
56 & 611 & 0 & -979.6582 & 979.6582 & 0.1108 & 0.1173 & 0.1173 & 0.1382 \tabularnewline
57 & 613 & 0 & -979.6582 & 979.6582 & 0.11 & 0.1108 & 0.1108 & 0.1382 \tabularnewline
58 & 611 & 0 & -979.6582 & 979.6582 & 0.1108 & 0.11 & 0.11 & 0.1382 \tabularnewline
59 & 594 & 0 & -979.6582 & 979.6582 & 0.1173 & 0.1108 & 0.1108 & 0.1382 \tabularnewline
60 & 595 & 0 & -979.6582 & 979.6582 & 0.1169 & 0.1173 & 0.1173 & 0.1382 \tabularnewline
61 & 591 & 0 & -979.6582 & 979.6582 & 0.1185 & 0.1169 & 0.1169 & 0.1382 \tabularnewline
62 & 589 & 0 & -979.6582 & 979.6582 & 0.1193 & 0.1185 & 0.1185 & 0.1382 \tabularnewline
63 & 584 & 0 & -979.6582 & 979.6582 & 0.1213 & 0.1193 & 0.1193 & 0.1382 \tabularnewline
64 & 573 & 0 & -979.6582 & 979.6582 & 0.1258 & 0.1213 & 0.1213 & 0.1382 \tabularnewline
\hline
\end{tabular}
%Source: https://freestatistics.org/blog/index.php?pk=33944&T=1

[TABLE]
[ROW][C]Univariate ARIMA Extrapolation Forecast[/C][/ROW]
[ROW][C]time[/C][C]Y[t][/C][C]F[t][/C][C]95% LB[/C][C]95% UB[/C][C]p-value(H0: Y[t] = F[t])[/C][C]P(F[t]>Y[t-1])[/C][C]P(F[t]>Y[t-s])[/C][C]P(F[t]>Y[52])[/C][/ROW]
[ROW][C]51[/C][C]555[/C][C]-[/C][C]-[/C][C]-[/C][C]-[/C][C]-[/C][C]-[/C][C]-[/C][/ROW]
[ROW][C]52[/C][C]544[/C][C]-[/C][C]-[/C][C]-[/C][C]-[/C][C]-[/C][C]-[/C][C]-[/C][/ROW]
[ROW][C]53[/C][C]537[/C][C]0[/C][C]-979.6582[/C][C]979.6582[/C][C]0.1413[/C][C]0.1382[/C][C]0.1382[/C][C]0.1382[/C][/ROW]
[ROW][C]54[/C][C]543[/C][C]0[/C][C]-979.6582[/C][C]979.6582[/C][C]0.1387[/C][C]0.1413[/C][C]0.1413[/C][C]0.1382[/C][/ROW]
[ROW][C]55[/C][C]594[/C][C]0[/C][C]-979.6582[/C][C]979.6582[/C][C]0.1173[/C][C]0.1387[/C][C]0.1387[/C][C]0.1382[/C][/ROW]
[ROW][C]56[/C][C]611[/C][C]0[/C][C]-979.6582[/C][C]979.6582[/C][C]0.1108[/C][C]0.1173[/C][C]0.1173[/C][C]0.1382[/C][/ROW]
[ROW][C]57[/C][C]613[/C][C]0[/C][C]-979.6582[/C][C]979.6582[/C][C]0.11[/C][C]0.1108[/C][C]0.1108[/C][C]0.1382[/C][/ROW]
[ROW][C]58[/C][C]611[/C][C]0[/C][C]-979.6582[/C][C]979.6582[/C][C]0.1108[/C][C]0.11[/C][C]0.11[/C][C]0.1382[/C][/ROW]
[ROW][C]59[/C][C]594[/C][C]0[/C][C]-979.6582[/C][C]979.6582[/C][C]0.1173[/C][C]0.1108[/C][C]0.1108[/C][C]0.1382[/C][/ROW]
[ROW][C]60[/C][C]595[/C][C]0[/C][C]-979.6582[/C][C]979.6582[/C][C]0.1169[/C][C]0.1173[/C][C]0.1173[/C][C]0.1382[/C][/ROW]
[ROW][C]61[/C][C]591[/C][C]0[/C][C]-979.6582[/C][C]979.6582[/C][C]0.1185[/C][C]0.1169[/C][C]0.1169[/C][C]0.1382[/C][/ROW]
[ROW][C]62[/C][C]589[/C][C]0[/C][C]-979.6582[/C][C]979.6582[/C][C]0.1193[/C][C]0.1185[/C][C]0.1185[/C][C]0.1382[/C][/ROW]
[ROW][C]63[/C][C]584[/C][C]0[/C][C]-979.6582[/C][C]979.6582[/C][C]0.1213[/C][C]0.1193[/C][C]0.1193[/C][C]0.1382[/C][/ROW]
[ROW][C]64[/C][C]573[/C][C]0[/C][C]-979.6582[/C][C]979.6582[/C][C]0.1258[/C][C]0.1213[/C][C]0.1213[/C][C]0.1382[/C][/ROW]
[/TABLE]
Source: https://freestatistics.org/blog/index.php?pk=33944&T=1

Globally Unique Identifier (entire table): ba.freestatistics.org/blog/index.php?pk=33944&T=1

As an alternative you can also use a QR Code:  

The GUIDs for individual cells are displayed in the table below:

Univariate ARIMA Extrapolation Forecast
timeY[t]F[t]95% LB95% UBp-value(H0: Y[t] = F[t])P(F[t]>Y[t-1])P(F[t]>Y[t-s])P(F[t]>Y[52])
51555-------
52544-------
535370-979.6582979.65820.14130.13820.13820.1382
545430-979.6582979.65820.13870.14130.14130.1382
555940-979.6582979.65820.11730.13870.13870.1382
566110-979.6582979.65820.11080.11730.11730.1382
576130-979.6582979.65820.110.11080.11080.1382
586110-979.6582979.65820.11080.110.110.1382
595940-979.6582979.65820.11730.11080.11080.1382
605950-979.6582979.65820.11690.11730.11730.1382
615910-979.6582979.65820.11850.11690.11690.1382
625890-979.6582979.65820.11930.11850.11850.1382
635840-979.6582979.65820.12130.11930.11930.1382
645730-979.6582979.65820.12580.12130.12130.1382


Univariate ARIMA Extrapolation Forecast Performance
time% S.E.PEMAPESq.EMSERMSE
53InfInfInf28836924030.75155.0185
54InfInfInf29484924570.75156.7506
55InfInfInf35283629403171.473
56InfInfInf37332131110.0833176.3805
57InfInfInf37576931314.0833176.9579
58InfInfInf37332131110.0833176.3805
59InfInfInf35283629403171.473
60InfInfInf35402529502.0833171.7617
61InfInfInf34928129106.75170.607
62InfInfInf34692128910.0833170.0297
63InfInfInf34105628421.3333168.5863
64InfInfInf32832927360.75165.4109

\begin{tabular}{lllllllll}
\hline
Univariate ARIMA Extrapolation Forecast Performance \tabularnewline
time & % S.E. & PE & MAPE & Sq.E & MSE & RMSE \tabularnewline
53 & Inf & Inf & Inf & 288369 & 24030.75 & 155.0185 \tabularnewline
54 & Inf & Inf & Inf & 294849 & 24570.75 & 156.7506 \tabularnewline
55 & Inf & Inf & Inf & 352836 & 29403 & 171.473 \tabularnewline
56 & Inf & Inf & Inf & 373321 & 31110.0833 & 176.3805 \tabularnewline
57 & Inf & Inf & Inf & 375769 & 31314.0833 & 176.9579 \tabularnewline
58 & Inf & Inf & Inf & 373321 & 31110.0833 & 176.3805 \tabularnewline
59 & Inf & Inf & Inf & 352836 & 29403 & 171.473 \tabularnewline
60 & Inf & Inf & Inf & 354025 & 29502.0833 & 171.7617 \tabularnewline
61 & Inf & Inf & Inf & 349281 & 29106.75 & 170.607 \tabularnewline
62 & Inf & Inf & Inf & 346921 & 28910.0833 & 170.0297 \tabularnewline
63 & Inf & Inf & Inf & 341056 & 28421.3333 & 168.5863 \tabularnewline
64 & Inf & Inf & Inf & 328329 & 27360.75 & 165.4109 \tabularnewline
\hline
\end{tabular}
%Source: https://freestatistics.org/blog/index.php?pk=33944&T=2

[TABLE]
[ROW][C]Univariate ARIMA Extrapolation Forecast Performance[/C][/ROW]
[ROW][C]time[/C][C]% S.E.[/C][C]PE[/C][C]MAPE[/C][C]Sq.E[/C][C]MSE[/C][C]RMSE[/C][/ROW]
[ROW][C]53[/C][C]Inf[/C][C]Inf[/C][C]Inf[/C][C]288369[/C][C]24030.75[/C][C]155.0185[/C][/ROW]
[ROW][C]54[/C][C]Inf[/C][C]Inf[/C][C]Inf[/C][C]294849[/C][C]24570.75[/C][C]156.7506[/C][/ROW]
[ROW][C]55[/C][C]Inf[/C][C]Inf[/C][C]Inf[/C][C]352836[/C][C]29403[/C][C]171.473[/C][/ROW]
[ROW][C]56[/C][C]Inf[/C][C]Inf[/C][C]Inf[/C][C]373321[/C][C]31110.0833[/C][C]176.3805[/C][/ROW]
[ROW][C]57[/C][C]Inf[/C][C]Inf[/C][C]Inf[/C][C]375769[/C][C]31314.0833[/C][C]176.9579[/C][/ROW]
[ROW][C]58[/C][C]Inf[/C][C]Inf[/C][C]Inf[/C][C]373321[/C][C]31110.0833[/C][C]176.3805[/C][/ROW]
[ROW][C]59[/C][C]Inf[/C][C]Inf[/C][C]Inf[/C][C]352836[/C][C]29403[/C][C]171.473[/C][/ROW]
[ROW][C]60[/C][C]Inf[/C][C]Inf[/C][C]Inf[/C][C]354025[/C][C]29502.0833[/C][C]171.7617[/C][/ROW]
[ROW][C]61[/C][C]Inf[/C][C]Inf[/C][C]Inf[/C][C]349281[/C][C]29106.75[/C][C]170.607[/C][/ROW]
[ROW][C]62[/C][C]Inf[/C][C]Inf[/C][C]Inf[/C][C]346921[/C][C]28910.0833[/C][C]170.0297[/C][/ROW]
[ROW][C]63[/C][C]Inf[/C][C]Inf[/C][C]Inf[/C][C]341056[/C][C]28421.3333[/C][C]168.5863[/C][/ROW]
[ROW][C]64[/C][C]Inf[/C][C]Inf[/C][C]Inf[/C][C]328329[/C][C]27360.75[/C][C]165.4109[/C][/ROW]
[/TABLE]
Source: https://freestatistics.org/blog/index.php?pk=33944&T=2

Globally Unique Identifier (entire table): ba.freestatistics.org/blog/index.php?pk=33944&T=2

As an alternative you can also use a QR Code:  

The GUIDs for individual cells are displayed in the table below:

Univariate ARIMA Extrapolation Forecast Performance
time% S.E.PEMAPESq.EMSERMSE
53InfInfInf28836924030.75155.0185
54InfInfInf29484924570.75156.7506
55InfInfInf35283629403171.473
56InfInfInf37332131110.0833176.3805
57InfInfInf37576931314.0833176.9579
58InfInfInf37332131110.0833176.3805
59InfInfInf35283629403171.473
60InfInfInf35402529502.0833171.7617
61InfInfInf34928129106.75170.607
62InfInfInf34692128910.0833170.0297
63InfInfInf34105628421.3333168.5863
64InfInfInf32832927360.75165.4109


Parameters (Session):
par1 = 12 ; par2 = 1 ; par3 = 0 ; par4 = 0 ; par5 = 1 ; par6 = 0 ; par7 = 0 ; par8 = 0 ; par9 = 0 ; par10 = FALSE ;
Parameters (R input):
par1 = 12 ; par2 = 1 ; par3 = 0 ; par4 = 0 ; par5 = 1 ; par6 = 0 ; par7 = 0 ; par8 = 0 ; par9 = 0 ; par10 = FALSE ;
R code (references can be found in the software module):
par1 <- as.numeric(par1) #cut off periods
par2 <- as.numeric(par2) #lambda
par3 <- as.numeric(par3) #degree of non-seasonal differencing
par4 <- as.numeric(par4) #degree of seasonal differencing
par5 <- as.numeric(par5) #seasonal period
par6 <- as.numeric(par6) #p
par7 <- as.numeric(par7) #q
par8 <- as.numeric(par8) #P
par9 <- as.numeric(par9) #Q
if (par10 == 'TRUE') par10 <- TRUE
if (par10 == 'FALSE') par10 <- FALSE
if (par2 == 0) x <- log(x)
if (par2 != 0) x <- x^par2
lx <- length(x)
first <- lx - 2*par1
nx <- lx - par1
nx1 <- nx + 1
fx <- lx - nx
if (fx < 1) {
fx <- par5
nx1 <- lx + fx - 1
first <- lx - 2*fx
}
first <- 1
if (fx < 3) fx <- round(lx/10,0)
(arima.out <- arima(x[1:nx], order=c(par6,par3,par7), seasonal=list(order=c(par8,par4,par9), period=par5), include.mean=par10, method='ML'))
(forecast <- predict(arima.out,fx))
(lb <- forecast$pred - 1.96 * forecast$se)
(ub <- forecast$pred + 1.96 * forecast$se)
if (par2 == 0) {
x <- exp(x)
forecast$pred <- exp(forecast$pred)
lb <- exp(lb)
ub <- exp(ub)
}
if (par2 != 0) {
x <- x^(1/par2)
forecast$pred <- forecast$pred^(1/par2)
lb <- lb^(1/par2)
ub <- ub^(1/par2)
}
if (par2 < 0) {
olb <- lb
lb <- ub
ub <- olb
}
(actandfor <- c(x[1:nx], forecast$pred))
(perc.se <- (ub-forecast$pred)/1.96/forecast$pred)
bitmap(file='test1.png')
opar <- par(mar=c(4,4,2,2),las=1)
ylim <- c( min(x[first:nx],lb), max(x[first:nx],ub))
plot(x,ylim=ylim,type='n',xlim=c(first,lx))
usr <- par('usr')
rect(usr[1],usr[3],nx+1,usr[4],border=NA,col='lemonchiffon')
rect(nx1,usr[3],usr[2],usr[4],border=NA,col='lavender')
abline(h= (-3:3)*2 , col ='gray', lty =3)
polygon( c(nx1:lx,lx:nx1), c(lb,rev(ub)), col = 'orange', lty=2,border=NA)
lines(nx1:lx, lb , lty=2)
lines(nx1:lx, ub , lty=2)
lines(x, lwd=2)
lines(nx1:lx, forecast$pred , lwd=2 , col ='white')
box()
par(opar)
dev.off()
prob.dec <- array(NA, dim=fx)
prob.sdec <- array(NA, dim=fx)
prob.ldec <- array(NA, dim=fx)
prob.pval <- array(NA, dim=fx)
perf.pe <- array(0, dim=fx)
perf.mape <- array(0, dim=fx)
perf.se <- array(0, dim=fx)
perf.mse <- array(0, dim=fx)
perf.rmse <- array(0, dim=fx)
for (i in 1:fx) {
locSD <- (ub[i] - forecast$pred[i]) / 1.96
perf.pe[i] = (x[nx+i] - forecast$pred[i]) / forecast$pred[i]
perf.mape[i] = perf.mape[i] + abs(perf.pe[i])
perf.se[i] = (x[nx+i] - forecast$pred[i])^2
perf.mse[i] = perf.mse[i] + perf.se[i]
prob.dec[i] = pnorm((x[nx+i-1] - forecast$pred[i]) / locSD)
prob.sdec[i] = pnorm((x[nx+i-par5] - forecast$pred[i]) / locSD)
prob.ldec[i] = pnorm((x[nx] - forecast$pred[i]) / locSD)
prob.pval[i] = pnorm(abs(x[nx+i] - forecast$pred[i]) / locSD)
}
perf.mape = perf.mape / fx
perf.mse = perf.mse / fx
perf.rmse = sqrt(perf.mse)
bitmap(file='test2.png')
plot(forecast$pred, pch=19, type='b',main='ARIMA Extrapolation Forecast', ylab='Forecast and 95% CI', xlab='time',ylim=c(min(lb),max(ub)))
dum <- forecast$pred
dum[1:12] <- x[(nx+1):lx]
lines(dum, lty=1)
lines(ub,lty=3)
lines(lb,lty=3)
dev.off()
load(file='createtable')
a<-table.start()
a<-table.row.start(a)
a<-table.element(a,'Univariate ARIMA Extrapolation Forecast',9,TRUE)
a<-table.row.end(a)
a<-table.row.start(a)
a<-table.element(a,'time',1,header=TRUE)
a<-table.element(a,'Y[t]',1,header=TRUE)
a<-table.element(a,'F[t]',1,header=TRUE)
a<-table.element(a,'95% LB',1,header=TRUE)
a<-table.element(a,'95% UB',1,header=TRUE)
a<-table.element(a,'p-value
(H0: Y[t] = F[t])',1,header=TRUE)
a<-table.element(a,'P(F[t]>Y[t-1])',1,header=TRUE)
a<-table.element(a,'P(F[t]>Y[t-s])',1,header=TRUE)
mylab <- paste('P(F[t]>Y[',nx,sep='')
mylab <- paste(mylab,'])',sep='')
a<-table.element(a,mylab,1,header=TRUE)
a<-table.row.end(a)
for (i in (nx-par5):nx) {
a<-table.row.start(a)
a<-table.element(a,i,header=TRUE)
a<-table.element(a,x[i])
a<-table.element(a,'-')
a<-table.row.end(a)
}
for (i in 1:fx) {
a<-table.row.start(a)
a<-table.element(a,nx+i,header=TRUE)
a<-table.element(a,round(x[nx+i],4))
a<-table.element(a,round(forecast$pred[i],4))
a<-table.element(a,round(lb[i],4))
a<-table.element(a,round(ub[i],4))
a<-table.element(a,round((1-prob.pval[i]),4))
a<-table.element(a,round((1-prob.dec[i]),4))
a<-table.element(a,round((1-prob.sdec[i]),4))
a<-table.element(a,round((1-prob.ldec[i]),4))
a<-table.row.end(a)
}
a<-table.end(a)
table.save(a,file='mytable.tab')
a<-table.start()
a<-table.row.start(a)
a<-table.element(a,'Univariate ARIMA Extrapolation Forecast Performance',7,TRUE)
a<-table.row.end(a)
a<-table.row.start(a)
a<-table.element(a,'time',1,header=TRUE)
a<-table.element(a,'% S.E.',1,header=TRUE)
a<-table.element(a,'PE',1,header=TRUE)
a<-table.element(a,'MAPE',1,header=TRUE)
a<-table.element(a,'Sq.E',1,header=TRUE)
a<-table.element(a,'MSE',1,header=TRUE)
a<-table.element(a,'RMSE',1,header=TRUE)
a<-table.row.end(a)
for (i in 1:fx) {
a<-table.row.start(a)
a<-table.element(a,nx+i,header=TRUE)
a<-table.element(a,round(perc.se[i],4))
a<-table.element(a,round(perf.pe[i],4))
a<-table.element(a,round(perf.mape[i],4))
a<-table.element(a,round(perf.se[i],4))
a<-table.element(a,round(perf.mse[i],4))
a<-table.element(a,round(perf.rmse[i],4))
a<-table.row.end(a)
}
a<-table.end(a)
table.save(a,file='mytable1.tab')