Free Statistics
of Irreproducible Research!
Description of Statistical Computation | |
|---|---|
| Author's title | |
| Author | *The author of this computation has been verified* |
| R Software Module | Rscript (source code is shown below) |
| Title produced by software | R console |
| Date of computation | Tue, 16 Dec 2008 05:50:07 -0700 |
| Cite this page as follows | Statistical Computations at FreeStatistics.org, Office for Research Development and Education, URL https://freestatistics.org/blog/index.php?v=date/2008/Dec/16/t1229431808zbjqqi0wcankly0.htm/, Retrieved Wed, 15 May 2024 15:23:12 +0000 |
| Statistical Computations at FreeStatistics.org, Office for Research Development and Education, URL https://freestatistics.org/blog/index.php?pk=33940, Retrieved Wed, 15 May 2024 15:23:12 +0000 | |
| QR Codes: | |
|
| |
| Original text written by user: | no comments |
| IsPrivate? | No (this computation is public) |
| User-defined keywords | key1,key2 |
| Estimated Impact | 169 |
Tree of Dependent Computations | |
| Family? (F = Feedback message, R = changed R code, M = changed R Module, P = changed Parameters, D = changed Data) | |
| - [R console] [test] [2008-12-16 12:50:07] [9871d3a2c554b27151cacf1422eec048] [Current] | |
| Feedback Forum | |
Post a new message | |
Dataset | |
| Dataseries X: | |
-1.09696821827591 0.684994503828054 0.345412998790708 0.229107393485417 1.99921119158596 1.45987686646266 0.544719554924786 -0.0267936432329688 1.15164874502632 0.342389652851396 -1.75150078776482 -0.306567965698356 -0.476795205158954 -0.593822952803735 -0.346010156899579 0.265019503679157 0.249563787060059 2.4226992390177 1.39925464659567 -1.03348528621078 -0.423052835345844 -0.0265859937221338 0.714549475942451 -0.710519578157083 -0.115323938045860 0.380731721044716 0.708963711073897 -0.818110319351635 0.515712288486497 -0.802699319203642 0.53618244912201 0.0238754293249462 2.62075280519171 -0.530308955735563 -0.294977472941513 -0.191106758709172 1.44266219272649 -0.48046077408225 -1.49218243984991 -2.53942982410377 1.54438392279863 0.739539272524873 -0.432029458219295 0.110389472473488 -0.701201290207867 -1.74849762672008 -0.0321002245596177 -1.06353338755759 1.23188169790633 1.39463695474220 1.38735869910880 1.60024856351166 0.692198277620771 -1.12431108123450 1.49483769964920 -1.38899632353557 -2.37851789483528 -1.82424414875403 -1.18670004479104 -1.30915227107192 0.461873430367167 -1.29898842460766 0.671861058723181 -1.02583650280334 -0.60931111807385 1.62336590876663 0.798885491575253 -0.276465780085589 0.752519284264561 -1.01172770016512 -1.57784166898402 -1.35146126389908 -1.23550987012864 -0.771115153350047 -1.22770515805315 0.315399075036155 -0.315725922796651 0.854867404691286 0.236525365446285 0.113856697289855 -0.818300618411826 -0.93883587175243 -0.0476175777833587 -0.513182781181628 1.19722023201795 -0.161747911227709 2.11475055605253 -0.7736503952587 0.520710693189433 0.670074138247554 0.0995065483498586 -0.547229894463126 -0.273975626599914 -1.47164546913961 -0.428486963484372 0.413272013207556 0.637837188949964 2.03554606905616 1.41166020912930 2.49480090734848 | |
Tables (Output of Computation) | |
> first_number = 5
> second_number = 7
> strpar = 'hello'
> {
+ myfun <- function(x, y) {
+ x + y
+ }
+
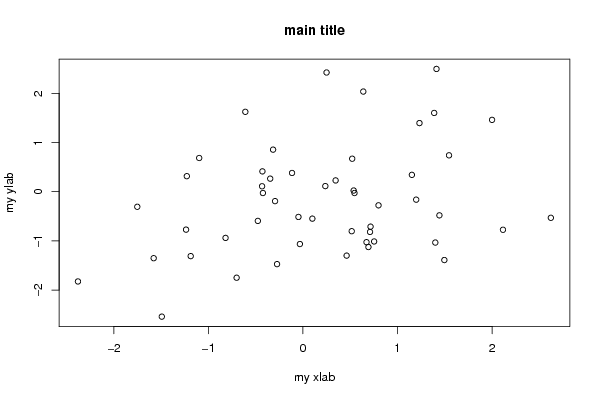
+ plot(RCx, main = 'main title', xlab = 'my xlab', ylab = 'my ylab')
+ .... [TRUNCATED]
[1] 12
| |
Figures (Output of Computation) | |
Input Parameters & R Code | |
| Parameters (Session): | |
| par1 = 5 ; par2 = 7 ; par3 = hello ; | |
| Parameters (R input): | |
| R code (body of R function): | |
{ | |