Free Statistics

of Irreproducible Research!

Author's title

Author*Unverified author*
R Software Modulerwasp_arimaforecasting.wasp
Title produced by softwareARIMA Forecasting
Date of computationTue, 16 Dec 2008 05:43:39 -0700
Cite this page as followsStatistical Computations at FreeStatistics.org, Office for Research Development and Education, URL https://freestatistics.org/blog/index.php?v=date/2008/Dec/16/t1229431453oaln1ydw05zkeas.htm/, Retrieved Wed, 15 May 2024 04:18:31 +0000
Statistical Computations at FreeStatistics.org, Office for Research Development and Education, URL https://freestatistics.org/blog/index.php?pk=33935, Retrieved Wed, 15 May 2024 04:18:31 +0000
QR Codes:

Original text written by user:
IsPrivate?No (this computation is public)
User-defined keywords
Estimated Impact182
Family? (F = Feedback message, R = changed R code, M = changed R Module, P = changed Parameters, D = changed Data)
-     [ARIMA Forecasting] [Forecasting] [2008-12-16 12:23:48] [8ac58ef7b35dc5a117bc162cf16850e9]
F         [ARIMA Forecasting] [arimaforecasting] [2008-12-16 12:43:39] [acca1d0ee7cc95ffc080d0867a313954] [Current]
Feedback Forum
2008-12-24 09:48:19 [Bénédicte Soens] [reply
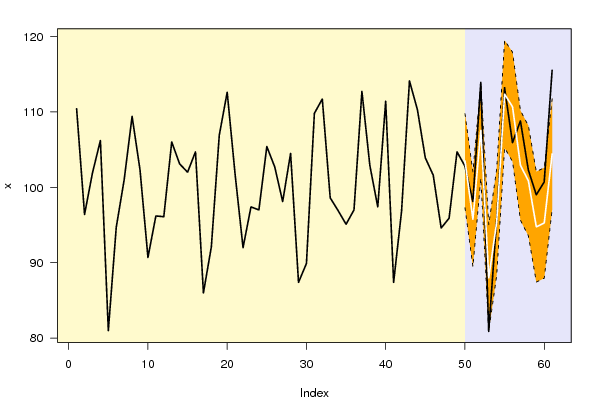
In de eerste kolom is de tijdsindex te vinden. Er zijn eerst 49maanden die voor de voorspelling komen. Vervolgens zijn de waarden van de maanden 50 t.e.m. 61 weggelaten bij de berekening. Dit is doordat we deze voorspellen. In kolom F(t) wordt er berekent welke de meest waardige uitkomst is (er wordt gekeken naar hoe ver de 2 van elkaar liggen). In de 4de en 5de kolom is dan weer de voorspelling van de lower en upper bound te vinden. Dit geeft dan ook weer waartussen het 95% betrouwbaarheidsinterval ligt. In de 6de is de p-waarde te vinden. Hieruit kan men afleiden of het verschil tussen Y(t) en F(t) significant is. Indien niet significant dan is het goed. Als er wel een significante afwijking is dan kan dit te wijten zijn aan een dummy (vb: een promotieactie). Vervolgens wordt de waarschijnlijkheid weergegeven dat aantoont dat er een stijging is t.o.v. de vorige maand. Terwijl er in kolom 8 een waarschijnlijkheid is dat de waarde groter is dan exact 1 jaar geleden (12m). In de 9de wordt dan de waarschijnlijkheid aangetoond dat de waarde groter is dan de laatst gekende maand (hier: maand 49).
2008-12-24 09:51:35 [Bénédicte Soens] [reply
Bij step 1 kan ik nog toevoegen dat er ook mag gekeken worden naar de 2de tabel. Van deze tabel worden er maar 2 kolommen gebruikt.Ook hier wordt er gekeken naar de maanden 50 t.e.m. 61 die voorspelt moeten worden. De 2de kolom geeft de procentuele standaardfout weer, deze is berekent op basis van een model (een theoretische schatting). De 3de kolom toont de werkelijke fout (ook procentueel gezien).
2008-12-24 09:54:53 [Bénédicte Soens] [reply
STEP 2:
Het antwoord van de student was vrij goed, maar niet volledig.
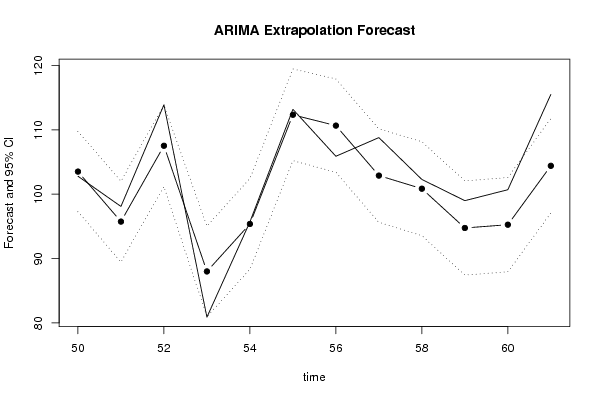
Het witte/paarse gedeelde is het deel dat voorspeld wordt. We moeten dus in het witte/paarse deel kijken voor deze stap. Het is mogelijk dat er een afwijking is t.o.v. de voorgaande maanden, maar dit is hier niet het geval, de rechte blijft verder lopen zoals het de maanden ervoor al ging. Er is dus geen opvallende afwijking op te merken. Het is wel duidelijk dat er seizoenaliteit aanwezig is, maar dit was de voorgaande maanden ook het geval. De stippenlijnen hier tonen ook het 95% betrouwbaarheidsinterval, deze lijn valt hier dus ook volledig binnen. Om nog een duidelijker inzicht te krijgen, kunnen we hier kijken naar de 2de voorstelling, deze geeft enkel de voorspelde maanden weer.
2008-12-24 09:59:01 [Bénédicte Soens] [reply
STEP 3:
De standaaard fout geeft de fout weer dat kan voorkomen in normale omstandigheden, de verwachte fout ( als er vb. geen aanslagen zijn, geen regering die valt). Als we kijken naar de tabel (2) van de standaardfout kunnen we inderdaad opmerken dat deze vrij laag is, wat ook goed is. Daaruit kunnen we dan vaststellen dat we hier de 12maanden mogen voorspellen.
2008-12-24 11:33:35 [Steven Vanhooreweghe] [reply
Step 1: klopt wat je zegt. Wat je nog had kunnen zeggen was dat de waardes in de kolom P(F[t]>Y[t-1]) klein zijn. Dit wijst op de afwezigheid van een lange termijn trend.

Step 2: dit is juist in volgens mij ook voldoende uitleg.

Step 3: % S.E betekent de theoretische schatting van de standaardfout op basis van het model. In kolom PE vinden we de werkelijke fout terug. De waardes in kolom PE mogen een klein beetje hoger zijn en dat is hier meestal het geval. Je kan dus spreken van een goed model
Step 4&5: niet opgelost

Post a new message
Dataseries X:
110.40
96.40
101.90
106.20
81.00
94.70
101.00
109.40
102.30
90.70
96.20
96.10
106.00
103.10
102.00
104.70
86.00
92.10
106.90
112.60
101.70
92.00
97.40
97.00
105.40
102.70
98.10
104.50
87.40
89.90
109.80
111.70
98.60
96.90
95.10
97.00
112.70
102.90
97.40
111.40
87.40
96.80
114.10
110.30
103.90
101.60
94.60
95.90
104.70
102.80
98.10
113.90
80.90
95.70
113.20
105.90
108.80
102.30
99.00
100.70
115.50


Summary of computational transaction
Raw Inputview raw input (R code)
Raw Outputview raw output of R engine
Computing time2 seconds
R Server'George Udny Yule' @ 72.249.76.132

\begin{tabular}{lllllllll}
\hline
Summary of computational transaction \tabularnewline
Raw Input & view raw input (R code)  \tabularnewline
Raw Output & view raw output of R engine  \tabularnewline
Computing time & 2 seconds \tabularnewline
R Server & 'George Udny Yule' @ 72.249.76.132 \tabularnewline
\hline
\end{tabular}
%Source: https://freestatistics.org/blog/index.php?pk=33935&T=0

[TABLE]
[ROW][C]Summary of computational transaction[/C][/ROW]
[ROW][C]Raw Input[/C][C]view raw input (R code) [/C][/ROW]
[ROW][C]Raw Output[/C][C]view raw output of R engine [/C][/ROW]
[ROW][C]Computing time[/C][C]2 seconds[/C][/ROW]
[ROW][C]R Server[/C][C]'George Udny Yule' @ 72.249.76.132[/C][/ROW]
[/TABLE]
Source: https://freestatistics.org/blog/index.php?pk=33935&T=0

Globally Unique Identifier (entire table): ba.freestatistics.org/blog/index.php?pk=33935&T=0

As an alternative you can also use a QR Code:  

The GUIDs for individual cells are displayed in the table below:

Summary of computational transaction
Raw Inputview raw input (R code)
Raw Outputview raw output of R engine
Computing time2 seconds
R Server'George Udny Yule' @ 72.249.76.132


Univariate ARIMA Extrapolation Forecast
timeY[t]F[t]95% LB95% UBp-value(H0: Y[t] = F[t])P(F[t]>Y[t-1])P(F[t]>Y[t-s])P(F[t]>Y[49])
37112.7-------
38102.9-------
3997.4-------
40111.4-------
4187.4-------
4296.8-------
43114.1-------
44110.3-------
45103.9-------
46101.6-------
4794.6-------
4895.9-------
49104.7-------
50102.8103.51897.2873109.74860.41070.3550.57710.355
5198.195.749389.4687102.02990.23160.01390.30320.0026
52113.9107.5305101.1886113.87240.02450.99820.11590.8092
5380.988.005780.978695.03270.023700.56710
5495.795.381588.3211102.44190.464810.34690.0048
55113.2112.3454105.225119.46580.40710.31460.9823
56105.9110.6599103.409117.91080.09910.24620.53870.9464
57108.8102.897995.6351110.16060.05560.20890.39340.3134
58102.3100.860793.5639108.15740.34950.01650.42130.1512
599994.755587.4365102.07440.12780.02170.51660.0039
60100.795.267187.9454102.58880.07290.15880.43270.0058
61115.5104.415697.0794111.75190.00150.83960.46970.4697

\begin{tabular}{lllllllll}
\hline
Univariate ARIMA Extrapolation Forecast \tabularnewline
time & Y[t] & F[t] & 95% LB & 95% UB & p-value(H0: Y[t] = F[t]) & P(F[t]>Y[t-1]) & P(F[t]>Y[t-s]) & P(F[t]>Y[49]) \tabularnewline
37 & 112.7 & - & - & - & - & - & - & - \tabularnewline
38 & 102.9 & - & - & - & - & - & - & - \tabularnewline
39 & 97.4 & - & - & - & - & - & - & - \tabularnewline
40 & 111.4 & - & - & - & - & - & - & - \tabularnewline
41 & 87.4 & - & - & - & - & - & - & - \tabularnewline
42 & 96.8 & - & - & - & - & - & - & - \tabularnewline
43 & 114.1 & - & - & - & - & - & - & - \tabularnewline
44 & 110.3 & - & - & - & - & - & - & - \tabularnewline
45 & 103.9 & - & - & - & - & - & - & - \tabularnewline
46 & 101.6 & - & - & - & - & - & - & - \tabularnewline
47 & 94.6 & - & - & - & - & - & - & - \tabularnewline
48 & 95.9 & - & - & - & - & - & - & - \tabularnewline
49 & 104.7 & - & - & - & - & - & - & - \tabularnewline
50 & 102.8 & 103.518 & 97.2873 & 109.7486 & 0.4107 & 0.355 & 0.5771 & 0.355 \tabularnewline
51 & 98.1 & 95.7493 & 89.4687 & 102.0299 & 0.2316 & 0.0139 & 0.3032 & 0.0026 \tabularnewline
52 & 113.9 & 107.5305 & 101.1886 & 113.8724 & 0.0245 & 0.9982 & 0.1159 & 0.8092 \tabularnewline
53 & 80.9 & 88.0057 & 80.9786 & 95.0327 & 0.0237 & 0 & 0.5671 & 0 \tabularnewline
54 & 95.7 & 95.3815 & 88.3211 & 102.4419 & 0.4648 & 1 & 0.3469 & 0.0048 \tabularnewline
55 & 113.2 & 112.3454 & 105.225 & 119.4658 & 0.407 & 1 & 0.3146 & 0.9823 \tabularnewline
56 & 105.9 & 110.6599 & 103.409 & 117.9108 & 0.0991 & 0.2462 & 0.5387 & 0.9464 \tabularnewline
57 & 108.8 & 102.8979 & 95.6351 & 110.1606 & 0.0556 & 0.2089 & 0.3934 & 0.3134 \tabularnewline
58 & 102.3 & 100.8607 & 93.5639 & 108.1574 & 0.3495 & 0.0165 & 0.4213 & 0.1512 \tabularnewline
59 & 99 & 94.7555 & 87.4365 & 102.0744 & 0.1278 & 0.0217 & 0.5166 & 0.0039 \tabularnewline
60 & 100.7 & 95.2671 & 87.9454 & 102.5888 & 0.0729 & 0.1588 & 0.4327 & 0.0058 \tabularnewline
61 & 115.5 & 104.4156 & 97.0794 & 111.7519 & 0.0015 & 0.8396 & 0.4697 & 0.4697 \tabularnewline
\hline
\end{tabular}
%Source: https://freestatistics.org/blog/index.php?pk=33935&T=1

[TABLE]
[ROW][C]Univariate ARIMA Extrapolation Forecast[/C][/ROW]
[ROW][C]time[/C][C]Y[t][/C][C]F[t][/C][C]95% LB[/C][C]95% UB[/C][C]p-value(H0: Y[t] = F[t])[/C][C]P(F[t]>Y[t-1])[/C][C]P(F[t]>Y[t-s])[/C][C]P(F[t]>Y[49])[/C][/ROW]
[ROW][C]37[/C][C]112.7[/C][C]-[/C][C]-[/C][C]-[/C][C]-[/C][C]-[/C][C]-[/C][C]-[/C][/ROW]
[ROW][C]38[/C][C]102.9[/C][C]-[/C][C]-[/C][C]-[/C][C]-[/C][C]-[/C][C]-[/C][C]-[/C][/ROW]
[ROW][C]39[/C][C]97.4[/C][C]-[/C][C]-[/C][C]-[/C][C]-[/C][C]-[/C][C]-[/C][C]-[/C][/ROW]
[ROW][C]40[/C][C]111.4[/C][C]-[/C][C]-[/C][C]-[/C][C]-[/C][C]-[/C][C]-[/C][C]-[/C][/ROW]
[ROW][C]41[/C][C]87.4[/C][C]-[/C][C]-[/C][C]-[/C][C]-[/C][C]-[/C][C]-[/C][C]-[/C][/ROW]
[ROW][C]42[/C][C]96.8[/C][C]-[/C][C]-[/C][C]-[/C][C]-[/C][C]-[/C][C]-[/C][C]-[/C][/ROW]
[ROW][C]43[/C][C]114.1[/C][C]-[/C][C]-[/C][C]-[/C][C]-[/C][C]-[/C][C]-[/C][C]-[/C][/ROW]
[ROW][C]44[/C][C]110.3[/C][C]-[/C][C]-[/C][C]-[/C][C]-[/C][C]-[/C][C]-[/C][C]-[/C][/ROW]
[ROW][C]45[/C][C]103.9[/C][C]-[/C][C]-[/C][C]-[/C][C]-[/C][C]-[/C][C]-[/C][C]-[/C][/ROW]
[ROW][C]46[/C][C]101.6[/C][C]-[/C][C]-[/C][C]-[/C][C]-[/C][C]-[/C][C]-[/C][C]-[/C][/ROW]
[ROW][C]47[/C][C]94.6[/C][C]-[/C][C]-[/C][C]-[/C][C]-[/C][C]-[/C][C]-[/C][C]-[/C][/ROW]
[ROW][C]48[/C][C]95.9[/C][C]-[/C][C]-[/C][C]-[/C][C]-[/C][C]-[/C][C]-[/C][C]-[/C][/ROW]
[ROW][C]49[/C][C]104.7[/C][C]-[/C][C]-[/C][C]-[/C][C]-[/C][C]-[/C][C]-[/C][C]-[/C][/ROW]
[ROW][C]50[/C][C]102.8[/C][C]103.518[/C][C]97.2873[/C][C]109.7486[/C][C]0.4107[/C][C]0.355[/C][C]0.5771[/C][C]0.355[/C][/ROW]
[ROW][C]51[/C][C]98.1[/C][C]95.7493[/C][C]89.4687[/C][C]102.0299[/C][C]0.2316[/C][C]0.0139[/C][C]0.3032[/C][C]0.0026[/C][/ROW]
[ROW][C]52[/C][C]113.9[/C][C]107.5305[/C][C]101.1886[/C][C]113.8724[/C][C]0.0245[/C][C]0.9982[/C][C]0.1159[/C][C]0.8092[/C][/ROW]
[ROW][C]53[/C][C]80.9[/C][C]88.0057[/C][C]80.9786[/C][C]95.0327[/C][C]0.0237[/C][C]0[/C][C]0.5671[/C][C]0[/C][/ROW]
[ROW][C]54[/C][C]95.7[/C][C]95.3815[/C][C]88.3211[/C][C]102.4419[/C][C]0.4648[/C][C]1[/C][C]0.3469[/C][C]0.0048[/C][/ROW]
[ROW][C]55[/C][C]113.2[/C][C]112.3454[/C][C]105.225[/C][C]119.4658[/C][C]0.407[/C][C]1[/C][C]0.3146[/C][C]0.9823[/C][/ROW]
[ROW][C]56[/C][C]105.9[/C][C]110.6599[/C][C]103.409[/C][C]117.9108[/C][C]0.0991[/C][C]0.2462[/C][C]0.5387[/C][C]0.9464[/C][/ROW]
[ROW][C]57[/C][C]108.8[/C][C]102.8979[/C][C]95.6351[/C][C]110.1606[/C][C]0.0556[/C][C]0.2089[/C][C]0.3934[/C][C]0.3134[/C][/ROW]
[ROW][C]58[/C][C]102.3[/C][C]100.8607[/C][C]93.5639[/C][C]108.1574[/C][C]0.3495[/C][C]0.0165[/C][C]0.4213[/C][C]0.1512[/C][/ROW]
[ROW][C]59[/C][C]99[/C][C]94.7555[/C][C]87.4365[/C][C]102.0744[/C][C]0.1278[/C][C]0.0217[/C][C]0.5166[/C][C]0.0039[/C][/ROW]
[ROW][C]60[/C][C]100.7[/C][C]95.2671[/C][C]87.9454[/C][C]102.5888[/C][C]0.0729[/C][C]0.1588[/C][C]0.4327[/C][C]0.0058[/C][/ROW]
[ROW][C]61[/C][C]115.5[/C][C]104.4156[/C][C]97.0794[/C][C]111.7519[/C][C]0.0015[/C][C]0.8396[/C][C]0.4697[/C][C]0.4697[/C][/ROW]
[/TABLE]
Source: https://freestatistics.org/blog/index.php?pk=33935&T=1

Globally Unique Identifier (entire table): ba.freestatistics.org/blog/index.php?pk=33935&T=1

As an alternative you can also use a QR Code:  

The GUIDs for individual cells are displayed in the table below:

Univariate ARIMA Extrapolation Forecast
timeY[t]F[t]95% LB95% UBp-value(H0: Y[t] = F[t])P(F[t]>Y[t-1])P(F[t]>Y[t-s])P(F[t]>Y[49])
37112.7-------
38102.9-------
3997.4-------
40111.4-------
4187.4-------
4296.8-------
43114.1-------
44110.3-------
45103.9-------
46101.6-------
4794.6-------
4895.9-------
49104.7-------
50102.8103.51897.2873109.74860.41070.3550.57710.355
5198.195.749389.4687102.02990.23160.01390.30320.0026
52113.9107.5305101.1886113.87240.02450.99820.11590.8092
5380.988.005780.978695.03270.023700.56710
5495.795.381588.3211102.44190.464810.34690.0048
55113.2112.3454105.225119.46580.40710.31460.9823
56105.9110.6599103.409117.91080.09910.24620.53870.9464
57108.8102.897995.6351110.16060.05560.20890.39340.3134
58102.3100.860793.5639108.15740.34950.01650.42130.1512
599994.755587.4365102.07440.12780.02170.51660.0039
60100.795.267187.9454102.58880.07290.15880.43270.0058
61115.5104.415697.0794111.75190.00150.83960.46970.4697


Univariate ARIMA Extrapolation Forecast Performance
time% S.E.PEMAPESq.EMSERMSE
500.0307-0.00696e-040.51550.0430.2073
510.03350.02460.0025.52570.46050.6786
520.03010.05920.004940.57063.38091.8387
530.0407-0.08070.006750.49044.20752.0512
540.03780.00333e-040.10150.00850.092
550.03230.00766e-040.73030.06090.2467
560.0334-0.0430.003622.65661.8881.3741
570.0360.05740.004834.83532.90291.7038
580.03690.01430.00122.07170.17260.4155
590.03940.04480.003718.01621.50141.2253
600.03920.0570.004829.51612.45971.5683
610.03580.10620.0088122.862810.23863.1998

\begin{tabular}{lllllllll}
\hline
Univariate ARIMA Extrapolation Forecast Performance \tabularnewline
time & % S.E. & PE & MAPE & Sq.E & MSE & RMSE \tabularnewline
50 & 0.0307 & -0.0069 & 6e-04 & 0.5155 & 0.043 & 0.2073 \tabularnewline
51 & 0.0335 & 0.0246 & 0.002 & 5.5257 & 0.4605 & 0.6786 \tabularnewline
52 & 0.0301 & 0.0592 & 0.0049 & 40.5706 & 3.3809 & 1.8387 \tabularnewline
53 & 0.0407 & -0.0807 & 0.0067 & 50.4904 & 4.2075 & 2.0512 \tabularnewline
54 & 0.0378 & 0.0033 & 3e-04 & 0.1015 & 0.0085 & 0.092 \tabularnewline
55 & 0.0323 & 0.0076 & 6e-04 & 0.7303 & 0.0609 & 0.2467 \tabularnewline
56 & 0.0334 & -0.043 & 0.0036 & 22.6566 & 1.888 & 1.3741 \tabularnewline
57 & 0.036 & 0.0574 & 0.0048 & 34.8353 & 2.9029 & 1.7038 \tabularnewline
58 & 0.0369 & 0.0143 & 0.0012 & 2.0717 & 0.1726 & 0.4155 \tabularnewline
59 & 0.0394 & 0.0448 & 0.0037 & 18.0162 & 1.5014 & 1.2253 \tabularnewline
60 & 0.0392 & 0.057 & 0.0048 & 29.5161 & 2.4597 & 1.5683 \tabularnewline
61 & 0.0358 & 0.1062 & 0.0088 & 122.8628 & 10.2386 & 3.1998 \tabularnewline
\hline
\end{tabular}
%Source: https://freestatistics.org/blog/index.php?pk=33935&T=2

[TABLE]
[ROW][C]Univariate ARIMA Extrapolation Forecast Performance[/C][/ROW]
[ROW][C]time[/C][C]% S.E.[/C][C]PE[/C][C]MAPE[/C][C]Sq.E[/C][C]MSE[/C][C]RMSE[/C][/ROW]
[ROW][C]50[/C][C]0.0307[/C][C]-0.0069[/C][C]6e-04[/C][C]0.5155[/C][C]0.043[/C][C]0.2073[/C][/ROW]
[ROW][C]51[/C][C]0.0335[/C][C]0.0246[/C][C]0.002[/C][C]5.5257[/C][C]0.4605[/C][C]0.6786[/C][/ROW]
[ROW][C]52[/C][C]0.0301[/C][C]0.0592[/C][C]0.0049[/C][C]40.5706[/C][C]3.3809[/C][C]1.8387[/C][/ROW]
[ROW][C]53[/C][C]0.0407[/C][C]-0.0807[/C][C]0.0067[/C][C]50.4904[/C][C]4.2075[/C][C]2.0512[/C][/ROW]
[ROW][C]54[/C][C]0.0378[/C][C]0.0033[/C][C]3e-04[/C][C]0.1015[/C][C]0.0085[/C][C]0.092[/C][/ROW]
[ROW][C]55[/C][C]0.0323[/C][C]0.0076[/C][C]6e-04[/C][C]0.7303[/C][C]0.0609[/C][C]0.2467[/C][/ROW]
[ROW][C]56[/C][C]0.0334[/C][C]-0.043[/C][C]0.0036[/C][C]22.6566[/C][C]1.888[/C][C]1.3741[/C][/ROW]
[ROW][C]57[/C][C]0.036[/C][C]0.0574[/C][C]0.0048[/C][C]34.8353[/C][C]2.9029[/C][C]1.7038[/C][/ROW]
[ROW][C]58[/C][C]0.0369[/C][C]0.0143[/C][C]0.0012[/C][C]2.0717[/C][C]0.1726[/C][C]0.4155[/C][/ROW]
[ROW][C]59[/C][C]0.0394[/C][C]0.0448[/C][C]0.0037[/C][C]18.0162[/C][C]1.5014[/C][C]1.2253[/C][/ROW]
[ROW][C]60[/C][C]0.0392[/C][C]0.057[/C][C]0.0048[/C][C]29.5161[/C][C]2.4597[/C][C]1.5683[/C][/ROW]
[ROW][C]61[/C][C]0.0358[/C][C]0.1062[/C][C]0.0088[/C][C]122.8628[/C][C]10.2386[/C][C]3.1998[/C][/ROW]
[/TABLE]
Source: https://freestatistics.org/blog/index.php?pk=33935&T=2

Globally Unique Identifier (entire table): ba.freestatistics.org/blog/index.php?pk=33935&T=2

As an alternative you can also use a QR Code:  

The GUIDs for individual cells are displayed in the table below:

Univariate ARIMA Extrapolation Forecast Performance
time% S.E.PEMAPESq.EMSERMSE
500.0307-0.00696e-040.51550.0430.2073
510.03350.02460.0025.52570.46050.6786
520.03010.05920.004940.57063.38091.8387
530.0407-0.08070.006750.49044.20752.0512
540.03780.00333e-040.10150.00850.092
550.03230.00766e-040.73030.06090.2467
560.0334-0.0430.003622.65661.8881.3741
570.0360.05740.004834.83532.90291.7038
580.03690.01430.00122.07170.17260.4155
590.03940.04480.003718.01621.50141.2253
600.03920.0570.004829.51612.45971.5683
610.03580.10620.0088122.862810.23863.1998


Parameters (Session):
par1 = 12 ; par2 = 1 ; par3 = 0 ; par4 = 1 ; par5 = 12 ; par6 = 3 ; par7 = 0 ; par8 = 0 ; par9 = 0 ; par10 = FALSE ;
Parameters (R input):
par1 = 12 ; par2 = 1 ; par3 = 0 ; par4 = 1 ; par5 = 12 ; par6 = 3 ; par7 = 0 ; par8 = 0 ; par9 = 0 ; par10 = FALSE ;
R code (references can be found in the software module):
par1 <- as.numeric(par1) #cut off periods
par2 <- as.numeric(par2) #lambda
par3 <- as.numeric(par3) #degree of non-seasonal differencing
par4 <- as.numeric(par4) #degree of seasonal differencing
par5 <- as.numeric(par5) #seasonal period
par6 <- as.numeric(par6) #p
par7 <- as.numeric(par7) #q
par8 <- as.numeric(par8) #P
par9 <- as.numeric(par9) #Q
if (par10 == 'TRUE') par10 <- TRUE
if (par10 == 'FALSE') par10 <- FALSE
if (par2 == 0) x <- log(x)
if (par2 != 0) x <- x^par2
lx <- length(x)
first <- lx - 2*par1
nx <- lx - par1
nx1 <- nx + 1
fx <- lx - nx
if (fx < 1) {
fx <- par5
nx1 <- lx + fx - 1
first <- lx - 2*fx
}
first <- 1
if (fx < 3) fx <- round(lx/10,0)
(arima.out <- arima(x[1:nx], order=c(par6,par3,par7), seasonal=list(order=c(par8,par4,par9), period=par5), include.mean=par10, method='ML'))
(forecast <- predict(arima.out,fx))
(lb <- forecast$pred - 1.96 * forecast$se)
(ub <- forecast$pred + 1.96 * forecast$se)
if (par2 == 0) {
x <- exp(x)
forecast$pred <- exp(forecast$pred)
lb <- exp(lb)
ub <- exp(ub)
}
if (par2 != 0) {
x <- x^(1/par2)
forecast$pred <- forecast$pred^(1/par2)
lb <- lb^(1/par2)
ub <- ub^(1/par2)
}
if (par2 < 0) {
olb <- lb
lb <- ub
ub <- olb
}
(actandfor <- c(x[1:nx], forecast$pred))
(perc.se <- (ub-forecast$pred)/1.96/forecast$pred)
bitmap(file='test1.png')
opar <- par(mar=c(4,4,2,2),las=1)
ylim <- c( min(x[first:nx],lb), max(x[first:nx],ub))
plot(x,ylim=ylim,type='n',xlim=c(first,lx))
usr <- par('usr')
rect(usr[1],usr[3],nx+1,usr[4],border=NA,col='lemonchiffon')
rect(nx1,usr[3],usr[2],usr[4],border=NA,col='lavender')
abline(h= (-3:3)*2 , col ='gray', lty =3)
polygon( c(nx1:lx,lx:nx1), c(lb,rev(ub)), col = 'orange', lty=2,border=NA)
lines(nx1:lx, lb , lty=2)
lines(nx1:lx, ub , lty=2)
lines(x, lwd=2)
lines(nx1:lx, forecast$pred , lwd=2 , col ='white')
box()
par(opar)
dev.off()
prob.dec <- array(NA, dim=fx)
prob.sdec <- array(NA, dim=fx)
prob.ldec <- array(NA, dim=fx)
prob.pval <- array(NA, dim=fx)
perf.pe <- array(0, dim=fx)
perf.mape <- array(0, dim=fx)
perf.se <- array(0, dim=fx)
perf.mse <- array(0, dim=fx)
perf.rmse <- array(0, dim=fx)
for (i in 1:fx) {
locSD <- (ub[i] - forecast$pred[i]) / 1.96
perf.pe[i] = (x[nx+i] - forecast$pred[i]) / forecast$pred[i]
perf.mape[i] = perf.mape[i] + abs(perf.pe[i])
perf.se[i] = (x[nx+i] - forecast$pred[i])^2
perf.mse[i] = perf.mse[i] + perf.se[i]
prob.dec[i] = pnorm((x[nx+i-1] - forecast$pred[i]) / locSD)
prob.sdec[i] = pnorm((x[nx+i-par5] - forecast$pred[i]) / locSD)
prob.ldec[i] = pnorm((x[nx] - forecast$pred[i]) / locSD)
prob.pval[i] = pnorm(abs(x[nx+i] - forecast$pred[i]) / locSD)
}
perf.mape = perf.mape / fx
perf.mse = perf.mse / fx
perf.rmse = sqrt(perf.mse)
bitmap(file='test2.png')
plot(forecast$pred, pch=19, type='b',main='ARIMA Extrapolation Forecast', ylab='Forecast and 95% CI', xlab='time',ylim=c(min(lb),max(ub)))
dum <- forecast$pred
dum[1:12] <- x[(nx+1):lx]
lines(dum, lty=1)
lines(ub,lty=3)
lines(lb,lty=3)
dev.off()
load(file='createtable')
a<-table.start()
a<-table.row.start(a)
a<-table.element(a,'Univariate ARIMA Extrapolation Forecast',9,TRUE)
a<-table.row.end(a)
a<-table.row.start(a)
a<-table.element(a,'time',1,header=TRUE)
a<-table.element(a,'Y[t]',1,header=TRUE)
a<-table.element(a,'F[t]',1,header=TRUE)
a<-table.element(a,'95% LB',1,header=TRUE)
a<-table.element(a,'95% UB',1,header=TRUE)
a<-table.element(a,'p-value
(H0: Y[t] = F[t])',1,header=TRUE)
a<-table.element(a,'P(F[t]>Y[t-1])',1,header=TRUE)
a<-table.element(a,'P(F[t]>Y[t-s])',1,header=TRUE)
mylab <- paste('P(F[t]>Y[',nx,sep='')
mylab <- paste(mylab,'])',sep='')
a<-table.element(a,mylab,1,header=TRUE)
a<-table.row.end(a)
for (i in (nx-par5):nx) {
a<-table.row.start(a)
a<-table.element(a,i,header=TRUE)
a<-table.element(a,x[i])
a<-table.element(a,'-')
a<-table.row.end(a)
}
for (i in 1:fx) {
a<-table.row.start(a)
a<-table.element(a,nx+i,header=TRUE)
a<-table.element(a,round(x[nx+i],4))
a<-table.element(a,round(forecast$pred[i],4))
a<-table.element(a,round(lb[i],4))
a<-table.element(a,round(ub[i],4))
a<-table.element(a,round((1-prob.pval[i]),4))
a<-table.element(a,round((1-prob.dec[i]),4))
a<-table.element(a,round((1-prob.sdec[i]),4))
a<-table.element(a,round((1-prob.ldec[i]),4))
a<-table.row.end(a)
}
a<-table.end(a)
table.save(a,file='mytable.tab')
a<-table.start()
a<-table.row.start(a)
a<-table.element(a,'Univariate ARIMA Extrapolation Forecast Performance',7,TRUE)
a<-table.row.end(a)
a<-table.row.start(a)
a<-table.element(a,'time',1,header=TRUE)
a<-table.element(a,'% S.E.',1,header=TRUE)
a<-table.element(a,'PE',1,header=TRUE)
a<-table.element(a,'MAPE',1,header=TRUE)
a<-table.element(a,'Sq.E',1,header=TRUE)
a<-table.element(a,'MSE',1,header=TRUE)
a<-table.element(a,'RMSE',1,header=TRUE)
a<-table.row.end(a)
for (i in 1:fx) {
a<-table.row.start(a)
a<-table.element(a,nx+i,header=TRUE)
a<-table.element(a,round(perc.se[i],4))
a<-table.element(a,round(perf.pe[i],4))
a<-table.element(a,round(perf.mape[i],4))
a<-table.element(a,round(perf.se[i],4))
a<-table.element(a,round(perf.mse[i],4))
a<-table.element(a,round(perf.rmse[i],4))
a<-table.row.end(a)
}
a<-table.end(a)
table.save(a,file='mytable1.tab')