Free Statistics

of Irreproducible Research!

Author's title

Author*The author of this computation has been verified*
R Software Modulerwasp_autocorrelation.wasp
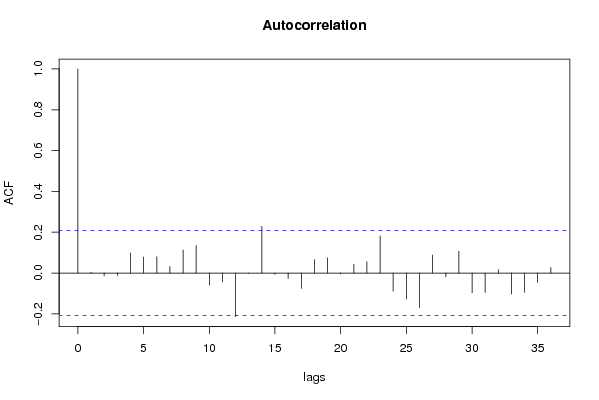
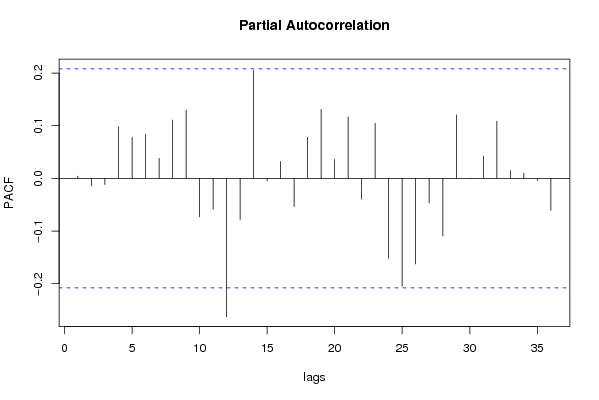
Title produced by software(Partial) Autocorrelation Function
Date of computationTue, 16 Dec 2008 04:38:28 -0700
Cite this page as followsStatistical Computations at FreeStatistics.org, Office for Research Development and Education, URL https://freestatistics.org/blog/index.php?v=date/2008/Dec/16/t1229427581pjv9bfy8ojfirnj.htm/, Retrieved Wed, 15 May 2024 18:03:25 +0000
Statistical Computations at FreeStatistics.org, Office for Research Development and Education, URL https://freestatistics.org/blog/index.php?pk=33917, Retrieved Wed, 15 May 2024 18:03:25 +0000
QR Codes:

Original text written by user:
IsPrivate?No (this computation is public)
User-defined keywords
Estimated Impact240
Family? (F = Feedback message, R = changed R code, M = changed R Module, P = changed Parameters, D = changed Data)
F     [Univariate Data Series] [Airline data] [2007-10-18 09:58:47] [42daae401fd3def69a25014f2252b4c2]
F RMPD  [Standard Deviation-Mean Plot] [vraag 5] [2008-11-29 13:37:39] [c45c87b96bbf32ffc2144fc37d767b2e]
- RMPD    [(Partial) Autocorrelation Function] [ACF] [2008-12-12 14:04:37] [c45c87b96bbf32ffc2144fc37d767b2e]
-   P         [(Partial) Autocorrelation Function] [ACF] [2008-12-16 11:38:28] [3dc594a6c62226e1e98766c4d385bfaa] [Current]
-    D          [(Partial) Autocorrelation Function] [acf] [2008-12-16 22:59:25] [c45c87b96bbf32ffc2144fc37d767b2e]
Feedback Forum

Post a new message
Dataseries X:
493
481
462
457
442
439
488
521
501
485
464
460
467
460
448
443
436
431
484
510
513
503
471
471
476
475
470
461
455
456
517
525
523
519
509
512
519
517
510
509
501
507
569
580
578
565
547
555
562
561
555
544
537
543
594
611
613
611
594
595
591
589
584
573
567
569
621
629
628
612
595
597
593
590
580
574
573
573
620
626
620
588
566
557
561
549
532
526
511
499
555
565
542
527
510
514
517
508
493
490
469
478


Summary of computational transaction
Raw Inputview raw input (R code)
Raw Outputview raw output of R engine
Computing time1 seconds
R Server'Gwilym Jenkins' @ 72.249.127.135

\begin{tabular}{lllllllll}
\hline
Summary of computational transaction \tabularnewline
Raw Input & view raw input (R code)  \tabularnewline
Raw Output & view raw output of R engine  \tabularnewline
Computing time & 1 seconds \tabularnewline
R Server & 'Gwilym Jenkins' @ 72.249.127.135 \tabularnewline
\hline
\end{tabular}
%Source: https://freestatistics.org/blog/index.php?pk=33917&T=0

[TABLE]
[ROW][C]Summary of computational transaction[/C][/ROW]
[ROW][C]Raw Input[/C][C]view raw input (R code) [/C][/ROW]
[ROW][C]Raw Output[/C][C]view raw output of R engine [/C][/ROW]
[ROW][C]Computing time[/C][C]1 seconds[/C][/ROW]
[ROW][C]R Server[/C][C]'Gwilym Jenkins' @ 72.249.127.135[/C][/ROW]
[/TABLE]
Source: https://freestatistics.org/blog/index.php?pk=33917&T=0

Globally Unique Identifier (entire table): ba.freestatistics.org/blog/index.php?pk=33917&T=0

As an alternative you can also use a QR Code:  

The GUIDs for individual cells are displayed in the table below:

Summary of computational transaction
Raw Inputview raw input (R code)
Raw Outputview raw output of R engine
Computing time1 seconds
R Server'Gwilym Jenkins' @ 72.249.127.135


Autocorrelation Function
Time lag kACF(k)T-STATP-value
10.0041470.03910.48444
2-0.014095-0.1330.44726
3-0.011739-0.11070.456034
40.0978670.92330.179179
50.0781940.73770.231323
60.0801920.75650.225664
70.031940.30130.381935
80.1125621.06190.145576
90.1339061.26330.104896
10-0.059801-0.56420.287031
11-0.044333-0.41820.338391
12-0.213712-2.01620.0234
13-0.000486-0.00460.498177
140.2286552.15710.016845
15-0.006144-0.0580.476953
16-0.027319-0.25770.398605
17-0.075662-0.71380.238612
180.0651390.61450.270219
190.074330.70120.242494
20-0.004501-0.04250.483114
210.0429940.40560.343003
220.0549740.51860.302655
230.1818461.71550.044864
24-0.08873-0.83710.202397
25-0.127231-1.20030.116606
26-0.169071-1.5950.057127
270.0880050.83020.204313
28-0.017636-0.16640.43412
290.1067621.00720.158287
30-0.096138-0.9070.183439
31-0.094845-0.89480.186662
320.0159130.15010.440504
33-0.103309-0.97460.166197
34-0.094294-0.88960.188048
35-0.045665-0.43080.333825
360.0277060.26140.397202

\begin{tabular}{lllllllll}
\hline
Autocorrelation Function \tabularnewline
Time lag k & ACF(k) & T-STAT & P-value \tabularnewline
1 & 0.004147 & 0.0391 & 0.48444 \tabularnewline
2 & -0.014095 & -0.133 & 0.44726 \tabularnewline
3 & -0.011739 & -0.1107 & 0.456034 \tabularnewline
4 & 0.097867 & 0.9233 & 0.179179 \tabularnewline
5 & 0.078194 & 0.7377 & 0.231323 \tabularnewline
6 & 0.080192 & 0.7565 & 0.225664 \tabularnewline
7 & 0.03194 & 0.3013 & 0.381935 \tabularnewline
8 & 0.112562 & 1.0619 & 0.145576 \tabularnewline
9 & 0.133906 & 1.2633 & 0.104896 \tabularnewline
10 & -0.059801 & -0.5642 & 0.287031 \tabularnewline
11 & -0.044333 & -0.4182 & 0.338391 \tabularnewline
12 & -0.213712 & -2.0162 & 0.0234 \tabularnewline
13 & -0.000486 & -0.0046 & 0.498177 \tabularnewline
14 & 0.228655 & 2.1571 & 0.016845 \tabularnewline
15 & -0.006144 & -0.058 & 0.476953 \tabularnewline
16 & -0.027319 & -0.2577 & 0.398605 \tabularnewline
17 & -0.075662 & -0.7138 & 0.238612 \tabularnewline
18 & 0.065139 & 0.6145 & 0.270219 \tabularnewline
19 & 0.07433 & 0.7012 & 0.242494 \tabularnewline
20 & -0.004501 & -0.0425 & 0.483114 \tabularnewline
21 & 0.042994 & 0.4056 & 0.343003 \tabularnewline
22 & 0.054974 & 0.5186 & 0.302655 \tabularnewline
23 & 0.181846 & 1.7155 & 0.044864 \tabularnewline
24 & -0.08873 & -0.8371 & 0.202397 \tabularnewline
25 & -0.127231 & -1.2003 & 0.116606 \tabularnewline
26 & -0.169071 & -1.595 & 0.057127 \tabularnewline
27 & 0.088005 & 0.8302 & 0.204313 \tabularnewline
28 & -0.017636 & -0.1664 & 0.43412 \tabularnewline
29 & 0.106762 & 1.0072 & 0.158287 \tabularnewline
30 & -0.096138 & -0.907 & 0.183439 \tabularnewline
31 & -0.094845 & -0.8948 & 0.186662 \tabularnewline
32 & 0.015913 & 0.1501 & 0.440504 \tabularnewline
33 & -0.103309 & -0.9746 & 0.166197 \tabularnewline
34 & -0.094294 & -0.8896 & 0.188048 \tabularnewline
35 & -0.045665 & -0.4308 & 0.333825 \tabularnewline
36 & 0.027706 & 0.2614 & 0.397202 \tabularnewline
\hline
\end{tabular}
%Source: https://freestatistics.org/blog/index.php?pk=33917&T=1

[TABLE]
[ROW][C]Autocorrelation Function[/C][/ROW]
[ROW][C]Time lag k[/C][C]ACF(k)[/C][C]T-STAT[/C][C]P-value[/C][/ROW]
[ROW][C]1[/C][C]0.004147[/C][C]0.0391[/C][C]0.48444[/C][/ROW]
[ROW][C]2[/C][C]-0.014095[/C][C]-0.133[/C][C]0.44726[/C][/ROW]
[ROW][C]3[/C][C]-0.011739[/C][C]-0.1107[/C][C]0.456034[/C][/ROW]
[ROW][C]4[/C][C]0.097867[/C][C]0.9233[/C][C]0.179179[/C][/ROW]
[ROW][C]5[/C][C]0.078194[/C][C]0.7377[/C][C]0.231323[/C][/ROW]
[ROW][C]6[/C][C]0.080192[/C][C]0.7565[/C][C]0.225664[/C][/ROW]
[ROW][C]7[/C][C]0.03194[/C][C]0.3013[/C][C]0.381935[/C][/ROW]
[ROW][C]8[/C][C]0.112562[/C][C]1.0619[/C][C]0.145576[/C][/ROW]
[ROW][C]9[/C][C]0.133906[/C][C]1.2633[/C][C]0.104896[/C][/ROW]
[ROW][C]10[/C][C]-0.059801[/C][C]-0.5642[/C][C]0.287031[/C][/ROW]
[ROW][C]11[/C][C]-0.044333[/C][C]-0.4182[/C][C]0.338391[/C][/ROW]
[ROW][C]12[/C][C]-0.213712[/C][C]-2.0162[/C][C]0.0234[/C][/ROW]
[ROW][C]13[/C][C]-0.000486[/C][C]-0.0046[/C][C]0.498177[/C][/ROW]
[ROW][C]14[/C][C]0.228655[/C][C]2.1571[/C][C]0.016845[/C][/ROW]
[ROW][C]15[/C][C]-0.006144[/C][C]-0.058[/C][C]0.476953[/C][/ROW]
[ROW][C]16[/C][C]-0.027319[/C][C]-0.2577[/C][C]0.398605[/C][/ROW]
[ROW][C]17[/C][C]-0.075662[/C][C]-0.7138[/C][C]0.238612[/C][/ROW]
[ROW][C]18[/C][C]0.065139[/C][C]0.6145[/C][C]0.270219[/C][/ROW]
[ROW][C]19[/C][C]0.07433[/C][C]0.7012[/C][C]0.242494[/C][/ROW]
[ROW][C]20[/C][C]-0.004501[/C][C]-0.0425[/C][C]0.483114[/C][/ROW]
[ROW][C]21[/C][C]0.042994[/C][C]0.4056[/C][C]0.343003[/C][/ROW]
[ROW][C]22[/C][C]0.054974[/C][C]0.5186[/C][C]0.302655[/C][/ROW]
[ROW][C]23[/C][C]0.181846[/C][C]1.7155[/C][C]0.044864[/C][/ROW]
[ROW][C]24[/C][C]-0.08873[/C][C]-0.8371[/C][C]0.202397[/C][/ROW]
[ROW][C]25[/C][C]-0.127231[/C][C]-1.2003[/C][C]0.116606[/C][/ROW]
[ROW][C]26[/C][C]-0.169071[/C][C]-1.595[/C][C]0.057127[/C][/ROW]
[ROW][C]27[/C][C]0.088005[/C][C]0.8302[/C][C]0.204313[/C][/ROW]
[ROW][C]28[/C][C]-0.017636[/C][C]-0.1664[/C][C]0.43412[/C][/ROW]
[ROW][C]29[/C][C]0.106762[/C][C]1.0072[/C][C]0.158287[/C][/ROW]
[ROW][C]30[/C][C]-0.096138[/C][C]-0.907[/C][C]0.183439[/C][/ROW]
[ROW][C]31[/C][C]-0.094845[/C][C]-0.8948[/C][C]0.186662[/C][/ROW]
[ROW][C]32[/C][C]0.015913[/C][C]0.1501[/C][C]0.440504[/C][/ROW]
[ROW][C]33[/C][C]-0.103309[/C][C]-0.9746[/C][C]0.166197[/C][/ROW]
[ROW][C]34[/C][C]-0.094294[/C][C]-0.8896[/C][C]0.188048[/C][/ROW]
[ROW][C]35[/C][C]-0.045665[/C][C]-0.4308[/C][C]0.333825[/C][/ROW]
[ROW][C]36[/C][C]0.027706[/C][C]0.2614[/C][C]0.397202[/C][/ROW]
[/TABLE]
Source: https://freestatistics.org/blog/index.php?pk=33917&T=1

Globally Unique Identifier (entire table): ba.freestatistics.org/blog/index.php?pk=33917&T=1

As an alternative you can also use a QR Code:  

The GUIDs for individual cells are displayed in the table below:

Autocorrelation Function
Time lag kACF(k)T-STATP-value
10.0041470.03910.48444
2-0.014095-0.1330.44726
3-0.011739-0.11070.456034
40.0978670.92330.179179
50.0781940.73770.231323
60.0801920.75650.225664
70.031940.30130.381935
80.1125621.06190.145576
90.1339061.26330.104896
10-0.059801-0.56420.287031
11-0.044333-0.41820.338391
12-0.213712-2.01620.0234
13-0.000486-0.00460.498177
140.2286552.15710.016845
15-0.006144-0.0580.476953
16-0.027319-0.25770.398605
17-0.075662-0.71380.238612
180.0651390.61450.270219
190.074330.70120.242494
20-0.004501-0.04250.483114
210.0429940.40560.343003
220.0549740.51860.302655
230.1818461.71550.044864
24-0.08873-0.83710.202397
25-0.127231-1.20030.116606
26-0.169071-1.5950.057127
270.0880050.83020.204313
28-0.017636-0.16640.43412
290.1067621.00720.158287
30-0.096138-0.9070.183439
31-0.094845-0.89480.186662
320.0159130.15010.440504
33-0.103309-0.97460.166197
34-0.094294-0.88960.188048
35-0.045665-0.43080.333825
360.0277060.26140.397202


Partial Autocorrelation Function
Time lag kPACF(k)T-STATP-value
10.0041470.03910.48444
2-0.014112-0.13310.447195
3-0.011624-0.10970.456464
40.0977990.92260.179346
50.0777340.73330.232638
60.0837850.79040.215691
70.0379750.35830.360499
80.1108351.04560.149284
90.1296691.22330.112223
10-0.073034-0.6890.246309
11-0.05829-0.54990.291881
12-0.262595-2.47730.007563
13-0.078031-0.73610.231789
140.2046661.93080.028345
15-0.004995-0.04710.481261
160.0320110.3020.38168
17-0.053342-0.50320.308025
180.0779290.73520.232081
190.1308011.2340.11023
200.0359040.33870.36781
210.1168071.1020.136726
22-0.039374-0.37150.355591
230.1046470.98720.163101
24-0.15207-1.43460.077449
25-0.205059-1.93450.028113
26-0.1626-1.5340.064293
27-0.046388-0.43760.331358
28-0.109329-1.03140.152573
290.1203691.13560.129595
300.0004580.00430.498281
310.0422950.3990.345421
320.1086731.02520.154019
330.0147840.13950.444697
340.0098140.09260.463219
35-0.00371-0.0350.486078
36-0.060766-0.57330.283956

\begin{tabular}{lllllllll}
\hline
Partial Autocorrelation Function \tabularnewline
Time lag k & PACF(k) & T-STAT & P-value \tabularnewline
1 & 0.004147 & 0.0391 & 0.48444 \tabularnewline
2 & -0.014112 & -0.1331 & 0.447195 \tabularnewline
3 & -0.011624 & -0.1097 & 0.456464 \tabularnewline
4 & 0.097799 & 0.9226 & 0.179346 \tabularnewline
5 & 0.077734 & 0.7333 & 0.232638 \tabularnewline
6 & 0.083785 & 0.7904 & 0.215691 \tabularnewline
7 & 0.037975 & 0.3583 & 0.360499 \tabularnewline
8 & 0.110835 & 1.0456 & 0.149284 \tabularnewline
9 & 0.129669 & 1.2233 & 0.112223 \tabularnewline
10 & -0.073034 & -0.689 & 0.246309 \tabularnewline
11 & -0.05829 & -0.5499 & 0.291881 \tabularnewline
12 & -0.262595 & -2.4773 & 0.007563 \tabularnewline
13 & -0.078031 & -0.7361 & 0.231789 \tabularnewline
14 & 0.204666 & 1.9308 & 0.028345 \tabularnewline
15 & -0.004995 & -0.0471 & 0.481261 \tabularnewline
16 & 0.032011 & 0.302 & 0.38168 \tabularnewline
17 & -0.053342 & -0.5032 & 0.308025 \tabularnewline
18 & 0.077929 & 0.7352 & 0.232081 \tabularnewline
19 & 0.130801 & 1.234 & 0.11023 \tabularnewline
20 & 0.035904 & 0.3387 & 0.36781 \tabularnewline
21 & 0.116807 & 1.102 & 0.136726 \tabularnewline
22 & -0.039374 & -0.3715 & 0.355591 \tabularnewline
23 & 0.104647 & 0.9872 & 0.163101 \tabularnewline
24 & -0.15207 & -1.4346 & 0.077449 \tabularnewline
25 & -0.205059 & -1.9345 & 0.028113 \tabularnewline
26 & -0.1626 & -1.534 & 0.064293 \tabularnewline
27 & -0.046388 & -0.4376 & 0.331358 \tabularnewline
28 & -0.109329 & -1.0314 & 0.152573 \tabularnewline
29 & 0.120369 & 1.1356 & 0.129595 \tabularnewline
30 & 0.000458 & 0.0043 & 0.498281 \tabularnewline
31 & 0.042295 & 0.399 & 0.345421 \tabularnewline
32 & 0.108673 & 1.0252 & 0.154019 \tabularnewline
33 & 0.014784 & 0.1395 & 0.444697 \tabularnewline
34 & 0.009814 & 0.0926 & 0.463219 \tabularnewline
35 & -0.00371 & -0.035 & 0.486078 \tabularnewline
36 & -0.060766 & -0.5733 & 0.283956 \tabularnewline
\hline
\end{tabular}
%Source: https://freestatistics.org/blog/index.php?pk=33917&T=2

[TABLE]
[ROW][C]Partial Autocorrelation Function[/C][/ROW]
[ROW][C]Time lag k[/C][C]PACF(k)[/C][C]T-STAT[/C][C]P-value[/C][/ROW]
[ROW][C]1[/C][C]0.004147[/C][C]0.0391[/C][C]0.48444[/C][/ROW]
[ROW][C]2[/C][C]-0.014112[/C][C]-0.1331[/C][C]0.447195[/C][/ROW]
[ROW][C]3[/C][C]-0.011624[/C][C]-0.1097[/C][C]0.456464[/C][/ROW]
[ROW][C]4[/C][C]0.097799[/C][C]0.9226[/C][C]0.179346[/C][/ROW]
[ROW][C]5[/C][C]0.077734[/C][C]0.7333[/C][C]0.232638[/C][/ROW]
[ROW][C]6[/C][C]0.083785[/C][C]0.7904[/C][C]0.215691[/C][/ROW]
[ROW][C]7[/C][C]0.037975[/C][C]0.3583[/C][C]0.360499[/C][/ROW]
[ROW][C]8[/C][C]0.110835[/C][C]1.0456[/C][C]0.149284[/C][/ROW]
[ROW][C]9[/C][C]0.129669[/C][C]1.2233[/C][C]0.112223[/C][/ROW]
[ROW][C]10[/C][C]-0.073034[/C][C]-0.689[/C][C]0.246309[/C][/ROW]
[ROW][C]11[/C][C]-0.05829[/C][C]-0.5499[/C][C]0.291881[/C][/ROW]
[ROW][C]12[/C][C]-0.262595[/C][C]-2.4773[/C][C]0.007563[/C][/ROW]
[ROW][C]13[/C][C]-0.078031[/C][C]-0.7361[/C][C]0.231789[/C][/ROW]
[ROW][C]14[/C][C]0.204666[/C][C]1.9308[/C][C]0.028345[/C][/ROW]
[ROW][C]15[/C][C]-0.004995[/C][C]-0.0471[/C][C]0.481261[/C][/ROW]
[ROW][C]16[/C][C]0.032011[/C][C]0.302[/C][C]0.38168[/C][/ROW]
[ROW][C]17[/C][C]-0.053342[/C][C]-0.5032[/C][C]0.308025[/C][/ROW]
[ROW][C]18[/C][C]0.077929[/C][C]0.7352[/C][C]0.232081[/C][/ROW]
[ROW][C]19[/C][C]0.130801[/C][C]1.234[/C][C]0.11023[/C][/ROW]
[ROW][C]20[/C][C]0.035904[/C][C]0.3387[/C][C]0.36781[/C][/ROW]
[ROW][C]21[/C][C]0.116807[/C][C]1.102[/C][C]0.136726[/C][/ROW]
[ROW][C]22[/C][C]-0.039374[/C][C]-0.3715[/C][C]0.355591[/C][/ROW]
[ROW][C]23[/C][C]0.104647[/C][C]0.9872[/C][C]0.163101[/C][/ROW]
[ROW][C]24[/C][C]-0.15207[/C][C]-1.4346[/C][C]0.077449[/C][/ROW]
[ROW][C]25[/C][C]-0.205059[/C][C]-1.9345[/C][C]0.028113[/C][/ROW]
[ROW][C]26[/C][C]-0.1626[/C][C]-1.534[/C][C]0.064293[/C][/ROW]
[ROW][C]27[/C][C]-0.046388[/C][C]-0.4376[/C][C]0.331358[/C][/ROW]
[ROW][C]28[/C][C]-0.109329[/C][C]-1.0314[/C][C]0.152573[/C][/ROW]
[ROW][C]29[/C][C]0.120369[/C][C]1.1356[/C][C]0.129595[/C][/ROW]
[ROW][C]30[/C][C]0.000458[/C][C]0.0043[/C][C]0.498281[/C][/ROW]
[ROW][C]31[/C][C]0.042295[/C][C]0.399[/C][C]0.345421[/C][/ROW]
[ROW][C]32[/C][C]0.108673[/C][C]1.0252[/C][C]0.154019[/C][/ROW]
[ROW][C]33[/C][C]0.014784[/C][C]0.1395[/C][C]0.444697[/C][/ROW]
[ROW][C]34[/C][C]0.009814[/C][C]0.0926[/C][C]0.463219[/C][/ROW]
[ROW][C]35[/C][C]-0.00371[/C][C]-0.035[/C][C]0.486078[/C][/ROW]
[ROW][C]36[/C][C]-0.060766[/C][C]-0.5733[/C][C]0.283956[/C][/ROW]
[/TABLE]
Source: https://freestatistics.org/blog/index.php?pk=33917&T=2

Globally Unique Identifier (entire table): ba.freestatistics.org/blog/index.php?pk=33917&T=2

As an alternative you can also use a QR Code:  

The GUIDs for individual cells are displayed in the table below:

Partial Autocorrelation Function
Time lag kPACF(k)T-STATP-value
10.0041470.03910.48444
2-0.014112-0.13310.447195
3-0.011624-0.10970.456464
40.0977990.92260.179346
50.0777340.73330.232638
60.0837850.79040.215691
70.0379750.35830.360499
80.1108351.04560.149284
90.1296691.22330.112223
10-0.073034-0.6890.246309
11-0.05829-0.54990.291881
12-0.262595-2.47730.007563
13-0.078031-0.73610.231789
140.2046661.93080.028345
15-0.004995-0.04710.481261
160.0320110.3020.38168
17-0.053342-0.50320.308025
180.0779290.73520.232081
190.1308011.2340.11023
200.0359040.33870.36781
210.1168071.1020.136726
22-0.039374-0.37150.355591
230.1046470.98720.163101
24-0.15207-1.43460.077449
25-0.205059-1.93450.028113
26-0.1626-1.5340.064293
27-0.046388-0.43760.331358
28-0.109329-1.03140.152573
290.1203691.13560.129595
300.0004580.00430.498281
310.0422950.3990.345421
320.1086731.02520.154019
330.0147840.13950.444697
340.0098140.09260.463219
35-0.00371-0.0350.486078
36-0.060766-0.57330.283956


Parameters (Session):
par1 = 36 ; par2 = 1 ; par3 = 1 ; par4 = 1 ; par5 = 12 ;
Parameters (R input):
par1 = 36 ; par2 = 1 ; par3 = 1 ; par4 = 1 ; par5 = 12 ;
R code (references can be found in the software module):
if (par1 == 'Default') {
par1 = 10*log10(length(x))
} else {
par1 <- as.numeric(par1)
}
par2 <- as.numeric(par2)
par3 <- as.numeric(par3)
par4 <- as.numeric(par4)
par5 <- as.numeric(par5)
if (par2 == 0) {
x <- log(x)
} else {
x <- (x ^ par2 - 1) / par2
}
if (par3 > 0) x <- diff(x,lag=1,difference=par3)
if (par4 > 0) x <- diff(x,lag=par5,difference=par4)
bitmap(file='pic1.png')
racf <- acf(x,par1,main='Autocorrelation',xlab='lags',ylab='ACF')
dev.off()
bitmap(file='pic2.png')
rpacf <- pacf(x,par1,main='Partial Autocorrelation',xlab='lags',ylab='PACF')
dev.off()
(myacf <- c(racf$acf))
(mypacf <- c(rpacf$acf))
lengthx <- length(x)
sqrtn <- sqrt(lengthx)
load(file='createtable')
a<-table.start()
a<-table.row.start(a)
a<-table.element(a,'Autocorrelation Function',4,TRUE)
a<-table.row.end(a)
a<-table.row.start(a)
a<-table.element(a,'Time lag k',header=TRUE)
a<-table.element(a,hyperlink('basics.htm','ACF(k)','click here for more information about the Autocorrelation Function'),header=TRUE)
a<-table.element(a,'T-STAT',header=TRUE)
a<-table.element(a,'P-value',header=TRUE)
a<-table.row.end(a)
for (i in 2:(par1+1)) {
a<-table.row.start(a)
a<-table.element(a,i-1,header=TRUE)
a<-table.element(a,round(myacf[i],6))
mytstat <- myacf[i]*sqrtn
a<-table.element(a,round(mytstat,4))
a<-table.element(a,round(1-pt(abs(mytstat),lengthx),6))
a<-table.row.end(a)
}
a<-table.end(a)
table.save(a,file='mytable.tab')
a<-table.start()
a<-table.row.start(a)
a<-table.element(a,'Partial Autocorrelation Function',4,TRUE)
a<-table.row.end(a)
a<-table.row.start(a)
a<-table.element(a,'Time lag k',header=TRUE)
a<-table.element(a,hyperlink('basics.htm','PACF(k)','click here for more information about the Partial Autocorrelation Function'),header=TRUE)
a<-table.element(a,'T-STAT',header=TRUE)
a<-table.element(a,'P-value',header=TRUE)
a<-table.row.end(a)
for (i in 1:par1) {
a<-table.row.start(a)
a<-table.element(a,i,header=TRUE)
a<-table.element(a,round(mypacf[i],6))
mytstat <- mypacf[i]*sqrtn
a<-table.element(a,round(mytstat,4))
a<-table.element(a,round(1-pt(abs(mytstat),lengthx),6))
a<-table.row.end(a)
}
a<-table.end(a)
table.save(a,file='mytable1.tab')