Free Statistics

of Irreproducible Research!

Author's title

Author*The author of this computation has been verified*
R Software Modulerwasp_arimaforecasting.wasp
Title produced by softwareARIMA Forecasting
Date of computationTue, 16 Dec 2008 03:26:24 -0700
Cite this page as followsStatistical Computations at FreeStatistics.org, Office for Research Development and Education, URL https://freestatistics.org/blog/index.php?v=date/2008/Dec/16/t1229423357tplogf1hot5ih1f.htm/, Retrieved Thu, 16 May 2024 00:16:18 +0000
Statistical Computations at FreeStatistics.org, Office for Research Development and Education, URL https://freestatistics.org/blog/index.php?pk=33899, Retrieved Thu, 16 May 2024 00:16:18 +0000
QR Codes:

Original text written by user:
IsPrivate?No (this computation is public)
User-defined keywords
Estimated Impact175
Family? (F = Feedback message, R = changed R code, M = changed R Module, P = changed Parameters, D = changed Data)
F       [ARIMA Forecasting] [arima forecasting] [2008-12-16 10:26:24] [0bb3b56b7083c5944c3818446f605d68] [Current]
Feedback Forum
2008-12-18 15:36:57 [Natalie De Wilde] [reply
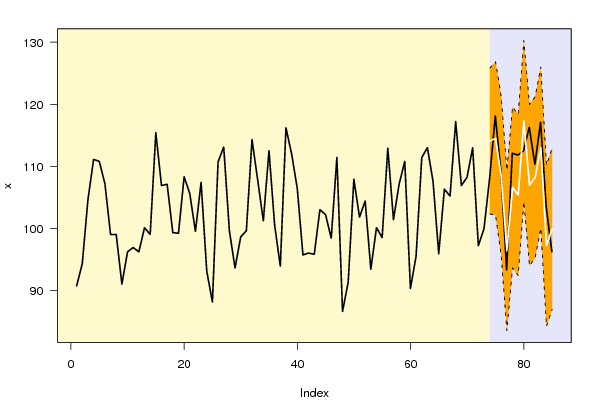
Goed, een redelijk grondige bespreking van step 1. Je legt uit wat de grafieken en tabellen voorstellen. Er ontbreekt inderdaad nog wel een conclusie.
2008-12-18 15:39:12 [Natalie De Wilde] [reply
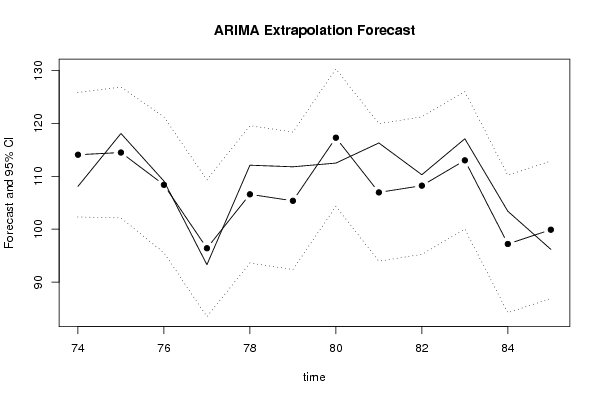
STEP 2: Ok, er is inderdaad niet meteen een trendmatig verloop op te merken. De kleine daling bij 77 vormt geen probleem denk ik. De grafiek gaat telkens licht op en neer. De voorspelling loopt redelijk gelijk met de gemeten waarden.
2008-12-18 15:41:33 [Natalie De Wilde] [reply
STEP 3: de procentuele standaard fout is inderdaad overal klein, maar de p-waarde is niet overal kleiner dan 0,05. Dit is wel belangrijk om rekening mee te houden!
2008-12-18 15:42:48 [Natalie De Wilde] [reply
STEP4: zeer goed, hier heb ik niets aan toe te voegen
2008-12-18 15:44:50 [Natalie De Wilde] [reply
STEP 5: de waarden van Y(t) en F(t) liggen inderdaad steeds dicht bij elkaar. Maar moet er hier dan geen rekening gehouden worden met de p-waarde om te zien of ze al dan niet significant verschillend zijn?
2008-12-23 16:45:59 [Glenn Maras] [reply
STEP 1: De berekeningen zijn correct gebeurd. Ook de bespreking van de tabellen en grafieken kloppen. Als conclusie kon de student zeggen dat het model gebruikt zou kunnen worden om voorspellingen te maken aangezien de standaardfout en de reele fout klein zijn.

STEP 2: De conclusie klopt inderdaad. Er is niet direct een bepaalde trend of opmerkelijke daling of stijging terug te vinden op de grafiek.

STEP 3: De p-waarden zijn inderdaad vrij laag en ze blijven ook constant. Dat wil zeggen dat de voorspelling van 12de maand even betrouwbaar is als die van de 1ste maand. Ook de reele fout is niet groot.
Besluit: Dit model is een goed voorspellingsmodel

STEP 4: Deze stap is goed en duidelijk besproken.

STEP 5: De student zegt dat de waarden van F(t) steeds dicht bij Y(t) liggen dus dat wijst op een voorspelbaar model. Ook de standaardfout is klein dus het is een betrouwbaar model.

Post a new message
Dataseries X:
90.7
94.3
104.6
111.1
110.8
107.2
99
99
91
96.2
96.9
96.2
100.1
99
115.4
106.9
107.1
99.3
99.2
108.3
105.6
99.5
107.4
93.1
88.1
110.7
113.1
99.6
93.6
98.6
99.6
114.3
107.8
101.2
112.5
100.5
93.9
116.2
112
106.4
95.7
96
95.8
103
102.2
98.4
111.4
86.6
91.3
107.9
101.8
104.4
93.4
100.1
98.5
112.9
101.4
107.1
110.8
90.3
95.5
111.4
113
107.5
95.9
106.3
105.2
117.2
106.9
108.2
113
97.2
99.9
108.1
118.1
109.1
93.3
112.1
111.8
112.5
116.3
110.3
117.1
103.4
96.2


Summary of computational transaction
Raw Inputview raw input (R code)
Raw Outputview raw output of R engine
Computing time1 seconds
R Server'Gwilym Jenkins' @ 72.249.127.135

\begin{tabular}{lllllllll}
\hline
Summary of computational transaction \tabularnewline
Raw Input & view raw input (R code)  \tabularnewline
Raw Output & view raw output of R engine  \tabularnewline
Computing time & 1 seconds \tabularnewline
R Server & 'Gwilym Jenkins' @ 72.249.127.135 \tabularnewline
\hline
\end{tabular}
%Source: https://freestatistics.org/blog/index.php?pk=33899&T=0

[TABLE]
[ROW][C]Summary of computational transaction[/C][/ROW]
[ROW][C]Raw Input[/C][C]view raw input (R code) [/C][/ROW]
[ROW][C]Raw Output[/C][C]view raw output of R engine [/C][/ROW]
[ROW][C]Computing time[/C][C]1 seconds[/C][/ROW]
[ROW][C]R Server[/C][C]'Gwilym Jenkins' @ 72.249.127.135[/C][/ROW]
[/TABLE]
Source: https://freestatistics.org/blog/index.php?pk=33899&T=0

Globally Unique Identifier (entire table): ba.freestatistics.org/blog/index.php?pk=33899&T=0

As an alternative you can also use a QR Code:  

The GUIDs for individual cells are displayed in the table below:

Summary of computational transaction
Raw Inputview raw input (R code)
Raw Outputview raw output of R engine
Computing time1 seconds
R Server'Gwilym Jenkins' @ 72.249.127.135


Univariate ARIMA Extrapolation Forecast
timeY[t]F[t]95% LB95% UBp-value(H0: Y[t] = F[t])P(F[t]>Y[t-1])P(F[t]>Y[t-s])P(F[t]>Y[73])
6195.5-------
62111.4-------
63113-------
64107.5-------
6595.9-------
66106.3-------
67105.2-------
68117.2-------
69106.9-------
70108.2-------
71113-------
7297.2-------
7399.9-------
74108.1114.0776102.3151125.84010.15960.99090.67230.9909
75118.1114.4976102.1339126.86130.2840.84480.59380.9897
76109.1108.391195.5445121.23770.45690.06930.55410.9024
7793.396.406683.4755109.33770.31890.02720.53060.2982
78112.1106.597893.621119.57460.2030.97770.51790.8441
79111.8105.370892.3831118.35850.1660.15490.51030.7955
80112.5117.2998104.3074130.29220.23450.79660.5060.9957
81116.3106.957593.9638119.95120.07940.20160.50350.8565
82110.3108.233595.2392121.22770.37760.11190.5020.8956
83117.1113.0193100.0249126.01370.26910.65920.50120.9761
84103.497.211284.2168110.20570.17530.00140.50070.3425
8596.299.906586.912112.9010.28810.29910.50040.5004

\begin{tabular}{lllllllll}
\hline
Univariate ARIMA Extrapolation Forecast \tabularnewline
time & Y[t] & F[t] & 95% LB & 95% UB & p-value(H0: Y[t] = F[t]) & P(F[t]>Y[t-1]) & P(F[t]>Y[t-s]) & P(F[t]>Y[73]) \tabularnewline
61 & 95.5 & - & - & - & - & - & - & - \tabularnewline
62 & 111.4 & - & - & - & - & - & - & - \tabularnewline
63 & 113 & - & - & - & - & - & - & - \tabularnewline
64 & 107.5 & - & - & - & - & - & - & - \tabularnewline
65 & 95.9 & - & - & - & - & - & - & - \tabularnewline
66 & 106.3 & - & - & - & - & - & - & - \tabularnewline
67 & 105.2 & - & - & - & - & - & - & - \tabularnewline
68 & 117.2 & - & - & - & - & - & - & - \tabularnewline
69 & 106.9 & - & - & - & - & - & - & - \tabularnewline
70 & 108.2 & - & - & - & - & - & - & - \tabularnewline
71 & 113 & - & - & - & - & - & - & - \tabularnewline
72 & 97.2 & - & - & - & - & - & - & - \tabularnewline
73 & 99.9 & - & - & - & - & - & - & - \tabularnewline
74 & 108.1 & 114.0776 & 102.3151 & 125.8401 & 0.1596 & 0.9909 & 0.6723 & 0.9909 \tabularnewline
75 & 118.1 & 114.4976 & 102.1339 & 126.8613 & 0.284 & 0.8448 & 0.5938 & 0.9897 \tabularnewline
76 & 109.1 & 108.3911 & 95.5445 & 121.2377 & 0.4569 & 0.0693 & 0.5541 & 0.9024 \tabularnewline
77 & 93.3 & 96.4066 & 83.4755 & 109.3377 & 0.3189 & 0.0272 & 0.5306 & 0.2982 \tabularnewline
78 & 112.1 & 106.5978 & 93.621 & 119.5746 & 0.203 & 0.9777 & 0.5179 & 0.8441 \tabularnewline
79 & 111.8 & 105.3708 & 92.3831 & 118.3585 & 0.166 & 0.1549 & 0.5103 & 0.7955 \tabularnewline
80 & 112.5 & 117.2998 & 104.3074 & 130.2922 & 0.2345 & 0.7966 & 0.506 & 0.9957 \tabularnewline
81 & 116.3 & 106.9575 & 93.9638 & 119.9512 & 0.0794 & 0.2016 & 0.5035 & 0.8565 \tabularnewline
82 & 110.3 & 108.2335 & 95.2392 & 121.2277 & 0.3776 & 0.1119 & 0.502 & 0.8956 \tabularnewline
83 & 117.1 & 113.0193 & 100.0249 & 126.0137 & 0.2691 & 0.6592 & 0.5012 & 0.9761 \tabularnewline
84 & 103.4 & 97.2112 & 84.2168 & 110.2057 & 0.1753 & 0.0014 & 0.5007 & 0.3425 \tabularnewline
85 & 96.2 & 99.9065 & 86.912 & 112.901 & 0.2881 & 0.2991 & 0.5004 & 0.5004 \tabularnewline
\hline
\end{tabular}
%Source: https://freestatistics.org/blog/index.php?pk=33899&T=1

[TABLE]
[ROW][C]Univariate ARIMA Extrapolation Forecast[/C][/ROW]
[ROW][C]time[/C][C]Y[t][/C][C]F[t][/C][C]95% LB[/C][C]95% UB[/C][C]p-value(H0: Y[t] = F[t])[/C][C]P(F[t]>Y[t-1])[/C][C]P(F[t]>Y[t-s])[/C][C]P(F[t]>Y[73])[/C][/ROW]
[ROW][C]61[/C][C]95.5[/C][C]-[/C][C]-[/C][C]-[/C][C]-[/C][C]-[/C][C]-[/C][C]-[/C][/ROW]
[ROW][C]62[/C][C]111.4[/C][C]-[/C][C]-[/C][C]-[/C][C]-[/C][C]-[/C][C]-[/C][C]-[/C][/ROW]
[ROW][C]63[/C][C]113[/C][C]-[/C][C]-[/C][C]-[/C][C]-[/C][C]-[/C][C]-[/C][C]-[/C][/ROW]
[ROW][C]64[/C][C]107.5[/C][C]-[/C][C]-[/C][C]-[/C][C]-[/C][C]-[/C][C]-[/C][C]-[/C][/ROW]
[ROW][C]65[/C][C]95.9[/C][C]-[/C][C]-[/C][C]-[/C][C]-[/C][C]-[/C][C]-[/C][C]-[/C][/ROW]
[ROW][C]66[/C][C]106.3[/C][C]-[/C][C]-[/C][C]-[/C][C]-[/C][C]-[/C][C]-[/C][C]-[/C][/ROW]
[ROW][C]67[/C][C]105.2[/C][C]-[/C][C]-[/C][C]-[/C][C]-[/C][C]-[/C][C]-[/C][C]-[/C][/ROW]
[ROW][C]68[/C][C]117.2[/C][C]-[/C][C]-[/C][C]-[/C][C]-[/C][C]-[/C][C]-[/C][C]-[/C][/ROW]
[ROW][C]69[/C][C]106.9[/C][C]-[/C][C]-[/C][C]-[/C][C]-[/C][C]-[/C][C]-[/C][C]-[/C][/ROW]
[ROW][C]70[/C][C]108.2[/C][C]-[/C][C]-[/C][C]-[/C][C]-[/C][C]-[/C][C]-[/C][C]-[/C][/ROW]
[ROW][C]71[/C][C]113[/C][C]-[/C][C]-[/C][C]-[/C][C]-[/C][C]-[/C][C]-[/C][C]-[/C][/ROW]
[ROW][C]72[/C][C]97.2[/C][C]-[/C][C]-[/C][C]-[/C][C]-[/C][C]-[/C][C]-[/C][C]-[/C][/ROW]
[ROW][C]73[/C][C]99.9[/C][C]-[/C][C]-[/C][C]-[/C][C]-[/C][C]-[/C][C]-[/C][C]-[/C][/ROW]
[ROW][C]74[/C][C]108.1[/C][C]114.0776[/C][C]102.3151[/C][C]125.8401[/C][C]0.1596[/C][C]0.9909[/C][C]0.6723[/C][C]0.9909[/C][/ROW]
[ROW][C]75[/C][C]118.1[/C][C]114.4976[/C][C]102.1339[/C][C]126.8613[/C][C]0.284[/C][C]0.8448[/C][C]0.5938[/C][C]0.9897[/C][/ROW]
[ROW][C]76[/C][C]109.1[/C][C]108.3911[/C][C]95.5445[/C][C]121.2377[/C][C]0.4569[/C][C]0.0693[/C][C]0.5541[/C][C]0.9024[/C][/ROW]
[ROW][C]77[/C][C]93.3[/C][C]96.4066[/C][C]83.4755[/C][C]109.3377[/C][C]0.3189[/C][C]0.0272[/C][C]0.5306[/C][C]0.2982[/C][/ROW]
[ROW][C]78[/C][C]112.1[/C][C]106.5978[/C][C]93.621[/C][C]119.5746[/C][C]0.203[/C][C]0.9777[/C][C]0.5179[/C][C]0.8441[/C][/ROW]
[ROW][C]79[/C][C]111.8[/C][C]105.3708[/C][C]92.3831[/C][C]118.3585[/C][C]0.166[/C][C]0.1549[/C][C]0.5103[/C][C]0.7955[/C][/ROW]
[ROW][C]80[/C][C]112.5[/C][C]117.2998[/C][C]104.3074[/C][C]130.2922[/C][C]0.2345[/C][C]0.7966[/C][C]0.506[/C][C]0.9957[/C][/ROW]
[ROW][C]81[/C][C]116.3[/C][C]106.9575[/C][C]93.9638[/C][C]119.9512[/C][C]0.0794[/C][C]0.2016[/C][C]0.5035[/C][C]0.8565[/C][/ROW]
[ROW][C]82[/C][C]110.3[/C][C]108.2335[/C][C]95.2392[/C][C]121.2277[/C][C]0.3776[/C][C]0.1119[/C][C]0.502[/C][C]0.8956[/C][/ROW]
[ROW][C]83[/C][C]117.1[/C][C]113.0193[/C][C]100.0249[/C][C]126.0137[/C][C]0.2691[/C][C]0.6592[/C][C]0.5012[/C][C]0.9761[/C][/ROW]
[ROW][C]84[/C][C]103.4[/C][C]97.2112[/C][C]84.2168[/C][C]110.2057[/C][C]0.1753[/C][C]0.0014[/C][C]0.5007[/C][C]0.3425[/C][/ROW]
[ROW][C]85[/C][C]96.2[/C][C]99.9065[/C][C]86.912[/C][C]112.901[/C][C]0.2881[/C][C]0.2991[/C][C]0.5004[/C][C]0.5004[/C][/ROW]
[/TABLE]
Source: https://freestatistics.org/blog/index.php?pk=33899&T=1

Globally Unique Identifier (entire table): ba.freestatistics.org/blog/index.php?pk=33899&T=1

As an alternative you can also use a QR Code:  

The GUIDs for individual cells are displayed in the table below:

Univariate ARIMA Extrapolation Forecast
timeY[t]F[t]95% LB95% UBp-value(H0: Y[t] = F[t])P(F[t]>Y[t-1])P(F[t]>Y[t-s])P(F[t]>Y[73])
6195.5-------
62111.4-------
63113-------
64107.5-------
6595.9-------
66106.3-------
67105.2-------
68117.2-------
69106.9-------
70108.2-------
71113-------
7297.2-------
7399.9-------
74108.1114.0776102.3151125.84010.15960.99090.67230.9909
75118.1114.4976102.1339126.86130.2840.84480.59380.9897
76109.1108.391195.5445121.23770.45690.06930.55410.9024
7793.396.406683.4755109.33770.31890.02720.53060.2982
78112.1106.597893.621119.57460.2030.97770.51790.8441
79111.8105.370892.3831118.35850.1660.15490.51030.7955
80112.5117.2998104.3074130.29220.23450.79660.5060.9957
81116.3106.957593.9638119.95120.07940.20160.50350.8565
82110.3108.233595.2392121.22770.37760.11190.5020.8956
83117.1113.0193100.0249126.01370.26910.65920.50120.9761
84103.497.211284.2168110.20570.17530.00140.50070.3425
8596.299.906586.912112.9010.28810.29910.50040.5004


Univariate ARIMA Extrapolation Forecast Performance
time% S.E.PEMAPESq.EMSERMSE
740.0526-0.05240.004435.73172.97761.7256
750.05510.03150.002612.97731.08141.0399
760.06050.00655e-040.50250.04190.2046
770.0684-0.03220.00279.65110.80430.8968
780.06210.05160.004330.2742.52281.5883
790.06290.0610.005141.33433.44451.8559
800.0565-0.04090.003423.03781.91981.3856
810.0620.08730.007387.28237.27352.6969
820.06130.01910.00164.27060.35590.5966
830.05870.03610.00316.65181.38771.178
840.06820.06370.005338.30093.19171.7865
850.0664-0.03710.003113.73811.14481.07

\begin{tabular}{lllllllll}
\hline
Univariate ARIMA Extrapolation Forecast Performance \tabularnewline
time & % S.E. & PE & MAPE & Sq.E & MSE & RMSE \tabularnewline
74 & 0.0526 & -0.0524 & 0.0044 & 35.7317 & 2.9776 & 1.7256 \tabularnewline
75 & 0.0551 & 0.0315 & 0.0026 & 12.9773 & 1.0814 & 1.0399 \tabularnewline
76 & 0.0605 & 0.0065 & 5e-04 & 0.5025 & 0.0419 & 0.2046 \tabularnewline
77 & 0.0684 & -0.0322 & 0.0027 & 9.6511 & 0.8043 & 0.8968 \tabularnewline
78 & 0.0621 & 0.0516 & 0.0043 & 30.274 & 2.5228 & 1.5883 \tabularnewline
79 & 0.0629 & 0.061 & 0.0051 & 41.3343 & 3.4445 & 1.8559 \tabularnewline
80 & 0.0565 & -0.0409 & 0.0034 & 23.0378 & 1.9198 & 1.3856 \tabularnewline
81 & 0.062 & 0.0873 & 0.0073 & 87.2823 & 7.2735 & 2.6969 \tabularnewline
82 & 0.0613 & 0.0191 & 0.0016 & 4.2706 & 0.3559 & 0.5966 \tabularnewline
83 & 0.0587 & 0.0361 & 0.003 & 16.6518 & 1.3877 & 1.178 \tabularnewline
84 & 0.0682 & 0.0637 & 0.0053 & 38.3009 & 3.1917 & 1.7865 \tabularnewline
85 & 0.0664 & -0.0371 & 0.0031 & 13.7381 & 1.1448 & 1.07 \tabularnewline
\hline
\end{tabular}
%Source: https://freestatistics.org/blog/index.php?pk=33899&T=2

[TABLE]
[ROW][C]Univariate ARIMA Extrapolation Forecast Performance[/C][/ROW]
[ROW][C]time[/C][C]% S.E.[/C][C]PE[/C][C]MAPE[/C][C]Sq.E[/C][C]MSE[/C][C]RMSE[/C][/ROW]
[ROW][C]74[/C][C]0.0526[/C][C]-0.0524[/C][C]0.0044[/C][C]35.7317[/C][C]2.9776[/C][C]1.7256[/C][/ROW]
[ROW][C]75[/C][C]0.0551[/C][C]0.0315[/C][C]0.0026[/C][C]12.9773[/C][C]1.0814[/C][C]1.0399[/C][/ROW]
[ROW][C]76[/C][C]0.0605[/C][C]0.0065[/C][C]5e-04[/C][C]0.5025[/C][C]0.0419[/C][C]0.2046[/C][/ROW]
[ROW][C]77[/C][C]0.0684[/C][C]-0.0322[/C][C]0.0027[/C][C]9.6511[/C][C]0.8043[/C][C]0.8968[/C][/ROW]
[ROW][C]78[/C][C]0.0621[/C][C]0.0516[/C][C]0.0043[/C][C]30.274[/C][C]2.5228[/C][C]1.5883[/C][/ROW]
[ROW][C]79[/C][C]0.0629[/C][C]0.061[/C][C]0.0051[/C][C]41.3343[/C][C]3.4445[/C][C]1.8559[/C][/ROW]
[ROW][C]80[/C][C]0.0565[/C][C]-0.0409[/C][C]0.0034[/C][C]23.0378[/C][C]1.9198[/C][C]1.3856[/C][/ROW]
[ROW][C]81[/C][C]0.062[/C][C]0.0873[/C][C]0.0073[/C][C]87.2823[/C][C]7.2735[/C][C]2.6969[/C][/ROW]
[ROW][C]82[/C][C]0.0613[/C][C]0.0191[/C][C]0.0016[/C][C]4.2706[/C][C]0.3559[/C][C]0.5966[/C][/ROW]
[ROW][C]83[/C][C]0.0587[/C][C]0.0361[/C][C]0.003[/C][C]16.6518[/C][C]1.3877[/C][C]1.178[/C][/ROW]
[ROW][C]84[/C][C]0.0682[/C][C]0.0637[/C][C]0.0053[/C][C]38.3009[/C][C]3.1917[/C][C]1.7865[/C][/ROW]
[ROW][C]85[/C][C]0.0664[/C][C]-0.0371[/C][C]0.0031[/C][C]13.7381[/C][C]1.1448[/C][C]1.07[/C][/ROW]
[/TABLE]
Source: https://freestatistics.org/blog/index.php?pk=33899&T=2

Globally Unique Identifier (entire table): ba.freestatistics.org/blog/index.php?pk=33899&T=2

As an alternative you can also use a QR Code:  

The GUIDs for individual cells are displayed in the table below:

Univariate ARIMA Extrapolation Forecast Performance
time% S.E.PEMAPESq.EMSERMSE
740.0526-0.05240.004435.73172.97761.7256
750.05510.03150.002612.97731.08141.0399
760.06050.00655e-040.50250.04190.2046
770.0684-0.03220.00279.65110.80430.8968
780.06210.05160.004330.2742.52281.5883
790.06290.0610.005141.33433.44451.8559
800.0565-0.04090.003423.03781.91981.3856
810.0620.08730.007387.28237.27352.6969
820.06130.01910.00164.27060.35590.5966
830.05870.03610.00316.65181.38771.178
840.06820.06370.005338.30093.19171.7865
850.0664-0.03710.003113.73811.14481.07


Parameters (Session):
par1 = 12 ; par2 = 1 ; par3 = 0 ; par4 = 1 ; par5 = 12 ; par6 = 2 ; par7 = 1 ; par8 = 0 ; par9 = 0 ; par10 = FALSE ;
Parameters (R input):
par1 = 12 ; par2 = 1 ; par3 = 0 ; par4 = 1 ; par5 = 12 ; par6 = 2 ; par7 = 1 ; par8 = 0 ; par9 = 0 ; par10 = FALSE ;
R code (references can be found in the software module):
par1 <- as.numeric(par1) #cut off periods
par2 <- as.numeric(par2) #lambda
par3 <- as.numeric(par3) #degree of non-seasonal differencing
par4 <- as.numeric(par4) #degree of seasonal differencing
par5 <- as.numeric(par5) #seasonal period
par6 <- as.numeric(par6) #p
par7 <- as.numeric(par7) #q
par8 <- as.numeric(par8) #P
par9 <- as.numeric(par9) #Q
if (par10 == 'TRUE') par10 <- TRUE
if (par10 == 'FALSE') par10 <- FALSE
if (par2 == 0) x <- log(x)
if (par2 != 0) x <- x^par2
lx <- length(x)
first <- lx - 2*par1
nx <- lx - par1
nx1 <- nx + 1
fx <- lx - nx
if (fx < 1) {
fx <- par5
nx1 <- lx + fx - 1
first <- lx - 2*fx
}
first <- 1
if (fx < 3) fx <- round(lx/10,0)
(arima.out <- arima(x[1:nx], order=c(par6,par3,par7), seasonal=list(order=c(par8,par4,par9), period=par5), include.mean=par10, method='ML'))
(forecast <- predict(arima.out,fx))
(lb <- forecast$pred - 1.96 * forecast$se)
(ub <- forecast$pred + 1.96 * forecast$se)
if (par2 == 0) {
x <- exp(x)
forecast$pred <- exp(forecast$pred)
lb <- exp(lb)
ub <- exp(ub)
}
if (par2 != 0) {
x <- x^(1/par2)
forecast$pred <- forecast$pred^(1/par2)
lb <- lb^(1/par2)
ub <- ub^(1/par2)
}
if (par2 < 0) {
olb <- lb
lb <- ub
ub <- olb
}
(actandfor <- c(x[1:nx], forecast$pred))
(perc.se <- (ub-forecast$pred)/1.96/forecast$pred)
bitmap(file='test1.png')
opar <- par(mar=c(4,4,2,2),las=1)
ylim <- c( min(x[first:nx],lb), max(x[first:nx],ub))
plot(x,ylim=ylim,type='n',xlim=c(first,lx))
usr <- par('usr')
rect(usr[1],usr[3],nx+1,usr[4],border=NA,col='lemonchiffon')
rect(nx1,usr[3],usr[2],usr[4],border=NA,col='lavender')
abline(h= (-3:3)*2 , col ='gray', lty =3)
polygon( c(nx1:lx,lx:nx1), c(lb,rev(ub)), col = 'orange', lty=2,border=NA)
lines(nx1:lx, lb , lty=2)
lines(nx1:lx, ub , lty=2)
lines(x, lwd=2)
lines(nx1:lx, forecast$pred , lwd=2 , col ='white')
box()
par(opar)
dev.off()
prob.dec <- array(NA, dim=fx)
prob.sdec <- array(NA, dim=fx)
prob.ldec <- array(NA, dim=fx)
prob.pval <- array(NA, dim=fx)
perf.pe <- array(0, dim=fx)
perf.mape <- array(0, dim=fx)
perf.se <- array(0, dim=fx)
perf.mse <- array(0, dim=fx)
perf.rmse <- array(0, dim=fx)
for (i in 1:fx) {
locSD <- (ub[i] - forecast$pred[i]) / 1.96
perf.pe[i] = (x[nx+i] - forecast$pred[i]) / forecast$pred[i]
perf.mape[i] = perf.mape[i] + abs(perf.pe[i])
perf.se[i] = (x[nx+i] - forecast$pred[i])^2
perf.mse[i] = perf.mse[i] + perf.se[i]
prob.dec[i] = pnorm((x[nx+i-1] - forecast$pred[i]) / locSD)
prob.sdec[i] = pnorm((x[nx+i-par5] - forecast$pred[i]) / locSD)
prob.ldec[i] = pnorm((x[nx] - forecast$pred[i]) / locSD)
prob.pval[i] = pnorm(abs(x[nx+i] - forecast$pred[i]) / locSD)
}
perf.mape = perf.mape / fx
perf.mse = perf.mse / fx
perf.rmse = sqrt(perf.mse)
bitmap(file='test2.png')
plot(forecast$pred, pch=19, type='b',main='ARIMA Extrapolation Forecast', ylab='Forecast and 95% CI', xlab='time',ylim=c(min(lb),max(ub)))
dum <- forecast$pred
dum[1:12] <- x[(nx+1):lx]
lines(dum, lty=1)
lines(ub,lty=3)
lines(lb,lty=3)
dev.off()
load(file='createtable')
a<-table.start()
a<-table.row.start(a)
a<-table.element(a,'Univariate ARIMA Extrapolation Forecast',9,TRUE)
a<-table.row.end(a)
a<-table.row.start(a)
a<-table.element(a,'time',1,header=TRUE)
a<-table.element(a,'Y[t]',1,header=TRUE)
a<-table.element(a,'F[t]',1,header=TRUE)
a<-table.element(a,'95% LB',1,header=TRUE)
a<-table.element(a,'95% UB',1,header=TRUE)
a<-table.element(a,'p-value
(H0: Y[t] = F[t])',1,header=TRUE)
a<-table.element(a,'P(F[t]>Y[t-1])',1,header=TRUE)
a<-table.element(a,'P(F[t]>Y[t-s])',1,header=TRUE)
mylab <- paste('P(F[t]>Y[',nx,sep='')
mylab <- paste(mylab,'])',sep='')
a<-table.element(a,mylab,1,header=TRUE)
a<-table.row.end(a)
for (i in (nx-par5):nx) {
a<-table.row.start(a)
a<-table.element(a,i,header=TRUE)
a<-table.element(a,x[i])
a<-table.element(a,'-')
a<-table.row.end(a)
}
for (i in 1:fx) {
a<-table.row.start(a)
a<-table.element(a,nx+i,header=TRUE)
a<-table.element(a,round(x[nx+i],4))
a<-table.element(a,round(forecast$pred[i],4))
a<-table.element(a,round(lb[i],4))
a<-table.element(a,round(ub[i],4))
a<-table.element(a,round((1-prob.pval[i]),4))
a<-table.element(a,round((1-prob.dec[i]),4))
a<-table.element(a,round((1-prob.sdec[i]),4))
a<-table.element(a,round((1-prob.ldec[i]),4))
a<-table.row.end(a)
}
a<-table.end(a)
table.save(a,file='mytable.tab')
a<-table.start()
a<-table.row.start(a)
a<-table.element(a,'Univariate ARIMA Extrapolation Forecast Performance',7,TRUE)
a<-table.row.end(a)
a<-table.row.start(a)
a<-table.element(a,'time',1,header=TRUE)
a<-table.element(a,'% S.E.',1,header=TRUE)
a<-table.element(a,'PE',1,header=TRUE)
a<-table.element(a,'MAPE',1,header=TRUE)
a<-table.element(a,'Sq.E',1,header=TRUE)
a<-table.element(a,'MSE',1,header=TRUE)
a<-table.element(a,'RMSE',1,header=TRUE)
a<-table.row.end(a)
for (i in 1:fx) {
a<-table.row.start(a)
a<-table.element(a,nx+i,header=TRUE)
a<-table.element(a,round(perc.se[i],4))
a<-table.element(a,round(perf.pe[i],4))
a<-table.element(a,round(perf.mape[i],4))
a<-table.element(a,round(perf.se[i],4))
a<-table.element(a,round(perf.mse[i],4))
a<-table.element(a,round(perf.rmse[i],4))
a<-table.row.end(a)
}
a<-table.end(a)
table.save(a,file='mytable1.tab')