Free Statistics

of Irreproducible Research!

Author's title

Author*The author of this computation has been verified*
R Software Modulerwasp_arimaforecasting.wasp
Title produced by softwareARIMA Forecasting
Date of computationMon, 15 Dec 2008 16:16:18 -0700
Cite this page as followsStatistical Computations at FreeStatistics.org, Office for Research Development and Education, URL https://freestatistics.org/blog/index.php?v=date/2008/Dec/16/t1229383194b5rthircwfcgtpm.htm/, Retrieved Thu, 16 May 2024 03:07:17 +0000
Statistical Computations at FreeStatistics.org, Office for Research Development and Education, URL https://freestatistics.org/blog/index.php?pk=33861, Retrieved Thu, 16 May 2024 03:07:17 +0000
QR Codes:

Original text written by user:
IsPrivate?No (this computation is public)
User-defined keywords
Estimated Impact242
Family? (F = Feedback message, R = changed R code, M = changed R Module, P = changed Parameters, D = changed Data)
-     [Central Tendency] [Central Tendency:...] [2008-12-12 13:08:46] [6816386b1f3c2f6c0c9f2aa1e5bc9362]
- RMPD  [Mean Plot] [Mean plot - prijs...] [2008-12-12 14:56:05] [6816386b1f3c2f6c0c9f2aa1e5bc9362]
- RMPD    [Tukey lambda PPCC Plot] [PPCC: Bel 20] [2008-12-12 15:02:48] [6816386b1f3c2f6c0c9f2aa1e5bc9362]
- RMP       [ARIMA Backward Selection] [Arima: Bel 20] [2008-12-14 20:11:31] [6816386b1f3c2f6c0c9f2aa1e5bc9362]
F RMPD        [ARIMA Forecasting] [Arima forecasting...] [2008-12-14 22:14:13] [6816386b1f3c2f6c0c9f2aa1e5bc9362]
F                 [ARIMA Forecasting] [arima forecasting...] [2008-12-15 23:16:18] [e81ac192d6ae6d77191d83851a692999] [Current]
Feedback Forum
2008-12-18 16:08:28 [Gregory Van Overmeiren] [reply
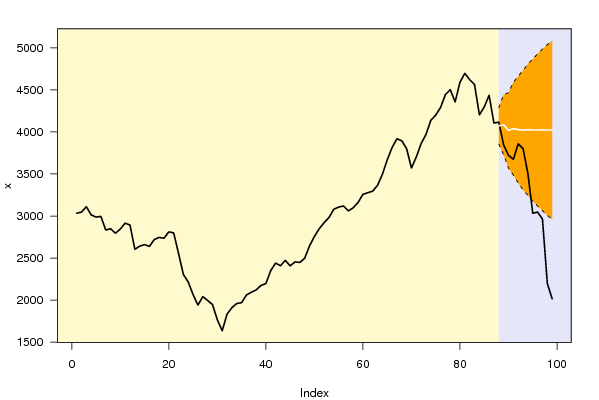
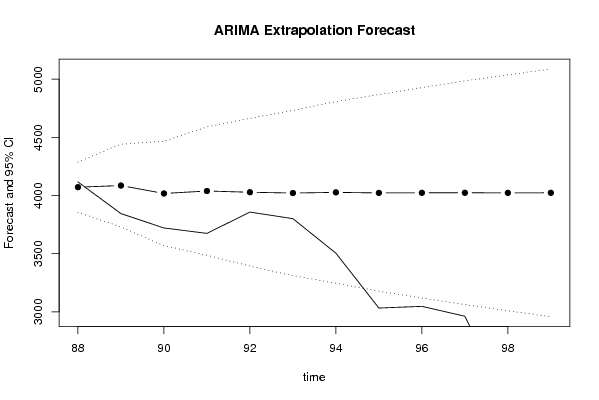
We zien hier in de forecast dat onze voorspelling quasi horizontaal verloopt. We hebben hier te maken met de bel 20 en dus een moeilijk voorspelbare tijdreeks. (als we dit konden voorspellen zou ik miljonair zijn...) De reden waarom de zwarte lijn ( onze werkelijke waarden) buiten onze betrouwbaarheidsintervallen ligt kunnen we toeschrijven aan economische gebeurtenissen zoals de kredietcrisis bijvoorbeeld.

Post a new message
Dataseries X:
3032.93
3045.78
3110.52
3013.24
2987.1
2995.55
2833.18
2848.96
2794.83
2845.26
2915.02
2892.63
2604.42
2641.65
2659.81
2638.53
2720.25
2745.88
2735.7
2811.7
2799.43
2555.28
2304.98
2214.95
2065.81
1940.49
2042
1995.37
1946.81
1765.9
1635.25
1833.42
1910.43
1959.67
1969.6
2061.41
2093.48
2120.88
2174.56
2196.72
2350.44
2440.25
2408.64
2472.81
2407.6
2454.62
2448.05
2497.84
2645.64
2756.76
2849.27
2921.44
2981.85
3080.58
3106.22
3119.31
3061.26
3097.31
3161.69
3257.16
3277.01
3295.32
3363.99
3494.17
3667.03
3813.06
3917.96
3895.51
3801.06
3570.12
3701.61
3862.27
3970.1
4138.52
4199.75
4290.89
4443.91
4502.64
4356.98
4591.27
4696.96
4621.4
4562.84
4202.52
4296.49
4435.23
4105.18
4116.68
3844.49
3720.98
3674.4
3857.62
3801.06
3504.37
3032.6
3047.03
2962.34
2197.82
2014.45


Summary of computational transaction
Raw Inputview raw input (R code)
Raw Outputview raw output of R engine
Computing time5 seconds
R Server'Sir Ronald Aylmer Fisher' @ 193.190.124.24

\begin{tabular}{lllllllll}
\hline
Summary of computational transaction \tabularnewline
Raw Input & view raw input (R code)  \tabularnewline
Raw Output & view raw output of R engine  \tabularnewline
Computing time & 5 seconds \tabularnewline
R Server & 'Sir Ronald Aylmer Fisher' @ 193.190.124.24 \tabularnewline
\hline
\end{tabular}
%Source: https://freestatistics.org/blog/index.php?pk=33861&T=0

[TABLE]
[ROW][C]Summary of computational transaction[/C][/ROW]
[ROW][C]Raw Input[/C][C]view raw input (R code) [/C][/ROW]
[ROW][C]Raw Output[/C][C]view raw output of R engine [/C][/ROW]
[ROW][C]Computing time[/C][C]5 seconds[/C][/ROW]
[ROW][C]R Server[/C][C]'Sir Ronald Aylmer Fisher' @ 193.190.124.24[/C][/ROW]
[/TABLE]
Source: https://freestatistics.org/blog/index.php?pk=33861&T=0

Globally Unique Identifier (entire table): ba.freestatistics.org/blog/index.php?pk=33861&T=0

As an alternative you can also use a QR Code:  

The GUIDs for individual cells are displayed in the table below:

Summary of computational transaction
Raw Inputview raw input (R code)
Raw Outputview raw output of R engine
Computing time5 seconds
R Server'Sir Ronald Aylmer Fisher' @ 193.190.124.24


Univariate ARIMA Extrapolation Forecast
timeY[t]F[t]95% LB95% UBp-value(H0: Y[t] = F[t])P(F[t]>Y[t-1])P(F[t]>Y[t-s])P(F[t]>Y[87])
754199.75-------
764290.89-------
774443.91-------
784502.64-------
794356.98-------
804591.27-------
814696.96-------
824621.4-------
834562.84-------
844202.52-------
854296.49-------
864435.23-------
874105.18-------
884116.684071.73033855.28414288.17650.3420.3810.02360.381
893844.494085.63383729.59654441.6710.09220.43210.02430.4572
903720.984017.55143568.85694466.24590.09760.77520.0170.3509
913674.44038.77043486.97224590.56850.09780.87050.12920.4068
923857.624028.09043393.224662.96080.29930.86260.0410.4059
933801.064021.35373311.04894731.65840.27160.67430.03110.4085
943504.374027.04143245.90244808.18040.09490.71470.06790.4223
953032.64022.3983177.66614867.12990.01080.88530.10490.4238
963047.034023.38153118.57094928.19210.01720.98410.3490.4297
972962.344023.69733062.58984984.80490.01520.97680.2890.434
982197.824022.80033008.64385036.95682e-040.97980.21270.4368
992014.454023.34962958.59185088.10751e-040.99960.44010.4401

\begin{tabular}{lllllllll}
\hline
Univariate ARIMA Extrapolation Forecast \tabularnewline
time & Y[t] & F[t] & 95% LB & 95% UB & p-value(H0: Y[t] = F[t]) & P(F[t]>Y[t-1]) & P(F[t]>Y[t-s]) & P(F[t]>Y[87]) \tabularnewline
75 & 4199.75 & - & - & - & - & - & - & - \tabularnewline
76 & 4290.89 & - & - & - & - & - & - & - \tabularnewline
77 & 4443.91 & - & - & - & - & - & - & - \tabularnewline
78 & 4502.64 & - & - & - & - & - & - & - \tabularnewline
79 & 4356.98 & - & - & - & - & - & - & - \tabularnewline
80 & 4591.27 & - & - & - & - & - & - & - \tabularnewline
81 & 4696.96 & - & - & - & - & - & - & - \tabularnewline
82 & 4621.4 & - & - & - & - & - & - & - \tabularnewline
83 & 4562.84 & - & - & - & - & - & - & - \tabularnewline
84 & 4202.52 & - & - & - & - & - & - & - \tabularnewline
85 & 4296.49 & - & - & - & - & - & - & - \tabularnewline
86 & 4435.23 & - & - & - & - & - & - & - \tabularnewline
87 & 4105.18 & - & - & - & - & - & - & - \tabularnewline
88 & 4116.68 & 4071.7303 & 3855.2841 & 4288.1765 & 0.342 & 0.381 & 0.0236 & 0.381 \tabularnewline
89 & 3844.49 & 4085.6338 & 3729.5965 & 4441.671 & 0.0922 & 0.4321 & 0.0243 & 0.4572 \tabularnewline
90 & 3720.98 & 4017.5514 & 3568.8569 & 4466.2459 & 0.0976 & 0.7752 & 0.017 & 0.3509 \tabularnewline
91 & 3674.4 & 4038.7704 & 3486.9722 & 4590.5685 & 0.0978 & 0.8705 & 0.1292 & 0.4068 \tabularnewline
92 & 3857.62 & 4028.0904 & 3393.22 & 4662.9608 & 0.2993 & 0.8626 & 0.041 & 0.4059 \tabularnewline
93 & 3801.06 & 4021.3537 & 3311.0489 & 4731.6584 & 0.2716 & 0.6743 & 0.0311 & 0.4085 \tabularnewline
94 & 3504.37 & 4027.0414 & 3245.9024 & 4808.1804 & 0.0949 & 0.7147 & 0.0679 & 0.4223 \tabularnewline
95 & 3032.6 & 4022.398 & 3177.6661 & 4867.1299 & 0.0108 & 0.8853 & 0.1049 & 0.4238 \tabularnewline
96 & 3047.03 & 4023.3815 & 3118.5709 & 4928.1921 & 0.0172 & 0.9841 & 0.349 & 0.4297 \tabularnewline
97 & 2962.34 & 4023.6973 & 3062.5898 & 4984.8049 & 0.0152 & 0.9768 & 0.289 & 0.434 \tabularnewline
98 & 2197.82 & 4022.8003 & 3008.6438 & 5036.9568 & 2e-04 & 0.9798 & 0.2127 & 0.4368 \tabularnewline
99 & 2014.45 & 4023.3496 & 2958.5918 & 5088.1075 & 1e-04 & 0.9996 & 0.4401 & 0.4401 \tabularnewline
\hline
\end{tabular}
%Source: https://freestatistics.org/blog/index.php?pk=33861&T=1

[TABLE]
[ROW][C]Univariate ARIMA Extrapolation Forecast[/C][/ROW]
[ROW][C]time[/C][C]Y[t][/C][C]F[t][/C][C]95% LB[/C][C]95% UB[/C][C]p-value(H0: Y[t] = F[t])[/C][C]P(F[t]>Y[t-1])[/C][C]P(F[t]>Y[t-s])[/C][C]P(F[t]>Y[87])[/C][/ROW]
[ROW][C]75[/C][C]4199.75[/C][C]-[/C][C]-[/C][C]-[/C][C]-[/C][C]-[/C][C]-[/C][C]-[/C][/ROW]
[ROW][C]76[/C][C]4290.89[/C][C]-[/C][C]-[/C][C]-[/C][C]-[/C][C]-[/C][C]-[/C][C]-[/C][/ROW]
[ROW][C]77[/C][C]4443.91[/C][C]-[/C][C]-[/C][C]-[/C][C]-[/C][C]-[/C][C]-[/C][C]-[/C][/ROW]
[ROW][C]78[/C][C]4502.64[/C][C]-[/C][C]-[/C][C]-[/C][C]-[/C][C]-[/C][C]-[/C][C]-[/C][/ROW]
[ROW][C]79[/C][C]4356.98[/C][C]-[/C][C]-[/C][C]-[/C][C]-[/C][C]-[/C][C]-[/C][C]-[/C][/ROW]
[ROW][C]80[/C][C]4591.27[/C][C]-[/C][C]-[/C][C]-[/C][C]-[/C][C]-[/C][C]-[/C][C]-[/C][/ROW]
[ROW][C]81[/C][C]4696.96[/C][C]-[/C][C]-[/C][C]-[/C][C]-[/C][C]-[/C][C]-[/C][C]-[/C][/ROW]
[ROW][C]82[/C][C]4621.4[/C][C]-[/C][C]-[/C][C]-[/C][C]-[/C][C]-[/C][C]-[/C][C]-[/C][/ROW]
[ROW][C]83[/C][C]4562.84[/C][C]-[/C][C]-[/C][C]-[/C][C]-[/C][C]-[/C][C]-[/C][C]-[/C][/ROW]
[ROW][C]84[/C][C]4202.52[/C][C]-[/C][C]-[/C][C]-[/C][C]-[/C][C]-[/C][C]-[/C][C]-[/C][/ROW]
[ROW][C]85[/C][C]4296.49[/C][C]-[/C][C]-[/C][C]-[/C][C]-[/C][C]-[/C][C]-[/C][C]-[/C][/ROW]
[ROW][C]86[/C][C]4435.23[/C][C]-[/C][C]-[/C][C]-[/C][C]-[/C][C]-[/C][C]-[/C][C]-[/C][/ROW]
[ROW][C]87[/C][C]4105.18[/C][C]-[/C][C]-[/C][C]-[/C][C]-[/C][C]-[/C][C]-[/C][C]-[/C][/ROW]
[ROW][C]88[/C][C]4116.68[/C][C]4071.7303[/C][C]3855.2841[/C][C]4288.1765[/C][C]0.342[/C][C]0.381[/C][C]0.0236[/C][C]0.381[/C][/ROW]
[ROW][C]89[/C][C]3844.49[/C][C]4085.6338[/C][C]3729.5965[/C][C]4441.671[/C][C]0.0922[/C][C]0.4321[/C][C]0.0243[/C][C]0.4572[/C][/ROW]
[ROW][C]90[/C][C]3720.98[/C][C]4017.5514[/C][C]3568.8569[/C][C]4466.2459[/C][C]0.0976[/C][C]0.7752[/C][C]0.017[/C][C]0.3509[/C][/ROW]
[ROW][C]91[/C][C]3674.4[/C][C]4038.7704[/C][C]3486.9722[/C][C]4590.5685[/C][C]0.0978[/C][C]0.8705[/C][C]0.1292[/C][C]0.4068[/C][/ROW]
[ROW][C]92[/C][C]3857.62[/C][C]4028.0904[/C][C]3393.22[/C][C]4662.9608[/C][C]0.2993[/C][C]0.8626[/C][C]0.041[/C][C]0.4059[/C][/ROW]
[ROW][C]93[/C][C]3801.06[/C][C]4021.3537[/C][C]3311.0489[/C][C]4731.6584[/C][C]0.2716[/C][C]0.6743[/C][C]0.0311[/C][C]0.4085[/C][/ROW]
[ROW][C]94[/C][C]3504.37[/C][C]4027.0414[/C][C]3245.9024[/C][C]4808.1804[/C][C]0.0949[/C][C]0.7147[/C][C]0.0679[/C][C]0.4223[/C][/ROW]
[ROW][C]95[/C][C]3032.6[/C][C]4022.398[/C][C]3177.6661[/C][C]4867.1299[/C][C]0.0108[/C][C]0.8853[/C][C]0.1049[/C][C]0.4238[/C][/ROW]
[ROW][C]96[/C][C]3047.03[/C][C]4023.3815[/C][C]3118.5709[/C][C]4928.1921[/C][C]0.0172[/C][C]0.9841[/C][C]0.349[/C][C]0.4297[/C][/ROW]
[ROW][C]97[/C][C]2962.34[/C][C]4023.6973[/C][C]3062.5898[/C][C]4984.8049[/C][C]0.0152[/C][C]0.9768[/C][C]0.289[/C][C]0.434[/C][/ROW]
[ROW][C]98[/C][C]2197.82[/C][C]4022.8003[/C][C]3008.6438[/C][C]5036.9568[/C][C]2e-04[/C][C]0.9798[/C][C]0.2127[/C][C]0.4368[/C][/ROW]
[ROW][C]99[/C][C]2014.45[/C][C]4023.3496[/C][C]2958.5918[/C][C]5088.1075[/C][C]1e-04[/C][C]0.9996[/C][C]0.4401[/C][C]0.4401[/C][/ROW]
[/TABLE]
Source: https://freestatistics.org/blog/index.php?pk=33861&T=1

Globally Unique Identifier (entire table): ba.freestatistics.org/blog/index.php?pk=33861&T=1

As an alternative you can also use a QR Code:  

The GUIDs for individual cells are displayed in the table below:

Univariate ARIMA Extrapolation Forecast
timeY[t]F[t]95% LB95% UBp-value(H0: Y[t] = F[t])P(F[t]>Y[t-1])P(F[t]>Y[t-s])P(F[t]>Y[87])
754199.75-------
764290.89-------
774443.91-------
784502.64-------
794356.98-------
804591.27-------
814696.96-------
824621.4-------
834562.84-------
844202.52-------
854296.49-------
864435.23-------
874105.18-------
884116.684071.73033855.28414288.17650.3420.3810.02360.381
893844.494085.63383729.59654441.6710.09220.43210.02430.4572
903720.984017.55143568.85694466.24590.09760.77520.0170.3509
913674.44038.77043486.97224590.56850.09780.87050.12920.4068
923857.624028.09043393.224662.96080.29930.86260.0410.4059
933801.064021.35373311.04894731.65840.27160.67430.03110.4085
943504.374027.04143245.90244808.18040.09490.71470.06790.4223
953032.64022.3983177.66614867.12990.01080.88530.10490.4238
963047.034023.38153118.57094928.19210.01720.98410.3490.4297
972962.344023.69733062.58984984.80490.01520.97680.2890.434
982197.824022.80033008.64385036.95682e-040.97980.21270.4368
992014.454023.34962958.59185088.10751e-040.99960.44010.4401


Univariate ARIMA Extrapolation Forecast Performance
time% S.E.PEMAPESq.EMSERMSE
880.02710.0119e-042020.4739168.372812.9759
890.0445-0.0590.004958150.31574845.859669.6122
900.057-0.07380.006287954.60197329.550285.6128
910.0697-0.09020.0075132765.774411063.8145105.1847
920.0804-0.04230.003529060.14612421.678849.2106
930.0901-0.05480.004648529.29374044.107863.5933
940.099-0.12980.0108273185.393722765.4495150.8822
950.1071-0.24610.0205979700.110781641.6759285.7301
960.1147-0.24270.0202953262.266379438.5222281.8484
970.1219-0.26380.0221126479.385493873.2821306.3875
980.1286-0.45370.03783330553.1059277546.0922526.8264
990.135-0.49930.04164035677.6962336306.4747579.9194

\begin{tabular}{lllllllll}
\hline
Univariate ARIMA Extrapolation Forecast Performance \tabularnewline
time & % S.E. & PE & MAPE & Sq.E & MSE & RMSE \tabularnewline
88 & 0.0271 & 0.011 & 9e-04 & 2020.4739 & 168.3728 & 12.9759 \tabularnewline
89 & 0.0445 & -0.059 & 0.0049 & 58150.3157 & 4845.8596 & 69.6122 \tabularnewline
90 & 0.057 & -0.0738 & 0.0062 & 87954.6019 & 7329.5502 & 85.6128 \tabularnewline
91 & 0.0697 & -0.0902 & 0.0075 & 132765.7744 & 11063.8145 & 105.1847 \tabularnewline
92 & 0.0804 & -0.0423 & 0.0035 & 29060.1461 & 2421.6788 & 49.2106 \tabularnewline
93 & 0.0901 & -0.0548 & 0.0046 & 48529.2937 & 4044.1078 & 63.5933 \tabularnewline
94 & 0.099 & -0.1298 & 0.0108 & 273185.3937 & 22765.4495 & 150.8822 \tabularnewline
95 & 0.1071 & -0.2461 & 0.0205 & 979700.1107 & 81641.6759 & 285.7301 \tabularnewline
96 & 0.1147 & -0.2427 & 0.0202 & 953262.2663 & 79438.5222 & 281.8484 \tabularnewline
97 & 0.1219 & -0.2638 & 0.022 & 1126479.3854 & 93873.2821 & 306.3875 \tabularnewline
98 & 0.1286 & -0.4537 & 0.0378 & 3330553.1059 & 277546.0922 & 526.8264 \tabularnewline
99 & 0.135 & -0.4993 & 0.0416 & 4035677.6962 & 336306.4747 & 579.9194 \tabularnewline
\hline
\end{tabular}
%Source: https://freestatistics.org/blog/index.php?pk=33861&T=2

[TABLE]
[ROW][C]Univariate ARIMA Extrapolation Forecast Performance[/C][/ROW]
[ROW][C]time[/C][C]% S.E.[/C][C]PE[/C][C]MAPE[/C][C]Sq.E[/C][C]MSE[/C][C]RMSE[/C][/ROW]
[ROW][C]88[/C][C]0.0271[/C][C]0.011[/C][C]9e-04[/C][C]2020.4739[/C][C]168.3728[/C][C]12.9759[/C][/ROW]
[ROW][C]89[/C][C]0.0445[/C][C]-0.059[/C][C]0.0049[/C][C]58150.3157[/C][C]4845.8596[/C][C]69.6122[/C][/ROW]
[ROW][C]90[/C][C]0.057[/C][C]-0.0738[/C][C]0.0062[/C][C]87954.6019[/C][C]7329.5502[/C][C]85.6128[/C][/ROW]
[ROW][C]91[/C][C]0.0697[/C][C]-0.0902[/C][C]0.0075[/C][C]132765.7744[/C][C]11063.8145[/C][C]105.1847[/C][/ROW]
[ROW][C]92[/C][C]0.0804[/C][C]-0.0423[/C][C]0.0035[/C][C]29060.1461[/C][C]2421.6788[/C][C]49.2106[/C][/ROW]
[ROW][C]93[/C][C]0.0901[/C][C]-0.0548[/C][C]0.0046[/C][C]48529.2937[/C][C]4044.1078[/C][C]63.5933[/C][/ROW]
[ROW][C]94[/C][C]0.099[/C][C]-0.1298[/C][C]0.0108[/C][C]273185.3937[/C][C]22765.4495[/C][C]150.8822[/C][/ROW]
[ROW][C]95[/C][C]0.1071[/C][C]-0.2461[/C][C]0.0205[/C][C]979700.1107[/C][C]81641.6759[/C][C]285.7301[/C][/ROW]
[ROW][C]96[/C][C]0.1147[/C][C]-0.2427[/C][C]0.0202[/C][C]953262.2663[/C][C]79438.5222[/C][C]281.8484[/C][/ROW]
[ROW][C]97[/C][C]0.1219[/C][C]-0.2638[/C][C]0.022[/C][C]1126479.3854[/C][C]93873.2821[/C][C]306.3875[/C][/ROW]
[ROW][C]98[/C][C]0.1286[/C][C]-0.4537[/C][C]0.0378[/C][C]3330553.1059[/C][C]277546.0922[/C][C]526.8264[/C][/ROW]
[ROW][C]99[/C][C]0.135[/C][C]-0.4993[/C][C]0.0416[/C][C]4035677.6962[/C][C]336306.4747[/C][C]579.9194[/C][/ROW]
[/TABLE]
Source: https://freestatistics.org/blog/index.php?pk=33861&T=2

Globally Unique Identifier (entire table): ba.freestatistics.org/blog/index.php?pk=33861&T=2

As an alternative you can also use a QR Code:  

The GUIDs for individual cells are displayed in the table below:

Univariate ARIMA Extrapolation Forecast Performance
time% S.E.PEMAPESq.EMSERMSE
880.02710.0119e-042020.4739168.372812.9759
890.0445-0.0590.004958150.31574845.859669.6122
900.057-0.07380.006287954.60197329.550285.6128
910.0697-0.09020.0075132765.774411063.8145105.1847
920.0804-0.04230.003529060.14612421.678849.2106
930.0901-0.05480.004648529.29374044.107863.5933
940.099-0.12980.0108273185.393722765.4495150.8822
950.1071-0.24610.0205979700.110781641.6759285.7301
960.1147-0.24270.0202953262.266379438.5222281.8484
970.1219-0.26380.0221126479.385493873.2821306.3875
980.1286-0.45370.03783330553.1059277546.0922526.8264
990.135-0.49930.04164035677.6962336306.4747579.9194


Parameters (Session):
par1 = 12 ; par2 = 1 ; par3 = 1 ; par4 = 0 ; par5 = 12 ; par6 = 3 ; par7 = 1 ; par8 = 0 ; par9 = 0 ; par10 = FALSE ;
Parameters (R input):
par1 = 12 ; par2 = 1 ; par3 = 1 ; par4 = 0 ; par5 = 12 ; par6 = 3 ; par7 = 1 ; par8 = 0 ; par9 = 0 ; par10 = FALSE ; par11 = ; par12 = ; par13 = ; par14 = ; par15 = ; par16 = ; par17 = ; par18 = ; par19 = ; par20 = ;
R code (references can be found in the software module):
par1 <- as.numeric(par1) #cut off periods
par2 <- as.numeric(par2) #lambda
par3 <- as.numeric(par3) #degree of non-seasonal differencing
par4 <- as.numeric(par4) #degree of seasonal differencing
par5 <- as.numeric(par5) #seasonal period
par6 <- as.numeric(par6) #p
par7 <- as.numeric(par7) #q
par8 <- as.numeric(par8) #P
par9 <- as.numeric(par9) #Q
if (par10 == 'TRUE') par10 <- TRUE
if (par10 == 'FALSE') par10 <- FALSE
if (par2 == 0) x <- log(x)
if (par2 != 0) x <- x^par2
lx <- length(x)
first <- lx - 2*par1
nx <- lx - par1
nx1 <- nx + 1
fx <- lx - nx
if (fx < 1) {
fx <- par5
nx1 <- lx + fx - 1
first <- lx - 2*fx
}
first <- 1
if (fx < 3) fx <- round(lx/10,0)
(arima.out <- arima(x[1:nx], order=c(par6,par3,par7), seasonal=list(order=c(par8,par4,par9), period=par5), include.mean=par10, method='ML'))
(forecast <- predict(arima.out,fx))
(lb <- forecast$pred - 1.96 * forecast$se)
(ub <- forecast$pred + 1.96 * forecast$se)
if (par2 == 0) {
x <- exp(x)
forecast$pred <- exp(forecast$pred)
lb <- exp(lb)
ub <- exp(ub)
}
if (par2 != 0) {
x <- x^(1/par2)
forecast$pred <- forecast$pred^(1/par2)
lb <- lb^(1/par2)
ub <- ub^(1/par2)
}
if (par2 < 0) {
olb <- lb
lb <- ub
ub <- olb
}
(actandfor <- c(x[1:nx], forecast$pred))
(perc.se <- (ub-forecast$pred)/1.96/forecast$pred)
bitmap(file='test1.png')
opar <- par(mar=c(4,4,2,2),las=1)
ylim <- c( min(x[first:nx],lb), max(x[first:nx],ub))
plot(x,ylim=ylim,type='n',xlim=c(first,lx))
usr <- par('usr')
rect(usr[1],usr[3],nx+1,usr[4],border=NA,col='lemonchiffon')
rect(nx1,usr[3],usr[2],usr[4],border=NA,col='lavender')
abline(h= (-3:3)*2 , col ='gray', lty =3)
polygon( c(nx1:lx,lx:nx1), c(lb,rev(ub)), col = 'orange', lty=2,border=NA)
lines(nx1:lx, lb , lty=2)
lines(nx1:lx, ub , lty=2)
lines(x, lwd=2)
lines(nx1:lx, forecast$pred , lwd=2 , col ='white')
box()
par(opar)
dev.off()
prob.dec <- array(NA, dim=fx)
prob.sdec <- array(NA, dim=fx)
prob.ldec <- array(NA, dim=fx)
prob.pval <- array(NA, dim=fx)
perf.pe <- array(0, dim=fx)
perf.mape <- array(0, dim=fx)
perf.se <- array(0, dim=fx)
perf.mse <- array(0, dim=fx)
perf.rmse <- array(0, dim=fx)
for (i in 1:fx) {
locSD <- (ub[i] - forecast$pred[i]) / 1.96
perf.pe[i] = (x[nx+i] - forecast$pred[i]) / forecast$pred[i]
perf.mape[i] = perf.mape[i] + abs(perf.pe[i])
perf.se[i] = (x[nx+i] - forecast$pred[i])^2
perf.mse[i] = perf.mse[i] + perf.se[i]
prob.dec[i] = pnorm((x[nx+i-1] - forecast$pred[i]) / locSD)
prob.sdec[i] = pnorm((x[nx+i-par5] - forecast$pred[i]) / locSD)
prob.ldec[i] = pnorm((x[nx] - forecast$pred[i]) / locSD)
prob.pval[i] = pnorm(abs(x[nx+i] - forecast$pred[i]) / locSD)
}
perf.mape = perf.mape / fx
perf.mse = perf.mse / fx
perf.rmse = sqrt(perf.mse)
bitmap(file='test2.png')
plot(forecast$pred, pch=19, type='b',main='ARIMA Extrapolation Forecast', ylab='Forecast and 95% CI', xlab='time',ylim=c(min(lb),max(ub)))
dum <- forecast$pred
dum[1:12] <- x[(nx+1):lx]
lines(dum, lty=1)
lines(ub,lty=3)
lines(lb,lty=3)
dev.off()
load(file='createtable')
a<-table.start()
a<-table.row.start(a)
a<-table.element(a,'Univariate ARIMA Extrapolation Forecast',9,TRUE)
a<-table.row.end(a)
a<-table.row.start(a)
a<-table.element(a,'time',1,header=TRUE)
a<-table.element(a,'Y[t]',1,header=TRUE)
a<-table.element(a,'F[t]',1,header=TRUE)
a<-table.element(a,'95% LB',1,header=TRUE)
a<-table.element(a,'95% UB',1,header=TRUE)
a<-table.element(a,'p-value
(H0: Y[t] = F[t])',1,header=TRUE)
a<-table.element(a,'P(F[t]>Y[t-1])',1,header=TRUE)
a<-table.element(a,'P(F[t]>Y[t-s])',1,header=TRUE)
mylab <- paste('P(F[t]>Y[',nx,sep='')
mylab <- paste(mylab,'])',sep='')
a<-table.element(a,mylab,1,header=TRUE)
a<-table.row.end(a)
for (i in (nx-par5):nx) {
a<-table.row.start(a)
a<-table.element(a,i,header=TRUE)
a<-table.element(a,x[i])
a<-table.element(a,'-')
a<-table.row.end(a)
}
for (i in 1:fx) {
a<-table.row.start(a)
a<-table.element(a,nx+i,header=TRUE)
a<-table.element(a,round(x[nx+i],4))
a<-table.element(a,round(forecast$pred[i],4))
a<-table.element(a,round(lb[i],4))
a<-table.element(a,round(ub[i],4))
a<-table.element(a,round((1-prob.pval[i]),4))
a<-table.element(a,round((1-prob.dec[i]),4))
a<-table.element(a,round((1-prob.sdec[i]),4))
a<-table.element(a,round((1-prob.ldec[i]),4))
a<-table.row.end(a)
}
a<-table.end(a)
table.save(a,file='mytable.tab')
a<-table.start()
a<-table.row.start(a)
a<-table.element(a,'Univariate ARIMA Extrapolation Forecast Performance',7,TRUE)
a<-table.row.end(a)
a<-table.row.start(a)
a<-table.element(a,'time',1,header=TRUE)
a<-table.element(a,'% S.E.',1,header=TRUE)
a<-table.element(a,'PE',1,header=TRUE)
a<-table.element(a,'MAPE',1,header=TRUE)
a<-table.element(a,'Sq.E',1,header=TRUE)
a<-table.element(a,'MSE',1,header=TRUE)
a<-table.element(a,'RMSE',1,header=TRUE)
a<-table.row.end(a)
for (i in 1:fx) {
a<-table.row.start(a)
a<-table.element(a,nx+i,header=TRUE)
a<-table.element(a,round(perc.se[i],4))
a<-table.element(a,round(perf.pe[i],4))
a<-table.element(a,round(perf.mape[i],4))
a<-table.element(a,round(perf.se[i],4))
a<-table.element(a,round(perf.mse[i],4))
a<-table.element(a,round(perf.rmse[i],4))
a<-table.row.end(a)
}
a<-table.end(a)
table.save(a,file='mytable1.tab')