Free Statistics

of Irreproducible Research!

Author's title

Author*The author of this computation has been verified*
R Software Modulerwasp_arimaforecasting.wasp
Title produced by softwareARIMA Forecasting
Date of computationMon, 15 Dec 2008 15:45:01 -0700
Cite this page as followsStatistical Computations at FreeStatistics.org, Office for Research Development and Education, URL https://freestatistics.org/blog/index.php?v=date/2008/Dec/15/t1229381163o81fgvb2pxntwn2.htm/, Retrieved Wed, 15 May 2024 02:06:20 +0000
Statistical Computations at FreeStatistics.org, Office for Research Development and Education, URL https://freestatistics.org/blog/index.php?pk=33847, Retrieved Wed, 15 May 2024 02:06:20 +0000
QR Codes:

Original text written by user:
IsPrivate?No (this computation is public)
User-defined keywords
Estimated Impact207
Family? (F = Feedback message, R = changed R code, M = changed R Module, P = changed Parameters, D = changed Data)
F     [ARIMA Forecasting] [ARIMA Forecasting] [2008-12-15 12:59:24] [1ce0d16c8f4225c977b42c8fa93bc163]
F         [ARIMA Forecasting] [ARIMA] [2008-12-15 22:45:01] [d96f761aa3e94002e7c05c3c847d2c79] [Current]
- RMPD      [Standard Deviation-Mean Plot] [feedback op blog] [2008-12-19 12:44:53] [b635de6fc42b001d22cbe6e730fec936]
-   PD      [ARIMA Forecasting] [feedback op blog] [2008-12-19 12:58:39] [b635de6fc42b001d22cbe6e730fec936]
Feedback Forum
2008-12-19 13:04:51 [Bas van Keken] [reply
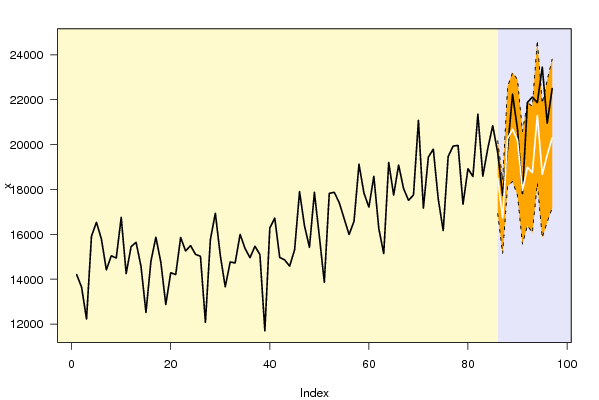
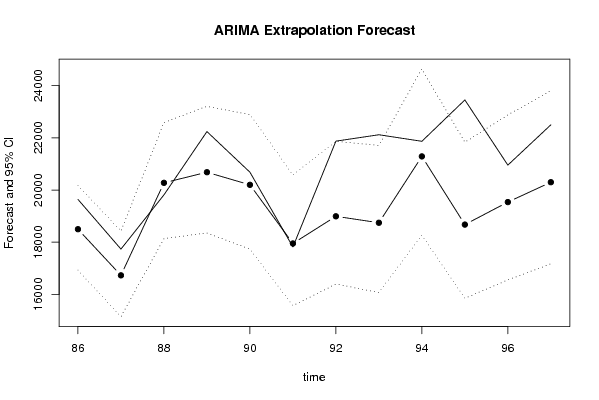
De voorspelling loopt redelijk gelijk met de werkelijke waarden. Het is wel moeilijk te zien dat de volledige lijn niet binnen het betrouwbaarheidsinterval van 95% valt. Dit kan worden gecontroleerd in de Univariate ARIMA Extrapolation Forecast tabel waarbij de Y(t) binnen de 95% LB en 95% UB moet vallen. Dit is hier niet het geval, dus moet er geprobeerd worden om dit te bekomen doormiddel van het veranderen van de parameters.

Verder is te zien dat de forecast van 18497 naar 20297 evolueert.
De standaardfout wordt ooksteeds groter. Dit is logisch omdat de waarschijnlijkheid dat de voorspelling juist is afneemt. In principe moet deze onder de 5% zitten om een significant juiste voorspelling. In uw geval verschilt het niet erg veel maar toch voor het grootste gedeelte.

De afstanden zijn erg klein dat de Yt buiten de marges van Ft zal vallen. Dit is te zien aan de lage pwaarden bij Y(t-1) P(F[t]>Y[t-1]). Deze zijn zeer klein en dat betekent dat de reeks erg dicht op de 95% inteval lijn zit.
Op de aangegeven 93ste en 95ste periode (niet lag) schiet hij erboven uit.
Y(t-s) P(F[t]>Y[t-s]) = kans op stijging in zelfde maand, een jaar terug
De kans dat de forecast groter is dan de zelfde maand een jaar terug is aanzienlijk groter. Dit kan mede verklaard worden door de stijgende trend.

De Lambdawaarde die ik bekom met de reeks is 0.0599829674600605 (0.06)
http://www.freestatistics.org/blog/index.php?v=date/2008/Dec/19/t12296907521agdiog1cltkzof.htm

Dan krijg ik in de ABS:
AR3
SMA1
SAR2 (ruimte interpretatie)

Bij het invoeren van deze parameters wordt de forecast geleidelijk beter. Er is nu nog 1 kleine piek van de Yt boven de Upper Bound.
Zie de volgende link voor een hercomputatie vd forecast:
http://www.freestatistics.org/blog/index.php?v=date/2008/Dec/19/t1229691549h10zdl53ys8s9y3.htm

Post a new message
Dataseries X:
14211
13646,8
12224,6
15916,4
16535,9
15796
14418,6
15044,5
14944,2
16754,8
14254
15454,9
15644,8
14568,3
12520,2
14803
15873,2
14755,3
12875,1
14291,1
14205,3
15859,4
15258,9
15498,6
15106,5
15023,6
12083
15761,3
16943
15070,3
13659,6
14768,9
14725,1
15998,1
15370,6
14956,9
15469,7
15101,8
11703,7
16283,6
16726,5
14968,9
14861
14583,3
15305,8
17903,9
16379,4
15420,3
17870,5
15912,8
13866,5
17823,2
17872
17420,4
16704,4
15991,2
16583,6
19123,5
17838,7
17209,4
18586,5
16258,1
15141,6
19202,1
17746,5
19090,1
18040,3
17515,5
17751,8
21072,4
17170
19439,5
19795,4
17574,9
16165,4
19464,6
19932,1
19961,2
17343,4
18924,2
18574,1
21350,6
18594,6
19823,1
20844,4
19640,2
17735,4
19813,6
22238,5
20682,2
17818,6
21872,1
22117
21865,9
23451,3
20953,7
22497,3


Summary of computational transaction
Raw Inputview raw input (R code)
Raw Outputview raw output of R engine
Computing time3 seconds
R Server'Sir Ronald Aylmer Fisher' @ 193.190.124.24

\begin{tabular}{lllllllll}
\hline
Summary of computational transaction \tabularnewline
Raw Input & view raw input (R code)  \tabularnewline
Raw Output & view raw output of R engine  \tabularnewline
Computing time & 3 seconds \tabularnewline
R Server & 'Sir Ronald Aylmer Fisher' @ 193.190.124.24 \tabularnewline
\hline
\end{tabular}
%Source: https://freestatistics.org/blog/index.php?pk=33847&T=0

[TABLE]
[ROW][C]Summary of computational transaction[/C][/ROW]
[ROW][C]Raw Input[/C][C]view raw input (R code) [/C][/ROW]
[ROW][C]Raw Output[/C][C]view raw output of R engine [/C][/ROW]
[ROW][C]Computing time[/C][C]3 seconds[/C][/ROW]
[ROW][C]R Server[/C][C]'Sir Ronald Aylmer Fisher' @ 193.190.124.24[/C][/ROW]
[/TABLE]
Source: https://freestatistics.org/blog/index.php?pk=33847&T=0

Globally Unique Identifier (entire table): ba.freestatistics.org/blog/index.php?pk=33847&T=0

As an alternative you can also use a QR Code:  

The GUIDs for individual cells are displayed in the table below:

Summary of computational transaction
Raw Inputview raw input (R code)
Raw Outputview raw output of R engine
Computing time3 seconds
R Server'Sir Ronald Aylmer Fisher' @ 193.190.124.24


Univariate ARIMA Extrapolation Forecast
timeY[t]F[t]95% LB95% UBp-value(H0: Y[t] = F[t])P(F[t]>Y[t-1])P(F[t]>Y[t-s])P(F[t]>Y[85])
7319795.4-------
7417574.9-------
7516165.4-------
7619464.6-------
7719932.1-------
7819961.2-------
7917343.4-------
8018924.2-------
8118574.1-------
8221350.6-------
8318594.6-------
8419823.1-------
8520844.4-------
8619640.218497.523216925.832120168.63230.09010.0030.86040.003
8717735.416729.304915146.820218424.04240.12234e-040.74290
8819813.620274.83818136.024822584.25360.34770.98440.75420.3144
8922238.520680.789618355.392323204.95140.11320.74960.71950.4495
9020682.220198.120917733.562522892.97810.36240.06890.56840.3192
9117818.617951.022515567.966420578.38660.46070.02080.67480.0154
9221872.118991.463716393.781621864.40670.02470.78820.51830.1031
932211718744.983116076.009821709.6570.01290.01930.5450.0826
9421865.921287.805618269.924638.46080.36760.31380.48530.6023
9523451.318674.393715852.519521830.37370.00150.02370.51980.0889
9620953.719537.043916553.95722877.46530.20290.01080.43340.2215
9722497.320297.863117171.566923802.31760.10930.35690.37990.3799

\begin{tabular}{lllllllll}
\hline
Univariate ARIMA Extrapolation Forecast \tabularnewline
time & Y[t] & F[t] & 95% LB & 95% UB & p-value(H0: Y[t] = F[t]) & P(F[t]>Y[t-1]) & P(F[t]>Y[t-s]) & P(F[t]>Y[85]) \tabularnewline
73 & 19795.4 & - & - & - & - & - & - & - \tabularnewline
74 & 17574.9 & - & - & - & - & - & - & - \tabularnewline
75 & 16165.4 & - & - & - & - & - & - & - \tabularnewline
76 & 19464.6 & - & - & - & - & - & - & - \tabularnewline
77 & 19932.1 & - & - & - & - & - & - & - \tabularnewline
78 & 19961.2 & - & - & - & - & - & - & - \tabularnewline
79 & 17343.4 & - & - & - & - & - & - & - \tabularnewline
80 & 18924.2 & - & - & - & - & - & - & - \tabularnewline
81 & 18574.1 & - & - & - & - & - & - & - \tabularnewline
82 & 21350.6 & - & - & - & - & - & - & - \tabularnewline
83 & 18594.6 & - & - & - & - & - & - & - \tabularnewline
84 & 19823.1 & - & - & - & - & - & - & - \tabularnewline
85 & 20844.4 & - & - & - & - & - & - & - \tabularnewline
86 & 19640.2 & 18497.5232 & 16925.8321 & 20168.6323 & 0.0901 & 0.003 & 0.8604 & 0.003 \tabularnewline
87 & 17735.4 & 16729.3049 & 15146.8202 & 18424.0424 & 0.1223 & 4e-04 & 0.7429 & 0 \tabularnewline
88 & 19813.6 & 20274.838 & 18136.0248 & 22584.2536 & 0.3477 & 0.9844 & 0.7542 & 0.3144 \tabularnewline
89 & 22238.5 & 20680.7896 & 18355.3923 & 23204.9514 & 0.1132 & 0.7496 & 0.7195 & 0.4495 \tabularnewline
90 & 20682.2 & 20198.1209 & 17733.5625 & 22892.9781 & 0.3624 & 0.0689 & 0.5684 & 0.3192 \tabularnewline
91 & 17818.6 & 17951.0225 & 15567.9664 & 20578.3866 & 0.4607 & 0.0208 & 0.6748 & 0.0154 \tabularnewline
92 & 21872.1 & 18991.4637 & 16393.7816 & 21864.4067 & 0.0247 & 0.7882 & 0.5183 & 0.1031 \tabularnewline
93 & 22117 & 18744.9831 & 16076.0098 & 21709.657 & 0.0129 & 0.0193 & 0.545 & 0.0826 \tabularnewline
94 & 21865.9 & 21287.8056 & 18269.9 & 24638.4608 & 0.3676 & 0.3138 & 0.4853 & 0.6023 \tabularnewline
95 & 23451.3 & 18674.3937 & 15852.5195 & 21830.3737 & 0.0015 & 0.0237 & 0.5198 & 0.0889 \tabularnewline
96 & 20953.7 & 19537.0439 & 16553.957 & 22877.4653 & 0.2029 & 0.0108 & 0.4334 & 0.2215 \tabularnewline
97 & 22497.3 & 20297.8631 & 17171.5669 & 23802.3176 & 0.1093 & 0.3569 & 0.3799 & 0.3799 \tabularnewline
\hline
\end{tabular}
%Source: https://freestatistics.org/blog/index.php?pk=33847&T=1

[TABLE]
[ROW][C]Univariate ARIMA Extrapolation Forecast[/C][/ROW]
[ROW][C]time[/C][C]Y[t][/C][C]F[t][/C][C]95% LB[/C][C]95% UB[/C][C]p-value(H0: Y[t] = F[t])[/C][C]P(F[t]>Y[t-1])[/C][C]P(F[t]>Y[t-s])[/C][C]P(F[t]>Y[85])[/C][/ROW]
[ROW][C]73[/C][C]19795.4[/C][C]-[/C][C]-[/C][C]-[/C][C]-[/C][C]-[/C][C]-[/C][C]-[/C][/ROW]
[ROW][C]74[/C][C]17574.9[/C][C]-[/C][C]-[/C][C]-[/C][C]-[/C][C]-[/C][C]-[/C][C]-[/C][/ROW]
[ROW][C]75[/C][C]16165.4[/C][C]-[/C][C]-[/C][C]-[/C][C]-[/C][C]-[/C][C]-[/C][C]-[/C][/ROW]
[ROW][C]76[/C][C]19464.6[/C][C]-[/C][C]-[/C][C]-[/C][C]-[/C][C]-[/C][C]-[/C][C]-[/C][/ROW]
[ROW][C]77[/C][C]19932.1[/C][C]-[/C][C]-[/C][C]-[/C][C]-[/C][C]-[/C][C]-[/C][C]-[/C][/ROW]
[ROW][C]78[/C][C]19961.2[/C][C]-[/C][C]-[/C][C]-[/C][C]-[/C][C]-[/C][C]-[/C][C]-[/C][/ROW]
[ROW][C]79[/C][C]17343.4[/C][C]-[/C][C]-[/C][C]-[/C][C]-[/C][C]-[/C][C]-[/C][C]-[/C][/ROW]
[ROW][C]80[/C][C]18924.2[/C][C]-[/C][C]-[/C][C]-[/C][C]-[/C][C]-[/C][C]-[/C][C]-[/C][/ROW]
[ROW][C]81[/C][C]18574.1[/C][C]-[/C][C]-[/C][C]-[/C][C]-[/C][C]-[/C][C]-[/C][C]-[/C][/ROW]
[ROW][C]82[/C][C]21350.6[/C][C]-[/C][C]-[/C][C]-[/C][C]-[/C][C]-[/C][C]-[/C][C]-[/C][/ROW]
[ROW][C]83[/C][C]18594.6[/C][C]-[/C][C]-[/C][C]-[/C][C]-[/C][C]-[/C][C]-[/C][C]-[/C][/ROW]
[ROW][C]84[/C][C]19823.1[/C][C]-[/C][C]-[/C][C]-[/C][C]-[/C][C]-[/C][C]-[/C][C]-[/C][/ROW]
[ROW][C]85[/C][C]20844.4[/C][C]-[/C][C]-[/C][C]-[/C][C]-[/C][C]-[/C][C]-[/C][C]-[/C][/ROW]
[ROW][C]86[/C][C]19640.2[/C][C]18497.5232[/C][C]16925.8321[/C][C]20168.6323[/C][C]0.0901[/C][C]0.003[/C][C]0.8604[/C][C]0.003[/C][/ROW]
[ROW][C]87[/C][C]17735.4[/C][C]16729.3049[/C][C]15146.8202[/C][C]18424.0424[/C][C]0.1223[/C][C]4e-04[/C][C]0.7429[/C][C]0[/C][/ROW]
[ROW][C]88[/C][C]19813.6[/C][C]20274.838[/C][C]18136.0248[/C][C]22584.2536[/C][C]0.3477[/C][C]0.9844[/C][C]0.7542[/C][C]0.3144[/C][/ROW]
[ROW][C]89[/C][C]22238.5[/C][C]20680.7896[/C][C]18355.3923[/C][C]23204.9514[/C][C]0.1132[/C][C]0.7496[/C][C]0.7195[/C][C]0.4495[/C][/ROW]
[ROW][C]90[/C][C]20682.2[/C][C]20198.1209[/C][C]17733.5625[/C][C]22892.9781[/C][C]0.3624[/C][C]0.0689[/C][C]0.5684[/C][C]0.3192[/C][/ROW]
[ROW][C]91[/C][C]17818.6[/C][C]17951.0225[/C][C]15567.9664[/C][C]20578.3866[/C][C]0.4607[/C][C]0.0208[/C][C]0.6748[/C][C]0.0154[/C][/ROW]
[ROW][C]92[/C][C]21872.1[/C][C]18991.4637[/C][C]16393.7816[/C][C]21864.4067[/C][C]0.0247[/C][C]0.7882[/C][C]0.5183[/C][C]0.1031[/C][/ROW]
[ROW][C]93[/C][C]22117[/C][C]18744.9831[/C][C]16076.0098[/C][C]21709.657[/C][C]0.0129[/C][C]0.0193[/C][C]0.545[/C][C]0.0826[/C][/ROW]
[ROW][C]94[/C][C]21865.9[/C][C]21287.8056[/C][C]18269.9[/C][C]24638.4608[/C][C]0.3676[/C][C]0.3138[/C][C]0.4853[/C][C]0.6023[/C][/ROW]
[ROW][C]95[/C][C]23451.3[/C][C]18674.3937[/C][C]15852.5195[/C][C]21830.3737[/C][C]0.0015[/C][C]0.0237[/C][C]0.5198[/C][C]0.0889[/C][/ROW]
[ROW][C]96[/C][C]20953.7[/C][C]19537.0439[/C][C]16553.957[/C][C]22877.4653[/C][C]0.2029[/C][C]0.0108[/C][C]0.4334[/C][C]0.2215[/C][/ROW]
[ROW][C]97[/C][C]22497.3[/C][C]20297.8631[/C][C]17171.5669[/C][C]23802.3176[/C][C]0.1093[/C][C]0.3569[/C][C]0.3799[/C][C]0.3799[/C][/ROW]
[/TABLE]
Source: https://freestatistics.org/blog/index.php?pk=33847&T=1

Globally Unique Identifier (entire table): ba.freestatistics.org/blog/index.php?pk=33847&T=1

As an alternative you can also use a QR Code:  

The GUIDs for individual cells are displayed in the table below:

Univariate ARIMA Extrapolation Forecast
timeY[t]F[t]95% LB95% UBp-value(H0: Y[t] = F[t])P(F[t]>Y[t-1])P(F[t]>Y[t-s])P(F[t]>Y[85])
7319795.4-------
7417574.9-------
7516165.4-------
7619464.6-------
7719932.1-------
7819961.2-------
7917343.4-------
8018924.2-------
8118574.1-------
8221350.6-------
8318594.6-------
8419823.1-------
8520844.4-------
8619640.218497.523216925.832120168.63230.09010.0030.86040.003
8717735.416729.304915146.820218424.04240.12234e-040.74290
8819813.620274.83818136.024822584.25360.34770.98440.75420.3144
8922238.520680.789618355.392323204.95140.11320.74960.71950.4495
9020682.220198.120917733.562522892.97810.36240.06890.56840.3192
9117818.617951.022515567.966420578.38660.46070.02080.67480.0154
9221872.118991.463716393.781621864.40670.02470.78820.51830.1031
932211718744.983116076.009821709.6570.01290.01930.5450.0826
9421865.921287.805618269.924638.46080.36760.31380.48530.6023
9523451.318674.393715852.519521830.37370.00150.02370.51980.0889
9620953.719537.043916553.95722877.46530.20290.01080.43340.2215
9722497.320297.863117171.566923802.31760.10930.35690.37990.3799


Univariate ARIMA Extrapolation Forecast Performance
time% S.E.PEMAPESq.EMSERMSE
860.04610.06180.00511305710.171108809.1809329.8624
870.05170.06010.0051012227.420284352.285290.4346
880.0581-0.02270.0019212740.470717728.3726133.1479
890.06230.07530.00632426461.7496202205.1458449.6723
900.06810.0240.002234332.599819527.7167139.7416
910.0747-0.00746e-0417535.71831461.309938.2271
920.07720.15170.01268298065.7806691505.4817831.5681
930.08070.17990.01511370497.7979947541.4832973.4174
940.08030.02720.0023334193.127527849.4273166.8815
950.08620.25580.021322818833.38161901569.44851378.9741
960.08720.07250.0062006914.4403167242.87408.9534
970.08810.10840.0094837522.8064403126.9005634.9228

\begin{tabular}{lllllllll}
\hline
Univariate ARIMA Extrapolation Forecast Performance \tabularnewline
time & % S.E. & PE & MAPE & Sq.E & MSE & RMSE \tabularnewline
86 & 0.0461 & 0.0618 & 0.0051 & 1305710.171 & 108809.1809 & 329.8624 \tabularnewline
87 & 0.0517 & 0.0601 & 0.005 & 1012227.4202 & 84352.285 & 290.4346 \tabularnewline
88 & 0.0581 & -0.0227 & 0.0019 & 212740.4707 & 17728.3726 & 133.1479 \tabularnewline
89 & 0.0623 & 0.0753 & 0.0063 & 2426461.7496 & 202205.1458 & 449.6723 \tabularnewline
90 & 0.0681 & 0.024 & 0.002 & 234332.5998 & 19527.7167 & 139.7416 \tabularnewline
91 & 0.0747 & -0.0074 & 6e-04 & 17535.7183 & 1461.3099 & 38.2271 \tabularnewline
92 & 0.0772 & 0.1517 & 0.0126 & 8298065.7806 & 691505.4817 & 831.5681 \tabularnewline
93 & 0.0807 & 0.1799 & 0.015 & 11370497.7979 & 947541.4832 & 973.4174 \tabularnewline
94 & 0.0803 & 0.0272 & 0.0023 & 334193.1275 & 27849.4273 & 166.8815 \tabularnewline
95 & 0.0862 & 0.2558 & 0.0213 & 22818833.3816 & 1901569.4485 & 1378.9741 \tabularnewline
96 & 0.0872 & 0.0725 & 0.006 & 2006914.4403 & 167242.87 & 408.9534 \tabularnewline
97 & 0.0881 & 0.1084 & 0.009 & 4837522.8064 & 403126.9005 & 634.9228 \tabularnewline
\hline
\end{tabular}
%Source: https://freestatistics.org/blog/index.php?pk=33847&T=2

[TABLE]
[ROW][C]Univariate ARIMA Extrapolation Forecast Performance[/C][/ROW]
[ROW][C]time[/C][C]% S.E.[/C][C]PE[/C][C]MAPE[/C][C]Sq.E[/C][C]MSE[/C][C]RMSE[/C][/ROW]
[ROW][C]86[/C][C]0.0461[/C][C]0.0618[/C][C]0.0051[/C][C]1305710.171[/C][C]108809.1809[/C][C]329.8624[/C][/ROW]
[ROW][C]87[/C][C]0.0517[/C][C]0.0601[/C][C]0.005[/C][C]1012227.4202[/C][C]84352.285[/C][C]290.4346[/C][/ROW]
[ROW][C]88[/C][C]0.0581[/C][C]-0.0227[/C][C]0.0019[/C][C]212740.4707[/C][C]17728.3726[/C][C]133.1479[/C][/ROW]
[ROW][C]89[/C][C]0.0623[/C][C]0.0753[/C][C]0.0063[/C][C]2426461.7496[/C][C]202205.1458[/C][C]449.6723[/C][/ROW]
[ROW][C]90[/C][C]0.0681[/C][C]0.024[/C][C]0.002[/C][C]234332.5998[/C][C]19527.7167[/C][C]139.7416[/C][/ROW]
[ROW][C]91[/C][C]0.0747[/C][C]-0.0074[/C][C]6e-04[/C][C]17535.7183[/C][C]1461.3099[/C][C]38.2271[/C][/ROW]
[ROW][C]92[/C][C]0.0772[/C][C]0.1517[/C][C]0.0126[/C][C]8298065.7806[/C][C]691505.4817[/C][C]831.5681[/C][/ROW]
[ROW][C]93[/C][C]0.0807[/C][C]0.1799[/C][C]0.015[/C][C]11370497.7979[/C][C]947541.4832[/C][C]973.4174[/C][/ROW]
[ROW][C]94[/C][C]0.0803[/C][C]0.0272[/C][C]0.0023[/C][C]334193.1275[/C][C]27849.4273[/C][C]166.8815[/C][/ROW]
[ROW][C]95[/C][C]0.0862[/C][C]0.2558[/C][C]0.0213[/C][C]22818833.3816[/C][C]1901569.4485[/C][C]1378.9741[/C][/ROW]
[ROW][C]96[/C][C]0.0872[/C][C]0.0725[/C][C]0.006[/C][C]2006914.4403[/C][C]167242.87[/C][C]408.9534[/C][/ROW]
[ROW][C]97[/C][C]0.0881[/C][C]0.1084[/C][C]0.009[/C][C]4837522.8064[/C][C]403126.9005[/C][C]634.9228[/C][/ROW]
[/TABLE]
Source: https://freestatistics.org/blog/index.php?pk=33847&T=2

Globally Unique Identifier (entire table): ba.freestatistics.org/blog/index.php?pk=33847&T=2

As an alternative you can also use a QR Code:  

The GUIDs for individual cells are displayed in the table below:

Univariate ARIMA Extrapolation Forecast Performance
time% S.E.PEMAPESq.EMSERMSE
860.04610.06180.00511305710.171108809.1809329.8624
870.05170.06010.0051012227.420284352.285290.4346
880.0581-0.02270.0019212740.470717728.3726133.1479
890.06230.07530.00632426461.7496202205.1458449.6723
900.06810.0240.002234332.599819527.7167139.7416
910.0747-0.00746e-0417535.71831461.309938.2271
920.07720.15170.01268298065.7806691505.4817831.5681
930.08070.17990.01511370497.7979947541.4832973.4174
940.08030.02720.0023334193.127527849.4273166.8815
950.08620.25580.021322818833.38161901569.44851378.9741
960.08720.07250.0062006914.4403167242.87408.9534
970.08810.10840.0094837522.8064403126.9005634.9228


Parameters (Session):
par1 = 12 ; par2 = 0.3 ; par3 = 0 ; par4 = 1 ; par5 = 12 ; par6 = 2 ; par7 = 0 ; par8 = 1 ; par9 = 1 ; par10 = FALSE ;
Parameters (R input):
par1 = 12 ; par2 = 0.3 ; par3 = 0 ; par4 = 1 ; par5 = 12 ; par6 = 2 ; par7 = 0 ; par8 = 1 ; par9 = 1 ; par10 = FALSE ; par11 = ; par12 = ; par13 = ; par14 = ; par15 = ; par16 = ; par17 = ; par18 = ; par19 = ; par20 = ;
R code (references can be found in the software module):
par1 <- as.numeric(par1) #cut off periods
par2 <- as.numeric(par2) #lambda
par3 <- as.numeric(par3) #degree of non-seasonal differencing
par4 <- as.numeric(par4) #degree of seasonal differencing
par5 <- as.numeric(par5) #seasonal period
par6 <- as.numeric(par6) #p
par7 <- as.numeric(par7) #q
par8 <- as.numeric(par8) #P
par9 <- as.numeric(par9) #Q
if (par10 == 'TRUE') par10 <- TRUE
if (par10 == 'FALSE') par10 <- FALSE
if (par2 == 0) x <- log(x)
if (par2 != 0) x <- x^par2
lx <- length(x)
first <- lx - 2*par1
nx <- lx - par1
nx1 <- nx + 1
fx <- lx - nx
if (fx < 1) {
fx <- par5
nx1 <- lx + fx - 1
first <- lx - 2*fx
}
first <- 1
if (fx < 3) fx <- round(lx/10,0)
(arima.out <- arima(x[1:nx], order=c(par6,par3,par7), seasonal=list(order=c(par8,par4,par9), period=par5), include.mean=par10, method='ML'))
(forecast <- predict(arima.out,fx))
(lb <- forecast$pred - 1.96 * forecast$se)
(ub <- forecast$pred + 1.96 * forecast$se)
if (par2 == 0) {
x <- exp(x)
forecast$pred <- exp(forecast$pred)
lb <- exp(lb)
ub <- exp(ub)
}
if (par2 != 0) {
x <- x^(1/par2)
forecast$pred <- forecast$pred^(1/par2)
lb <- lb^(1/par2)
ub <- ub^(1/par2)
}
if (par2 < 0) {
olb <- lb
lb <- ub
ub <- olb
}
(actandfor <- c(x[1:nx], forecast$pred))
(perc.se <- (ub-forecast$pred)/1.96/forecast$pred)
bitmap(file='test1.png')
opar <- par(mar=c(4,4,2,2),las=1)
ylim <- c( min(x[first:nx],lb), max(x[first:nx],ub))
plot(x,ylim=ylim,type='n',xlim=c(first,lx))
usr <- par('usr')
rect(usr[1],usr[3],nx+1,usr[4],border=NA,col='lemonchiffon')
rect(nx1,usr[3],usr[2],usr[4],border=NA,col='lavender')
abline(h= (-3:3)*2 , col ='gray', lty =3)
polygon( c(nx1:lx,lx:nx1), c(lb,rev(ub)), col = 'orange', lty=2,border=NA)
lines(nx1:lx, lb , lty=2)
lines(nx1:lx, ub , lty=2)
lines(x, lwd=2)
lines(nx1:lx, forecast$pred , lwd=2 , col ='white')
box()
par(opar)
dev.off()
prob.dec <- array(NA, dim=fx)
prob.sdec <- array(NA, dim=fx)
prob.ldec <- array(NA, dim=fx)
prob.pval <- array(NA, dim=fx)
perf.pe <- array(0, dim=fx)
perf.mape <- array(0, dim=fx)
perf.se <- array(0, dim=fx)
perf.mse <- array(0, dim=fx)
perf.rmse <- array(0, dim=fx)
for (i in 1:fx) {
locSD <- (ub[i] - forecast$pred[i]) / 1.96
perf.pe[i] = (x[nx+i] - forecast$pred[i]) / forecast$pred[i]
perf.mape[i] = perf.mape[i] + abs(perf.pe[i])
perf.se[i] = (x[nx+i] - forecast$pred[i])^2
perf.mse[i] = perf.mse[i] + perf.se[i]
prob.dec[i] = pnorm((x[nx+i-1] - forecast$pred[i]) / locSD)
prob.sdec[i] = pnorm((x[nx+i-par5] - forecast$pred[i]) / locSD)
prob.ldec[i] = pnorm((x[nx] - forecast$pred[i]) / locSD)
prob.pval[i] = pnorm(abs(x[nx+i] - forecast$pred[i]) / locSD)
}
perf.mape = perf.mape / fx
perf.mse = perf.mse / fx
perf.rmse = sqrt(perf.mse)
bitmap(file='test2.png')
plot(forecast$pred, pch=19, type='b',main='ARIMA Extrapolation Forecast', ylab='Forecast and 95% CI', xlab='time',ylim=c(min(lb),max(ub)))
dum <- forecast$pred
dum[1:12] <- x[(nx+1):lx]
lines(dum, lty=1)
lines(ub,lty=3)
lines(lb,lty=3)
dev.off()
load(file='createtable')
a<-table.start()
a<-table.row.start(a)
a<-table.element(a,'Univariate ARIMA Extrapolation Forecast',9,TRUE)
a<-table.row.end(a)
a<-table.row.start(a)
a<-table.element(a,'time',1,header=TRUE)
a<-table.element(a,'Y[t]',1,header=TRUE)
a<-table.element(a,'F[t]',1,header=TRUE)
a<-table.element(a,'95% LB',1,header=TRUE)
a<-table.element(a,'95% UB',1,header=TRUE)
a<-table.element(a,'p-value
(H0: Y[t] = F[t])',1,header=TRUE)
a<-table.element(a,'P(F[t]>Y[t-1])',1,header=TRUE)
a<-table.element(a,'P(F[t]>Y[t-s])',1,header=TRUE)
mylab <- paste('P(F[t]>Y[',nx,sep='')
mylab <- paste(mylab,'])',sep='')
a<-table.element(a,mylab,1,header=TRUE)
a<-table.row.end(a)
for (i in (nx-par5):nx) {
a<-table.row.start(a)
a<-table.element(a,i,header=TRUE)
a<-table.element(a,x[i])
a<-table.element(a,'-')
a<-table.row.end(a)
}
for (i in 1:fx) {
a<-table.row.start(a)
a<-table.element(a,nx+i,header=TRUE)
a<-table.element(a,round(x[nx+i],4))
a<-table.element(a,round(forecast$pred[i],4))
a<-table.element(a,round(lb[i],4))
a<-table.element(a,round(ub[i],4))
a<-table.element(a,round((1-prob.pval[i]),4))
a<-table.element(a,round((1-prob.dec[i]),4))
a<-table.element(a,round((1-prob.sdec[i]),4))
a<-table.element(a,round((1-prob.ldec[i]),4))
a<-table.row.end(a)
}
a<-table.end(a)
table.save(a,file='mytable.tab')
a<-table.start()
a<-table.row.start(a)
a<-table.element(a,'Univariate ARIMA Extrapolation Forecast Performance',7,TRUE)
a<-table.row.end(a)
a<-table.row.start(a)
a<-table.element(a,'time',1,header=TRUE)
a<-table.element(a,'% S.E.',1,header=TRUE)
a<-table.element(a,'PE',1,header=TRUE)
a<-table.element(a,'MAPE',1,header=TRUE)
a<-table.element(a,'Sq.E',1,header=TRUE)
a<-table.element(a,'MSE',1,header=TRUE)
a<-table.element(a,'RMSE',1,header=TRUE)
a<-table.row.end(a)
for (i in 1:fx) {
a<-table.row.start(a)
a<-table.element(a,nx+i,header=TRUE)
a<-table.element(a,round(perc.se[i],4))
a<-table.element(a,round(perf.pe[i],4))
a<-table.element(a,round(perf.mape[i],4))
a<-table.element(a,round(perf.se[i],4))
a<-table.element(a,round(perf.mse[i],4))
a<-table.element(a,round(perf.rmse[i],4))
a<-table.row.end(a)
}
a<-table.end(a)
table.save(a,file='mytable1.tab')