Free Statistics

of Irreproducible Research!

Author's title

Author*The author of this computation has been verified*
R Software Modulerwasp_arimaforecasting.wasp
Title produced by softwareARIMA Forecasting
Date of computationMon, 15 Dec 2008 15:28:22 -0700
Cite this page as followsStatistical Computations at FreeStatistics.org, Office for Research Development and Education, URL https://freestatistics.org/blog/index.php?v=date/2008/Dec/15/t12293801452nreokl5n1swuf5.htm/, Retrieved Wed, 15 May 2024 15:30:38 +0000
Statistical Computations at FreeStatistics.org, Office for Research Development and Education, URL https://freestatistics.org/blog/index.php?pk=33838, Retrieved Wed, 15 May 2024 15:30:38 +0000
QR Codes:

Original text written by user:
IsPrivate?No (this computation is public)
User-defined keywordsARIMA forecasting werkloosheid vlaanderen
Estimated Impact158
Family? (F = Feedback message, R = changed R code, M = changed R Module, P = changed Parameters, D = changed Data)
F     [ARIMA Forecasting] [ARIMA forecasting...] [2008-12-09 15:51:08] [e1a46c1dcfccb0cb690f79a1a409b517]
-         [ARIMA Forecasting] [vraag 2 ARIMA for...] [2008-12-15 22:28:22] [3efbb18563b4564408d69b3c9a8e9a6e] [Current]
Feedback Forum

Post a new message
Dataseries X:
189917
184128
175335
179566
181140
177876
175041
169292
166070
166972
206348
215706
202108
195411
193111
195198
198770
194163
190420
189733
186029
191531
232571
243477
227247
217859
208679
213188
216234
213587
209465
204045
200237
203666
241476
260307
243324
244460
233575
237217
235243
230354
227184
221678
217142
219452
256446
265845
248624
241114
229245
231805
219277
219313
212610
214771
211142
211457
240048
240636
230580


Summary of computational transaction
Raw Inputview raw input (R code)
Raw Outputview raw output of R engine
Computing time1 seconds
R Server'Gwilym Jenkins' @ 72.249.127.135

\begin{tabular}{lllllllll}
\hline
Summary of computational transaction \tabularnewline
Raw Input & view raw input (R code)  \tabularnewline
Raw Output & view raw output of R engine  \tabularnewline
Computing time & 1 seconds \tabularnewline
R Server & 'Gwilym Jenkins' @ 72.249.127.135 \tabularnewline
\hline
\end{tabular}
%Source: https://freestatistics.org/blog/index.php?pk=33838&T=0

[TABLE]
[ROW][C]Summary of computational transaction[/C][/ROW]
[ROW][C]Raw Input[/C][C]view raw input (R code) [/C][/ROW]
[ROW][C]Raw Output[/C][C]view raw output of R engine [/C][/ROW]
[ROW][C]Computing time[/C][C]1 seconds[/C][/ROW]
[ROW][C]R Server[/C][C]'Gwilym Jenkins' @ 72.249.127.135[/C][/ROW]
[/TABLE]
Source: https://freestatistics.org/blog/index.php?pk=33838&T=0

Globally Unique Identifier (entire table): ba.freestatistics.org/blog/index.php?pk=33838&T=0

As an alternative you can also use a QR Code:  

The GUIDs for individual cells are displayed in the table below:

Summary of computational transaction
Raw Inputview raw input (R code)
Raw Outputview raw output of R engine
Computing time1 seconds
R Server'Gwilym Jenkins' @ 72.249.127.135


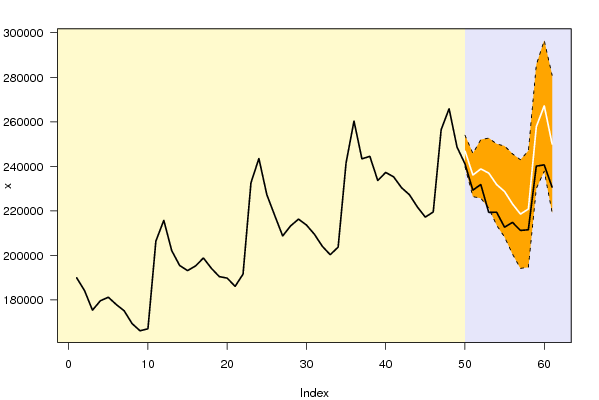
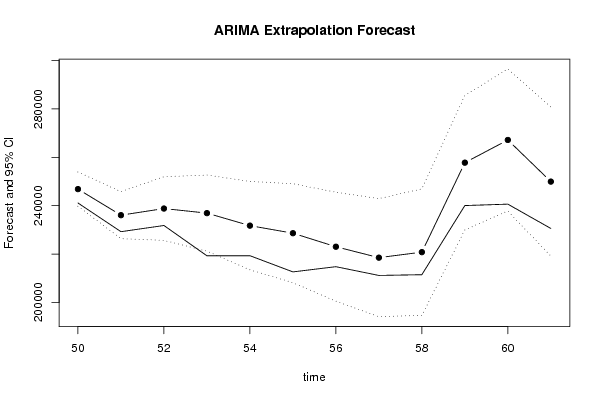
Univariate ARIMA Extrapolation Forecast
timeY[t]F[t]95% LB95% UBp-value(H0: Y[t] = F[t])P(F[t]>Y[t-1])P(F[t]>Y[t-s])P(F[t]>Y[49])
37243324-------
38244460-------
39233575-------
40237217-------
41235243-------
42230354-------
43227184-------
44221678-------
45217142-------
46219452-------
47256446-------
48265845-------
49248624-------
50241114246859.3933239778.2328253940.55390.05590.31260.74670.3126
51229245236071.2615226346.7107245795.81230.08440.15470.69260.0057
52231805238811.2518225643.8284251978.67530.14850.92280.59380.0721
53219277236920.1789221182.5992252657.75850.0140.7380.58270.0725
54219313231747.5762213458.2827250036.86960.09130.90930.55940.0353
55212610228619.8634208148.2835249091.44320.06270.81360.55470.0277
56214771223023.7427200488.7479245558.73740.23640.81750.54660.013
57211142218506.1045194100.8216242911.38750.27710.61790.54360.0078
58211457220787.1775194619.2163246955.13870.24230.7650.53980.0185
59240048257788.551229976.0968285601.00520.10560.99950.53770.7408
60240636267178.179237805.6719296550.68610.03830.96490.53540.8922
61230580249960.0081219108.5231280811.49310.10910.72320.53380.5338

\begin{tabular}{lllllllll}
\hline
Univariate ARIMA Extrapolation Forecast \tabularnewline
time & Y[t] & F[t] & 95% LB & 95% UB & p-value(H0: Y[t] = F[t]) & P(F[t]>Y[t-1]) & P(F[t]>Y[t-s]) & P(F[t]>Y[49]) \tabularnewline
37 & 243324 & - & - & - & - & - & - & - \tabularnewline
38 & 244460 & - & - & - & - & - & - & - \tabularnewline
39 & 233575 & - & - & - & - & - & - & - \tabularnewline
40 & 237217 & - & - & - & - & - & - & - \tabularnewline
41 & 235243 & - & - & - & - & - & - & - \tabularnewline
42 & 230354 & - & - & - & - & - & - & - \tabularnewline
43 & 227184 & - & - & - & - & - & - & - \tabularnewline
44 & 221678 & - & - & - & - & - & - & - \tabularnewline
45 & 217142 & - & - & - & - & - & - & - \tabularnewline
46 & 219452 & - & - & - & - & - & - & - \tabularnewline
47 & 256446 & - & - & - & - & - & - & - \tabularnewline
48 & 265845 & - & - & - & - & - & - & - \tabularnewline
49 & 248624 & - & - & - & - & - & - & - \tabularnewline
50 & 241114 & 246859.3933 & 239778.2328 & 253940.5539 & 0.0559 & 0.3126 & 0.7467 & 0.3126 \tabularnewline
51 & 229245 & 236071.2615 & 226346.7107 & 245795.8123 & 0.0844 & 0.1547 & 0.6926 & 0.0057 \tabularnewline
52 & 231805 & 238811.2518 & 225643.8284 & 251978.6753 & 0.1485 & 0.9228 & 0.5938 & 0.0721 \tabularnewline
53 & 219277 & 236920.1789 & 221182.5992 & 252657.7585 & 0.014 & 0.738 & 0.5827 & 0.0725 \tabularnewline
54 & 219313 & 231747.5762 & 213458.2827 & 250036.8696 & 0.0913 & 0.9093 & 0.5594 & 0.0353 \tabularnewline
55 & 212610 & 228619.8634 & 208148.2835 & 249091.4432 & 0.0627 & 0.8136 & 0.5547 & 0.0277 \tabularnewline
56 & 214771 & 223023.7427 & 200488.7479 & 245558.7374 & 0.2364 & 0.8175 & 0.5466 & 0.013 \tabularnewline
57 & 211142 & 218506.1045 & 194100.8216 & 242911.3875 & 0.2771 & 0.6179 & 0.5436 & 0.0078 \tabularnewline
58 & 211457 & 220787.1775 & 194619.2163 & 246955.1387 & 0.2423 & 0.765 & 0.5398 & 0.0185 \tabularnewline
59 & 240048 & 257788.551 & 229976.0968 & 285601.0052 & 0.1056 & 0.9995 & 0.5377 & 0.7408 \tabularnewline
60 & 240636 & 267178.179 & 237805.6719 & 296550.6861 & 0.0383 & 0.9649 & 0.5354 & 0.8922 \tabularnewline
61 & 230580 & 249960.0081 & 219108.5231 & 280811.4931 & 0.1091 & 0.7232 & 0.5338 & 0.5338 \tabularnewline
\hline
\end{tabular}
%Source: https://freestatistics.org/blog/index.php?pk=33838&T=1

[TABLE]
[ROW][C]Univariate ARIMA Extrapolation Forecast[/C][/ROW]
[ROW][C]time[/C][C]Y[t][/C][C]F[t][/C][C]95% LB[/C][C]95% UB[/C][C]p-value(H0: Y[t] = F[t])[/C][C]P(F[t]>Y[t-1])[/C][C]P(F[t]>Y[t-s])[/C][C]P(F[t]>Y[49])[/C][/ROW]
[ROW][C]37[/C][C]243324[/C][C]-[/C][C]-[/C][C]-[/C][C]-[/C][C]-[/C][C]-[/C][C]-[/C][/ROW]
[ROW][C]38[/C][C]244460[/C][C]-[/C][C]-[/C][C]-[/C][C]-[/C][C]-[/C][C]-[/C][C]-[/C][/ROW]
[ROW][C]39[/C][C]233575[/C][C]-[/C][C]-[/C][C]-[/C][C]-[/C][C]-[/C][C]-[/C][C]-[/C][/ROW]
[ROW][C]40[/C][C]237217[/C][C]-[/C][C]-[/C][C]-[/C][C]-[/C][C]-[/C][C]-[/C][C]-[/C][/ROW]
[ROW][C]41[/C][C]235243[/C][C]-[/C][C]-[/C][C]-[/C][C]-[/C][C]-[/C][C]-[/C][C]-[/C][/ROW]
[ROW][C]42[/C][C]230354[/C][C]-[/C][C]-[/C][C]-[/C][C]-[/C][C]-[/C][C]-[/C][C]-[/C][/ROW]
[ROW][C]43[/C][C]227184[/C][C]-[/C][C]-[/C][C]-[/C][C]-[/C][C]-[/C][C]-[/C][C]-[/C][/ROW]
[ROW][C]44[/C][C]221678[/C][C]-[/C][C]-[/C][C]-[/C][C]-[/C][C]-[/C][C]-[/C][C]-[/C][/ROW]
[ROW][C]45[/C][C]217142[/C][C]-[/C][C]-[/C][C]-[/C][C]-[/C][C]-[/C][C]-[/C][C]-[/C][/ROW]
[ROW][C]46[/C][C]219452[/C][C]-[/C][C]-[/C][C]-[/C][C]-[/C][C]-[/C][C]-[/C][C]-[/C][/ROW]
[ROW][C]47[/C][C]256446[/C][C]-[/C][C]-[/C][C]-[/C][C]-[/C][C]-[/C][C]-[/C][C]-[/C][/ROW]
[ROW][C]48[/C][C]265845[/C][C]-[/C][C]-[/C][C]-[/C][C]-[/C][C]-[/C][C]-[/C][C]-[/C][/ROW]
[ROW][C]49[/C][C]248624[/C][C]-[/C][C]-[/C][C]-[/C][C]-[/C][C]-[/C][C]-[/C][C]-[/C][/ROW]
[ROW][C]50[/C][C]241114[/C][C]246859.3933[/C][C]239778.2328[/C][C]253940.5539[/C][C]0.0559[/C][C]0.3126[/C][C]0.7467[/C][C]0.3126[/C][/ROW]
[ROW][C]51[/C][C]229245[/C][C]236071.2615[/C][C]226346.7107[/C][C]245795.8123[/C][C]0.0844[/C][C]0.1547[/C][C]0.6926[/C][C]0.0057[/C][/ROW]
[ROW][C]52[/C][C]231805[/C][C]238811.2518[/C][C]225643.8284[/C][C]251978.6753[/C][C]0.1485[/C][C]0.9228[/C][C]0.5938[/C][C]0.0721[/C][/ROW]
[ROW][C]53[/C][C]219277[/C][C]236920.1789[/C][C]221182.5992[/C][C]252657.7585[/C][C]0.014[/C][C]0.738[/C][C]0.5827[/C][C]0.0725[/C][/ROW]
[ROW][C]54[/C][C]219313[/C][C]231747.5762[/C][C]213458.2827[/C][C]250036.8696[/C][C]0.0913[/C][C]0.9093[/C][C]0.5594[/C][C]0.0353[/C][/ROW]
[ROW][C]55[/C][C]212610[/C][C]228619.8634[/C][C]208148.2835[/C][C]249091.4432[/C][C]0.0627[/C][C]0.8136[/C][C]0.5547[/C][C]0.0277[/C][/ROW]
[ROW][C]56[/C][C]214771[/C][C]223023.7427[/C][C]200488.7479[/C][C]245558.7374[/C][C]0.2364[/C][C]0.8175[/C][C]0.5466[/C][C]0.013[/C][/ROW]
[ROW][C]57[/C][C]211142[/C][C]218506.1045[/C][C]194100.8216[/C][C]242911.3875[/C][C]0.2771[/C][C]0.6179[/C][C]0.5436[/C][C]0.0078[/C][/ROW]
[ROW][C]58[/C][C]211457[/C][C]220787.1775[/C][C]194619.2163[/C][C]246955.1387[/C][C]0.2423[/C][C]0.765[/C][C]0.5398[/C][C]0.0185[/C][/ROW]
[ROW][C]59[/C][C]240048[/C][C]257788.551[/C][C]229976.0968[/C][C]285601.0052[/C][C]0.1056[/C][C]0.9995[/C][C]0.5377[/C][C]0.7408[/C][/ROW]
[ROW][C]60[/C][C]240636[/C][C]267178.179[/C][C]237805.6719[/C][C]296550.6861[/C][C]0.0383[/C][C]0.9649[/C][C]0.5354[/C][C]0.8922[/C][/ROW]
[ROW][C]61[/C][C]230580[/C][C]249960.0081[/C][C]219108.5231[/C][C]280811.4931[/C][C]0.1091[/C][C]0.7232[/C][C]0.5338[/C][C]0.5338[/C][/ROW]
[/TABLE]
Source: https://freestatistics.org/blog/index.php?pk=33838&T=1

Globally Unique Identifier (entire table): ba.freestatistics.org/blog/index.php?pk=33838&T=1

As an alternative you can also use a QR Code:  

The GUIDs for individual cells are displayed in the table below:

Univariate ARIMA Extrapolation Forecast
timeY[t]F[t]95% LB95% UBp-value(H0: Y[t] = F[t])P(F[t]>Y[t-1])P(F[t]>Y[t-s])P(F[t]>Y[49])
37243324-------
38244460-------
39233575-------
40237217-------
41235243-------
42230354-------
43227184-------
44221678-------
45217142-------
46219452-------
47256446-------
48265845-------
49248624-------
50241114246859.3933239778.2328253940.55390.05590.31260.74670.3126
51229245236071.2615226346.7107245795.81230.08440.15470.69260.0057
52231805238811.2518225643.8284251978.67530.14850.92280.59380.0721
53219277236920.1789221182.5992252657.75850.0140.7380.58270.0725
54219313231747.5762213458.2827250036.86960.09130.90930.55940.0353
55212610228619.8634208148.2835249091.44320.06270.81360.55470.0277
56214771223023.7427200488.7479245558.73740.23640.81750.54660.013
57211142218506.1045194100.8216242911.38750.27710.61790.54360.0078
58211457220787.1775194619.2163246955.13870.24230.7650.53980.0185
59240048257788.551229976.0968285601.00520.10560.99950.53770.7408
60240636267178.179237805.6719296550.68610.03830.96490.53540.8922
61230580249960.0081219108.5231280811.49310.10910.72320.53380.5338


Univariate ARIMA Extrapolation Forecast Performance
time% S.E.PEMAPESq.EMSERMSE
500.0146-0.02330.001933009544.68172750795.39011658.5522
510.021-0.02890.002446597846.41163883153.86761970.572
520.0281-0.02930.002449087564.73254090630.39442022.5307
530.0339-0.07450.0062311281760.356225940146.69645093.147
540.0403-0.05370.0045154618684.117812884890.34323589.5529
550.0457-0.070.0058256315724.832121359643.7364621.6495
560.0516-0.0370.003168107761.62965675646.80252382.3616
570.057-0.03370.002854230035.52974519169.62752125.8339
580.0605-0.04230.003587052212.12657254351.01052693.3902
590.055-0.06880.0057314727149.506526227262.45895121.2559
600.0561-0.09930.0083704487267.663658707272.30537662.0671
610.063-0.07750.0065375584715.073131298726.25615594.5265

\begin{tabular}{lllllllll}
\hline
Univariate ARIMA Extrapolation Forecast Performance \tabularnewline
time & % S.E. & PE & MAPE & Sq.E & MSE & RMSE \tabularnewline
50 & 0.0146 & -0.0233 & 0.0019 & 33009544.6817 & 2750795.3901 & 1658.5522 \tabularnewline
51 & 0.021 & -0.0289 & 0.0024 & 46597846.4116 & 3883153.8676 & 1970.572 \tabularnewline
52 & 0.0281 & -0.0293 & 0.0024 & 49087564.7325 & 4090630.3944 & 2022.5307 \tabularnewline
53 & 0.0339 & -0.0745 & 0.0062 & 311281760.3562 & 25940146.6964 & 5093.147 \tabularnewline
54 & 0.0403 & -0.0537 & 0.0045 & 154618684.1178 & 12884890.3432 & 3589.5529 \tabularnewline
55 & 0.0457 & -0.07 & 0.0058 & 256315724.8321 & 21359643.736 & 4621.6495 \tabularnewline
56 & 0.0516 & -0.037 & 0.0031 & 68107761.6296 & 5675646.8025 & 2382.3616 \tabularnewline
57 & 0.057 & -0.0337 & 0.0028 & 54230035.5297 & 4519169.6275 & 2125.8339 \tabularnewline
58 & 0.0605 & -0.0423 & 0.0035 & 87052212.1265 & 7254351.0105 & 2693.3902 \tabularnewline
59 & 0.055 & -0.0688 & 0.0057 & 314727149.5065 & 26227262.4589 & 5121.2559 \tabularnewline
60 & 0.0561 & -0.0993 & 0.0083 & 704487267.6636 & 58707272.3053 & 7662.0671 \tabularnewline
61 & 0.063 & -0.0775 & 0.0065 & 375584715.0731 & 31298726.2561 & 5594.5265 \tabularnewline
\hline
\end{tabular}
%Source: https://freestatistics.org/blog/index.php?pk=33838&T=2

[TABLE]
[ROW][C]Univariate ARIMA Extrapolation Forecast Performance[/C][/ROW]
[ROW][C]time[/C][C]% S.E.[/C][C]PE[/C][C]MAPE[/C][C]Sq.E[/C][C]MSE[/C][C]RMSE[/C][/ROW]
[ROW][C]50[/C][C]0.0146[/C][C]-0.0233[/C][C]0.0019[/C][C]33009544.6817[/C][C]2750795.3901[/C][C]1658.5522[/C][/ROW]
[ROW][C]51[/C][C]0.021[/C][C]-0.0289[/C][C]0.0024[/C][C]46597846.4116[/C][C]3883153.8676[/C][C]1970.572[/C][/ROW]
[ROW][C]52[/C][C]0.0281[/C][C]-0.0293[/C][C]0.0024[/C][C]49087564.7325[/C][C]4090630.3944[/C][C]2022.5307[/C][/ROW]
[ROW][C]53[/C][C]0.0339[/C][C]-0.0745[/C][C]0.0062[/C][C]311281760.3562[/C][C]25940146.6964[/C][C]5093.147[/C][/ROW]
[ROW][C]54[/C][C]0.0403[/C][C]-0.0537[/C][C]0.0045[/C][C]154618684.1178[/C][C]12884890.3432[/C][C]3589.5529[/C][/ROW]
[ROW][C]55[/C][C]0.0457[/C][C]-0.07[/C][C]0.0058[/C][C]256315724.8321[/C][C]21359643.736[/C][C]4621.6495[/C][/ROW]
[ROW][C]56[/C][C]0.0516[/C][C]-0.037[/C][C]0.0031[/C][C]68107761.6296[/C][C]5675646.8025[/C][C]2382.3616[/C][/ROW]
[ROW][C]57[/C][C]0.057[/C][C]-0.0337[/C][C]0.0028[/C][C]54230035.5297[/C][C]4519169.6275[/C][C]2125.8339[/C][/ROW]
[ROW][C]58[/C][C]0.0605[/C][C]-0.0423[/C][C]0.0035[/C][C]87052212.1265[/C][C]7254351.0105[/C][C]2693.3902[/C][/ROW]
[ROW][C]59[/C][C]0.055[/C][C]-0.0688[/C][C]0.0057[/C][C]314727149.5065[/C][C]26227262.4589[/C][C]5121.2559[/C][/ROW]
[ROW][C]60[/C][C]0.0561[/C][C]-0.0993[/C][C]0.0083[/C][C]704487267.6636[/C][C]58707272.3053[/C][C]7662.0671[/C][/ROW]
[ROW][C]61[/C][C]0.063[/C][C]-0.0775[/C][C]0.0065[/C][C]375584715.0731[/C][C]31298726.2561[/C][C]5594.5265[/C][/ROW]
[/TABLE]
Source: https://freestatistics.org/blog/index.php?pk=33838&T=2

Globally Unique Identifier (entire table): ba.freestatistics.org/blog/index.php?pk=33838&T=2

As an alternative you can also use a QR Code:  

The GUIDs for individual cells are displayed in the table below:

Univariate ARIMA Extrapolation Forecast Performance
time% S.E.PEMAPESq.EMSERMSE
500.0146-0.02330.001933009544.68172750795.39011658.5522
510.021-0.02890.002446597846.41163883153.86761970.572
520.0281-0.02930.002449087564.73254090630.39442022.5307
530.0339-0.07450.0062311281760.356225940146.69645093.147
540.0403-0.05370.0045154618684.117812884890.34323589.5529
550.0457-0.070.0058256315724.832121359643.7364621.6495
560.0516-0.0370.003168107761.62965675646.80252382.3616
570.057-0.03370.002854230035.52974519169.62752125.8339
580.0605-0.04230.003587052212.12657254351.01052693.3902
590.055-0.06880.0057314727149.506526227262.45895121.2559
600.0561-0.09930.0083704487267.663658707272.30537662.0671
610.063-0.07750.0065375584715.073131298726.25615594.5265


Parameters (Session):
par1 = 12 ; par2 = 1 ; par3 = 1 ; par4 = 1 ; par5 = 12 ; par6 = 2 ; par7 = 0 ; par8 = 0 ; par9 = 0 ; par10 = FALSE ;
Parameters (R input):
par1 = 12 ; par2 = 1 ; par3 = 1 ; par4 = 1 ; par5 = 12 ; par6 = 2 ; par7 = 0 ; par8 = 0 ; par9 = 0 ; par10 = FALSE ;
R code (references can be found in the software module):
par1 <- as.numeric(par1) #cut off periods
par2 <- as.numeric(par2) #lambda
par3 <- as.numeric(par3) #degree of non-seasonal differencing
par4 <- as.numeric(par4) #degree of seasonal differencing
par5 <- as.numeric(par5) #seasonal period
par6 <- as.numeric(par6) #p
par7 <- as.numeric(par7) #q
par8 <- as.numeric(par8) #P
par9 <- as.numeric(par9) #Q
if (par10 == 'TRUE') par10 <- TRUE
if (par10 == 'FALSE') par10 <- FALSE
if (par2 == 0) x <- log(x)
if (par2 != 0) x <- x^par2
lx <- length(x)
first <- lx - 2*par1
nx <- lx - par1
nx1 <- nx + 1
fx <- lx - nx
if (fx < 1) {
fx <- par5
nx1 <- lx + fx - 1
first <- lx - 2*fx
}
first <- 1
if (fx < 3) fx <- round(lx/10,0)
(arima.out <- arima(x[1:nx], order=c(par6,par3,par7), seasonal=list(order=c(par8,par4,par9), period=par5), include.mean=par10, method='ML'))
(forecast <- predict(arima.out,fx))
(lb <- forecast$pred - 1.96 * forecast$se)
(ub <- forecast$pred + 1.96 * forecast$se)
if (par2 == 0) {
x <- exp(x)
forecast$pred <- exp(forecast$pred)
lb <- exp(lb)
ub <- exp(ub)
}
if (par2 != 0) {
x <- x^(1/par2)
forecast$pred <- forecast$pred^(1/par2)
lb <- lb^(1/par2)
ub <- ub^(1/par2)
}
if (par2 < 0) {
olb <- lb
lb <- ub
ub <- olb
}
(actandfor <- c(x[1:nx], forecast$pred))
(perc.se <- (ub-forecast$pred)/1.96/forecast$pred)
bitmap(file='test1.png')
opar <- par(mar=c(4,4,2,2),las=1)
ylim <- c( min(x[first:nx],lb), max(x[first:nx],ub))
plot(x,ylim=ylim,type='n',xlim=c(first,lx))
usr <- par('usr')
rect(usr[1],usr[3],nx+1,usr[4],border=NA,col='lemonchiffon')
rect(nx1,usr[3],usr[2],usr[4],border=NA,col='lavender')
abline(h= (-3:3)*2 , col ='gray', lty =3)
polygon( c(nx1:lx,lx:nx1), c(lb,rev(ub)), col = 'orange', lty=2,border=NA)
lines(nx1:lx, lb , lty=2)
lines(nx1:lx, ub , lty=2)
lines(x, lwd=2)
lines(nx1:lx, forecast$pred , lwd=2 , col ='white')
box()
par(opar)
dev.off()
prob.dec <- array(NA, dim=fx)
prob.sdec <- array(NA, dim=fx)
prob.ldec <- array(NA, dim=fx)
prob.pval <- array(NA, dim=fx)
perf.pe <- array(0, dim=fx)
perf.mape <- array(0, dim=fx)
perf.se <- array(0, dim=fx)
perf.mse <- array(0, dim=fx)
perf.rmse <- array(0, dim=fx)
for (i in 1:fx) {
locSD <- (ub[i] - forecast$pred[i]) / 1.96
perf.pe[i] = (x[nx+i] - forecast$pred[i]) / forecast$pred[i]
perf.mape[i] = perf.mape[i] + abs(perf.pe[i])
perf.se[i] = (x[nx+i] - forecast$pred[i])^2
perf.mse[i] = perf.mse[i] + perf.se[i]
prob.dec[i] = pnorm((x[nx+i-1] - forecast$pred[i]) / locSD)
prob.sdec[i] = pnorm((x[nx+i-par5] - forecast$pred[i]) / locSD)
prob.ldec[i] = pnorm((x[nx] - forecast$pred[i]) / locSD)
prob.pval[i] = pnorm(abs(x[nx+i] - forecast$pred[i]) / locSD)
}
perf.mape = perf.mape / fx
perf.mse = perf.mse / fx
perf.rmse = sqrt(perf.mse)
bitmap(file='test2.png')
plot(forecast$pred, pch=19, type='b',main='ARIMA Extrapolation Forecast', ylab='Forecast and 95% CI', xlab='time',ylim=c(min(lb),max(ub)))
dum <- forecast$pred
dum[1:12] <- x[(nx+1):lx]
lines(dum, lty=1)
lines(ub,lty=3)
lines(lb,lty=3)
dev.off()
load(file='createtable')
a<-table.start()
a<-table.row.start(a)
a<-table.element(a,'Univariate ARIMA Extrapolation Forecast',9,TRUE)
a<-table.row.end(a)
a<-table.row.start(a)
a<-table.element(a,'time',1,header=TRUE)
a<-table.element(a,'Y[t]',1,header=TRUE)
a<-table.element(a,'F[t]',1,header=TRUE)
a<-table.element(a,'95% LB',1,header=TRUE)
a<-table.element(a,'95% UB',1,header=TRUE)
a<-table.element(a,'p-value
(H0: Y[t] = F[t])',1,header=TRUE)
a<-table.element(a,'P(F[t]>Y[t-1])',1,header=TRUE)
a<-table.element(a,'P(F[t]>Y[t-s])',1,header=TRUE)
mylab <- paste('P(F[t]>Y[',nx,sep='')
mylab <- paste(mylab,'])',sep='')
a<-table.element(a,mylab,1,header=TRUE)
a<-table.row.end(a)
for (i in (nx-par5):nx) {
a<-table.row.start(a)
a<-table.element(a,i,header=TRUE)
a<-table.element(a,x[i])
a<-table.element(a,'-')
a<-table.row.end(a)
}
for (i in 1:fx) {
a<-table.row.start(a)
a<-table.element(a,nx+i,header=TRUE)
a<-table.element(a,round(x[nx+i],4))
a<-table.element(a,round(forecast$pred[i],4))
a<-table.element(a,round(lb[i],4))
a<-table.element(a,round(ub[i],4))
a<-table.element(a,round((1-prob.pval[i]),4))
a<-table.element(a,round((1-prob.dec[i]),4))
a<-table.element(a,round((1-prob.sdec[i]),4))
a<-table.element(a,round((1-prob.ldec[i]),4))
a<-table.row.end(a)
}
a<-table.end(a)
table.save(a,file='mytable.tab')
a<-table.start()
a<-table.row.start(a)
a<-table.element(a,'Univariate ARIMA Extrapolation Forecast Performance',7,TRUE)
a<-table.row.end(a)
a<-table.row.start(a)
a<-table.element(a,'time',1,header=TRUE)
a<-table.element(a,'% S.E.',1,header=TRUE)
a<-table.element(a,'PE',1,header=TRUE)
a<-table.element(a,'MAPE',1,header=TRUE)
a<-table.element(a,'Sq.E',1,header=TRUE)
a<-table.element(a,'MSE',1,header=TRUE)
a<-table.element(a,'RMSE',1,header=TRUE)
a<-table.row.end(a)
for (i in 1:fx) {
a<-table.row.start(a)
a<-table.element(a,nx+i,header=TRUE)
a<-table.element(a,round(perc.se[i],4))
a<-table.element(a,round(perf.pe[i],4))
a<-table.element(a,round(perf.mape[i],4))
a<-table.element(a,round(perf.se[i],4))
a<-table.element(a,round(perf.mse[i],4))
a<-table.element(a,round(perf.rmse[i],4))
a<-table.row.end(a)
}
a<-table.end(a)
table.save(a,file='mytable1.tab')