Free Statistics

of Irreproducible Research!

Author's title

Author*The author of this computation has been verified*
R Software Modulerwasp_autocorrelation.wasp
Title produced by software(Partial) Autocorrelation Function
Date of computationMon, 15 Dec 2008 15:14:24 -0700
Cite this page as followsStatistical Computations at FreeStatistics.org, Office for Research Development and Education, URL https://freestatistics.org/blog/index.php?v=date/2008/Dec/15/t1229379310f807xf9s88zxp83.htm/, Retrieved Wed, 15 May 2024 08:15:03 +0000
Statistical Computations at FreeStatistics.org, Office for Research Development and Education, URL https://freestatistics.org/blog/index.php?pk=33833, Retrieved Wed, 15 May 2024 08:15:03 +0000
QR Codes:

Original text written by user:
IsPrivate?No (this computation is public)
User-defined keywords
Estimated Impact165
Family? (F = Feedback message, R = changed R code, M = changed R Module, P = changed Parameters, D = changed Data)
F     [Law of Averages] [Random Walk Simul...] [2008-11-25 17:50:19] [b98453cac15ba1066b407e146608df68]
F       [Law of Averages] [Non Stationary Ti...] [2008-11-30 21:33:42] [82d201ca7b4e7cd2c6f885d29b5b6937]
F RMPD    [(Partial) Autocorrelation Function] [(P) ACF] [2008-12-08 21:03:21] [82d201ca7b4e7cd2c6f885d29b5b6937]
-   P         [(Partial) Autocorrelation Function] [ACF] [2008-12-15 22:14:24] [00a0a665d7a07edd2e460056b0c0c354] [Current]
Feedback Forum

Post a new message
Dataseries X:
11703.7
16283.6
16726.5
14968.9
14861
14583.3
15305.8
17903.9
16379.4
15420.3
17870.5
15912.8
13866.5
17823.2
17872
17420.4
16704.4
15991.2
16583.6
19123.5
17838.7
17209.4
18586.5
16258.1
15141.6
19202.1
17746.5
19090.1
18040.3
17515.5
17751.8
21072.4
17170
19439.5
19795.4
17574.9
16165.4
19464.6
19932.1
19961.2
17343.4
18924.2
18574.1
21350.6
18594.6
19823.1
20844.4
19640.2
17735.4
19813.6
22160
20664.3
17877.4
21211.2
21423.1
21688.7
23243.2
21490.2
22925.8
23184.8
18562.2


Summary of computational transaction
Raw Inputview raw input (R code)
Raw Outputview raw output of R engine
Computing time2 seconds
R Server'Sir Ronald Aylmer Fisher' @ 193.190.124.24

\begin{tabular}{lllllllll}
\hline
Summary of computational transaction \tabularnewline
Raw Input & view raw input (R code)  \tabularnewline
Raw Output & view raw output of R engine  \tabularnewline
Computing time & 2 seconds \tabularnewline
R Server & 'Sir Ronald Aylmer Fisher' @ 193.190.124.24 \tabularnewline
\hline
\end{tabular}
%Source: https://freestatistics.org/blog/index.php?pk=33833&T=0

[TABLE]
[ROW][C]Summary of computational transaction[/C][/ROW]
[ROW][C]Raw Input[/C][C]view raw input (R code) [/C][/ROW]
[ROW][C]Raw Output[/C][C]view raw output of R engine [/C][/ROW]
[ROW][C]Computing time[/C][C]2 seconds[/C][/ROW]
[ROW][C]R Server[/C][C]'Sir Ronald Aylmer Fisher' @ 193.190.124.24[/C][/ROW]
[/TABLE]
Source: https://freestatistics.org/blog/index.php?pk=33833&T=0

Globally Unique Identifier (entire table): ba.freestatistics.org/blog/index.php?pk=33833&T=0

As an alternative you can also use a QR Code:  

The GUIDs for individual cells are displayed in the table below:

Summary of computational transaction
Raw Inputview raw input (R code)
Raw Outputview raw output of R engine
Computing time2 seconds
R Server'Sir Ronald Aylmer Fisher' @ 193.190.124.24


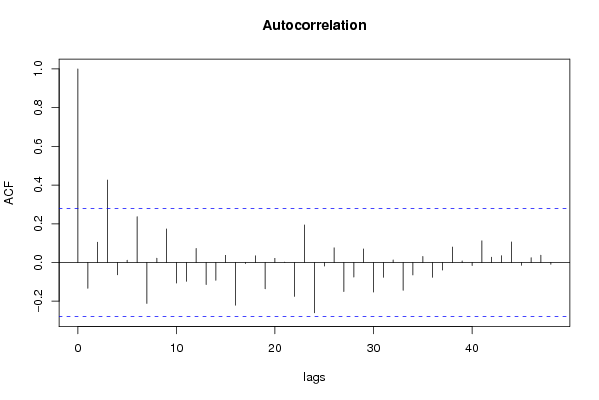
Autocorrelation Function
Time lag kACF(k)T-STATP-value
1-0.133181-0.93230.177885
20.1051180.73580.232672
30.4256242.97940.002242
4-0.064091-0.44860.327834
50.0116750.08170.467599
60.236511.65560.0521
7-0.211688-1.48180.072396
80.021620.15130.440165
90.1729491.21060.11592
10-0.106141-0.7430.230519
11-0.097161-0.68010.249812
120.0724420.50710.307181
13-0.114252-0.79980.213854
14-0.091584-0.64110.262226
150.0367120.2570.399132
16-0.220544-1.54380.064535
17-0.005512-0.03860.48469
180.0342490.23970.405764
19-0.136172-0.95320.172583
200.0212450.14870.441194
210.0011430.0080.496825
22-0.175499-1.22850.112565
230.194221.35950.0901
24-0.260447-1.82310.037194
25-0.018382-0.12870.449072
260.0754120.52790.299981
27-0.149845-1.04890.149682
28-0.075143-0.5260.300629
290.069640.48750.314047
30-0.152294-1.06610.14581
31-0.076438-0.53510.297513
320.0125820.08810.465089
33-0.143422-1.0040.160167
34-0.064237-0.44970.32747
350.0305860.21410.415678
36-0.076094-0.53270.298338
37-0.039511-0.27660.391634
380.0795120.55660.290173
390.0074550.05220.479296
40-0.015498-0.10850.457027
410.1115810.78110.219261
420.026890.18820.425738
430.0353110.24720.402902
440.1061970.74340.230402
45-0.014512-0.10160.459751
460.0248840.17420.431219
470.037680.26380.396535
48-0.009589-0.06710.473378
49NANANA
50NANANA
51NANANA
52NANANA
53NANANA
54NANANA
55NANANA
56NANANA
57NANANA
58NANANA
59NANANA
60NANANA

\begin{tabular}{lllllllll}
\hline
Autocorrelation Function \tabularnewline
Time lag k & ACF(k) & T-STAT & P-value \tabularnewline
1 & -0.133181 & -0.9323 & 0.177885 \tabularnewline
2 & 0.105118 & 0.7358 & 0.232672 \tabularnewline
3 & 0.425624 & 2.9794 & 0.002242 \tabularnewline
4 & -0.064091 & -0.4486 & 0.327834 \tabularnewline
5 & 0.011675 & 0.0817 & 0.467599 \tabularnewline
6 & 0.23651 & 1.6556 & 0.0521 \tabularnewline
7 & -0.211688 & -1.4818 & 0.072396 \tabularnewline
8 & 0.02162 & 0.1513 & 0.440165 \tabularnewline
9 & 0.172949 & 1.2106 & 0.11592 \tabularnewline
10 & -0.106141 & -0.743 & 0.230519 \tabularnewline
11 & -0.097161 & -0.6801 & 0.249812 \tabularnewline
12 & 0.072442 & 0.5071 & 0.307181 \tabularnewline
13 & -0.114252 & -0.7998 & 0.213854 \tabularnewline
14 & -0.091584 & -0.6411 & 0.262226 \tabularnewline
15 & 0.036712 & 0.257 & 0.399132 \tabularnewline
16 & -0.220544 & -1.5438 & 0.064535 \tabularnewline
17 & -0.005512 & -0.0386 & 0.48469 \tabularnewline
18 & 0.034249 & 0.2397 & 0.405764 \tabularnewline
19 & -0.136172 & -0.9532 & 0.172583 \tabularnewline
20 & 0.021245 & 0.1487 & 0.441194 \tabularnewline
21 & 0.001143 & 0.008 & 0.496825 \tabularnewline
22 & -0.175499 & -1.2285 & 0.112565 \tabularnewline
23 & 0.19422 & 1.3595 & 0.0901 \tabularnewline
24 & -0.260447 & -1.8231 & 0.037194 \tabularnewline
25 & -0.018382 & -0.1287 & 0.449072 \tabularnewline
26 & 0.075412 & 0.5279 & 0.299981 \tabularnewline
27 & -0.149845 & -1.0489 & 0.149682 \tabularnewline
28 & -0.075143 & -0.526 & 0.300629 \tabularnewline
29 & 0.06964 & 0.4875 & 0.314047 \tabularnewline
30 & -0.152294 & -1.0661 & 0.14581 \tabularnewline
31 & -0.076438 & -0.5351 & 0.297513 \tabularnewline
32 & 0.012582 & 0.0881 & 0.465089 \tabularnewline
33 & -0.143422 & -1.004 & 0.160167 \tabularnewline
34 & -0.064237 & -0.4497 & 0.32747 \tabularnewline
35 & 0.030586 & 0.2141 & 0.415678 \tabularnewline
36 & -0.076094 & -0.5327 & 0.298338 \tabularnewline
37 & -0.039511 & -0.2766 & 0.391634 \tabularnewline
38 & 0.079512 & 0.5566 & 0.290173 \tabularnewline
39 & 0.007455 & 0.0522 & 0.479296 \tabularnewline
40 & -0.015498 & -0.1085 & 0.457027 \tabularnewline
41 & 0.111581 & 0.7811 & 0.219261 \tabularnewline
42 & 0.02689 & 0.1882 & 0.425738 \tabularnewline
43 & 0.035311 & 0.2472 & 0.402902 \tabularnewline
44 & 0.106197 & 0.7434 & 0.230402 \tabularnewline
45 & -0.014512 & -0.1016 & 0.459751 \tabularnewline
46 & 0.024884 & 0.1742 & 0.431219 \tabularnewline
47 & 0.03768 & 0.2638 & 0.396535 \tabularnewline
48 & -0.009589 & -0.0671 & 0.473378 \tabularnewline
49 & NA & NA & NA \tabularnewline
50 & NA & NA & NA \tabularnewline
51 & NA & NA & NA \tabularnewline
52 & NA & NA & NA \tabularnewline
53 & NA & NA & NA \tabularnewline
54 & NA & NA & NA \tabularnewline
55 & NA & NA & NA \tabularnewline
56 & NA & NA & NA \tabularnewline
57 & NA & NA & NA \tabularnewline
58 & NA & NA & NA \tabularnewline
59 & NA & NA & NA \tabularnewline
60 & NA & NA & NA \tabularnewline
\hline
\end{tabular}
%Source: https://freestatistics.org/blog/index.php?pk=33833&T=1

[TABLE]
[ROW][C]Autocorrelation Function[/C][/ROW]
[ROW][C]Time lag k[/C][C]ACF(k)[/C][C]T-STAT[/C][C]P-value[/C][/ROW]
[ROW][C]1[/C][C]-0.133181[/C][C]-0.9323[/C][C]0.177885[/C][/ROW]
[ROW][C]2[/C][C]0.105118[/C][C]0.7358[/C][C]0.232672[/C][/ROW]
[ROW][C]3[/C][C]0.425624[/C][C]2.9794[/C][C]0.002242[/C][/ROW]
[ROW][C]4[/C][C]-0.064091[/C][C]-0.4486[/C][C]0.327834[/C][/ROW]
[ROW][C]5[/C][C]0.011675[/C][C]0.0817[/C][C]0.467599[/C][/ROW]
[ROW][C]6[/C][C]0.23651[/C][C]1.6556[/C][C]0.0521[/C][/ROW]
[ROW][C]7[/C][C]-0.211688[/C][C]-1.4818[/C][C]0.072396[/C][/ROW]
[ROW][C]8[/C][C]0.02162[/C][C]0.1513[/C][C]0.440165[/C][/ROW]
[ROW][C]9[/C][C]0.172949[/C][C]1.2106[/C][C]0.11592[/C][/ROW]
[ROW][C]10[/C][C]-0.106141[/C][C]-0.743[/C][C]0.230519[/C][/ROW]
[ROW][C]11[/C][C]-0.097161[/C][C]-0.6801[/C][C]0.249812[/C][/ROW]
[ROW][C]12[/C][C]0.072442[/C][C]0.5071[/C][C]0.307181[/C][/ROW]
[ROW][C]13[/C][C]-0.114252[/C][C]-0.7998[/C][C]0.213854[/C][/ROW]
[ROW][C]14[/C][C]-0.091584[/C][C]-0.6411[/C][C]0.262226[/C][/ROW]
[ROW][C]15[/C][C]0.036712[/C][C]0.257[/C][C]0.399132[/C][/ROW]
[ROW][C]16[/C][C]-0.220544[/C][C]-1.5438[/C][C]0.064535[/C][/ROW]
[ROW][C]17[/C][C]-0.005512[/C][C]-0.0386[/C][C]0.48469[/C][/ROW]
[ROW][C]18[/C][C]0.034249[/C][C]0.2397[/C][C]0.405764[/C][/ROW]
[ROW][C]19[/C][C]-0.136172[/C][C]-0.9532[/C][C]0.172583[/C][/ROW]
[ROW][C]20[/C][C]0.021245[/C][C]0.1487[/C][C]0.441194[/C][/ROW]
[ROW][C]21[/C][C]0.001143[/C][C]0.008[/C][C]0.496825[/C][/ROW]
[ROW][C]22[/C][C]-0.175499[/C][C]-1.2285[/C][C]0.112565[/C][/ROW]
[ROW][C]23[/C][C]0.19422[/C][C]1.3595[/C][C]0.0901[/C][/ROW]
[ROW][C]24[/C][C]-0.260447[/C][C]-1.8231[/C][C]0.037194[/C][/ROW]
[ROW][C]25[/C][C]-0.018382[/C][C]-0.1287[/C][C]0.449072[/C][/ROW]
[ROW][C]26[/C][C]0.075412[/C][C]0.5279[/C][C]0.299981[/C][/ROW]
[ROW][C]27[/C][C]-0.149845[/C][C]-1.0489[/C][C]0.149682[/C][/ROW]
[ROW][C]28[/C][C]-0.075143[/C][C]-0.526[/C][C]0.300629[/C][/ROW]
[ROW][C]29[/C][C]0.06964[/C][C]0.4875[/C][C]0.314047[/C][/ROW]
[ROW][C]30[/C][C]-0.152294[/C][C]-1.0661[/C][C]0.14581[/C][/ROW]
[ROW][C]31[/C][C]-0.076438[/C][C]-0.5351[/C][C]0.297513[/C][/ROW]
[ROW][C]32[/C][C]0.012582[/C][C]0.0881[/C][C]0.465089[/C][/ROW]
[ROW][C]33[/C][C]-0.143422[/C][C]-1.004[/C][C]0.160167[/C][/ROW]
[ROW][C]34[/C][C]-0.064237[/C][C]-0.4497[/C][C]0.32747[/C][/ROW]
[ROW][C]35[/C][C]0.030586[/C][C]0.2141[/C][C]0.415678[/C][/ROW]
[ROW][C]36[/C][C]-0.076094[/C][C]-0.5327[/C][C]0.298338[/C][/ROW]
[ROW][C]37[/C][C]-0.039511[/C][C]-0.2766[/C][C]0.391634[/C][/ROW]
[ROW][C]38[/C][C]0.079512[/C][C]0.5566[/C][C]0.290173[/C][/ROW]
[ROW][C]39[/C][C]0.007455[/C][C]0.0522[/C][C]0.479296[/C][/ROW]
[ROW][C]40[/C][C]-0.015498[/C][C]-0.1085[/C][C]0.457027[/C][/ROW]
[ROW][C]41[/C][C]0.111581[/C][C]0.7811[/C][C]0.219261[/C][/ROW]
[ROW][C]42[/C][C]0.02689[/C][C]0.1882[/C][C]0.425738[/C][/ROW]
[ROW][C]43[/C][C]0.035311[/C][C]0.2472[/C][C]0.402902[/C][/ROW]
[ROW][C]44[/C][C]0.106197[/C][C]0.7434[/C][C]0.230402[/C][/ROW]
[ROW][C]45[/C][C]-0.014512[/C][C]-0.1016[/C][C]0.459751[/C][/ROW]
[ROW][C]46[/C][C]0.024884[/C][C]0.1742[/C][C]0.431219[/C][/ROW]
[ROW][C]47[/C][C]0.03768[/C][C]0.2638[/C][C]0.396535[/C][/ROW]
[ROW][C]48[/C][C]-0.009589[/C][C]-0.0671[/C][C]0.473378[/C][/ROW]
[ROW][C]49[/C][C]NA[/C][C]NA[/C][C]NA[/C][/ROW]
[ROW][C]50[/C][C]NA[/C][C]NA[/C][C]NA[/C][/ROW]
[ROW][C]51[/C][C]NA[/C][C]NA[/C][C]NA[/C][/ROW]
[ROW][C]52[/C][C]NA[/C][C]NA[/C][C]NA[/C][/ROW]
[ROW][C]53[/C][C]NA[/C][C]NA[/C][C]NA[/C][/ROW]
[ROW][C]54[/C][C]NA[/C][C]NA[/C][C]NA[/C][/ROW]
[ROW][C]55[/C][C]NA[/C][C]NA[/C][C]NA[/C][/ROW]
[ROW][C]56[/C][C]NA[/C][C]NA[/C][C]NA[/C][/ROW]
[ROW][C]57[/C][C]NA[/C][C]NA[/C][C]NA[/C][/ROW]
[ROW][C]58[/C][C]NA[/C][C]NA[/C][C]NA[/C][/ROW]
[ROW][C]59[/C][C]NA[/C][C]NA[/C][C]NA[/C][/ROW]
[ROW][C]60[/C][C]NA[/C][C]NA[/C][C]NA[/C][/ROW]
[/TABLE]
Source: https://freestatistics.org/blog/index.php?pk=33833&T=1

Globally Unique Identifier (entire table): ba.freestatistics.org/blog/index.php?pk=33833&T=1

As an alternative you can also use a QR Code:  

The GUIDs for individual cells are displayed in the table below:

Autocorrelation Function
Time lag kACF(k)T-STATP-value
1-0.133181-0.93230.177885
20.1051180.73580.232672
30.4256242.97940.002242
4-0.064091-0.44860.327834
50.0116750.08170.467599
60.236511.65560.0521
7-0.211688-1.48180.072396
80.021620.15130.440165
90.1729491.21060.11592
10-0.106141-0.7430.230519
11-0.097161-0.68010.249812
120.0724420.50710.307181
13-0.114252-0.79980.213854
14-0.091584-0.64110.262226
150.0367120.2570.399132
16-0.220544-1.54380.064535
17-0.005512-0.03860.48469
180.0342490.23970.405764
19-0.136172-0.95320.172583
200.0212450.14870.441194
210.0011430.0080.496825
22-0.175499-1.22850.112565
230.194221.35950.0901
24-0.260447-1.82310.037194
25-0.018382-0.12870.449072
260.0754120.52790.299981
27-0.149845-1.04890.149682
28-0.075143-0.5260.300629
290.069640.48750.314047
30-0.152294-1.06610.14581
31-0.076438-0.53510.297513
320.0125820.08810.465089
33-0.143422-1.0040.160167
34-0.064237-0.44970.32747
350.0305860.21410.415678
36-0.076094-0.53270.298338
37-0.039511-0.27660.391634
380.0795120.55660.290173
390.0074550.05220.479296
40-0.015498-0.10850.457027
410.1115810.78110.219261
420.026890.18820.425738
430.0353110.24720.402902
440.1061970.74340.230402
45-0.014512-0.10160.459751
460.0248840.17420.431219
470.037680.26380.396535
48-0.009589-0.06710.473378
49NANANA
50NANANA
51NANANA
52NANANA
53NANANA
54NANANA
55NANANA
56NANANA
57NANANA
58NANANA
59NANANA
60NANANA


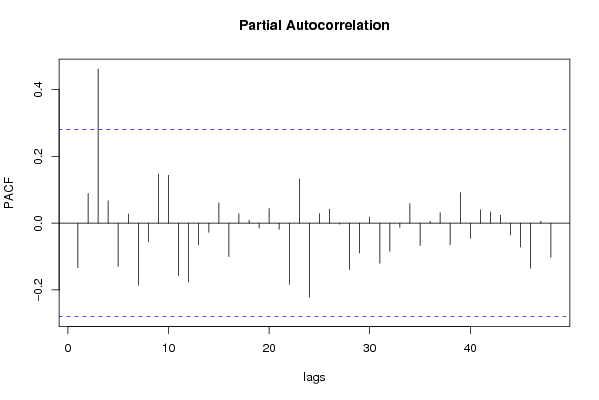
Partial Autocorrelation Function
Time lag kPACF(k)T-STATP-value
1-0.133181-0.93230.177885
20.0889590.62270.268181
30.4620123.23410.001094
40.0669710.46880.320648
5-0.129872-0.90910.183873
60.027760.19430.423364
7-0.185787-1.30050.099755
8-0.055987-0.39190.348412
90.1472341.03060.153885
100.1438051.00660.159527
11-0.157209-1.10050.138253
12-0.176291-1.2340.111537
13-0.065328-0.45730.324741
14-0.027334-0.19130.424526
150.0605390.42380.336793
16-0.099718-0.6980.24423
170.0279530.19570.422839
180.0089380.06260.475184
19-0.014462-0.10120.459888
200.043730.30610.380409
21-0.018167-0.12720.449662
22-0.182732-1.27910.103439
230.1326690.92870.178803
24-0.221012-1.54710.064139
250.0287920.20150.420554
260.0420770.29450.384794
27-0.002967-0.02080.491757
28-0.138541-0.96980.168457
29-0.089459-0.62620.267042
300.0178290.12480.450595
31-0.120285-0.8420.20194
32-0.083932-0.58750.279775
33-0.01247-0.08730.465397
340.058550.40990.34185
35-0.066881-0.46820.320869
360.0057570.04030.484008
370.0311480.2180.414153
38-0.064955-0.45470.325673
390.0916120.64130.262163
40-0.045483-0.31840.375775
410.0400160.28010.390285
420.0336350.23540.407423
430.0238320.16680.434096
44-0.035184-0.24630.403244
45-0.071669-0.50170.309068
46-0.134636-0.94250.175292
470.0056520.03960.4843
48-0.101818-0.71270.239697
49NANANA
50NANANA
51NANANA
52NANANA
53NANANA
54NANANA
55NANANA
56NANANA
57NANANA
58NANANA
59NANANA
60NANANA

\begin{tabular}{lllllllll}
\hline
Partial Autocorrelation Function \tabularnewline
Time lag k & PACF(k) & T-STAT & P-value \tabularnewline
1 & -0.133181 & -0.9323 & 0.177885 \tabularnewline
2 & 0.088959 & 0.6227 & 0.268181 \tabularnewline
3 & 0.462012 & 3.2341 & 0.001094 \tabularnewline
4 & 0.066971 & 0.4688 & 0.320648 \tabularnewline
5 & -0.129872 & -0.9091 & 0.183873 \tabularnewline
6 & 0.02776 & 0.1943 & 0.423364 \tabularnewline
7 & -0.185787 & -1.3005 & 0.099755 \tabularnewline
8 & -0.055987 & -0.3919 & 0.348412 \tabularnewline
9 & 0.147234 & 1.0306 & 0.153885 \tabularnewline
10 & 0.143805 & 1.0066 & 0.159527 \tabularnewline
11 & -0.157209 & -1.1005 & 0.138253 \tabularnewline
12 & -0.176291 & -1.234 & 0.111537 \tabularnewline
13 & -0.065328 & -0.4573 & 0.324741 \tabularnewline
14 & -0.027334 & -0.1913 & 0.424526 \tabularnewline
15 & 0.060539 & 0.4238 & 0.336793 \tabularnewline
16 & -0.099718 & -0.698 & 0.24423 \tabularnewline
17 & 0.027953 & 0.1957 & 0.422839 \tabularnewline
18 & 0.008938 & 0.0626 & 0.475184 \tabularnewline
19 & -0.014462 & -0.1012 & 0.459888 \tabularnewline
20 & 0.04373 & 0.3061 & 0.380409 \tabularnewline
21 & -0.018167 & -0.1272 & 0.449662 \tabularnewline
22 & -0.182732 & -1.2791 & 0.103439 \tabularnewline
23 & 0.132669 & 0.9287 & 0.178803 \tabularnewline
24 & -0.221012 & -1.5471 & 0.064139 \tabularnewline
25 & 0.028792 & 0.2015 & 0.420554 \tabularnewline
26 & 0.042077 & 0.2945 & 0.384794 \tabularnewline
27 & -0.002967 & -0.0208 & 0.491757 \tabularnewline
28 & -0.138541 & -0.9698 & 0.168457 \tabularnewline
29 & -0.089459 & -0.6262 & 0.267042 \tabularnewline
30 & 0.017829 & 0.1248 & 0.450595 \tabularnewline
31 & -0.120285 & -0.842 & 0.20194 \tabularnewline
32 & -0.083932 & -0.5875 & 0.279775 \tabularnewline
33 & -0.01247 & -0.0873 & 0.465397 \tabularnewline
34 & 0.05855 & 0.4099 & 0.34185 \tabularnewline
35 & -0.066881 & -0.4682 & 0.320869 \tabularnewline
36 & 0.005757 & 0.0403 & 0.484008 \tabularnewline
37 & 0.031148 & 0.218 & 0.414153 \tabularnewline
38 & -0.064955 & -0.4547 & 0.325673 \tabularnewline
39 & 0.091612 & 0.6413 & 0.262163 \tabularnewline
40 & -0.045483 & -0.3184 & 0.375775 \tabularnewline
41 & 0.040016 & 0.2801 & 0.390285 \tabularnewline
42 & 0.033635 & 0.2354 & 0.407423 \tabularnewline
43 & 0.023832 & 0.1668 & 0.434096 \tabularnewline
44 & -0.035184 & -0.2463 & 0.403244 \tabularnewline
45 & -0.071669 & -0.5017 & 0.309068 \tabularnewline
46 & -0.134636 & -0.9425 & 0.175292 \tabularnewline
47 & 0.005652 & 0.0396 & 0.4843 \tabularnewline
48 & -0.101818 & -0.7127 & 0.239697 \tabularnewline
49 & NA & NA & NA \tabularnewline
50 & NA & NA & NA \tabularnewline
51 & NA & NA & NA \tabularnewline
52 & NA & NA & NA \tabularnewline
53 & NA & NA & NA \tabularnewline
54 & NA & NA & NA \tabularnewline
55 & NA & NA & NA \tabularnewline
56 & NA & NA & NA \tabularnewline
57 & NA & NA & NA \tabularnewline
58 & NA & NA & NA \tabularnewline
59 & NA & NA & NA \tabularnewline
60 & NA & NA & NA \tabularnewline
\hline
\end{tabular}
%Source: https://freestatistics.org/blog/index.php?pk=33833&T=2

[TABLE]
[ROW][C]Partial Autocorrelation Function[/C][/ROW]
[ROW][C]Time lag k[/C][C]PACF(k)[/C][C]T-STAT[/C][C]P-value[/C][/ROW]
[ROW][C]1[/C][C]-0.133181[/C][C]-0.9323[/C][C]0.177885[/C][/ROW]
[ROW][C]2[/C][C]0.088959[/C][C]0.6227[/C][C]0.268181[/C][/ROW]
[ROW][C]3[/C][C]0.462012[/C][C]3.2341[/C][C]0.001094[/C][/ROW]
[ROW][C]4[/C][C]0.066971[/C][C]0.4688[/C][C]0.320648[/C][/ROW]
[ROW][C]5[/C][C]-0.129872[/C][C]-0.9091[/C][C]0.183873[/C][/ROW]
[ROW][C]6[/C][C]0.02776[/C][C]0.1943[/C][C]0.423364[/C][/ROW]
[ROW][C]7[/C][C]-0.185787[/C][C]-1.3005[/C][C]0.099755[/C][/ROW]
[ROW][C]8[/C][C]-0.055987[/C][C]-0.3919[/C][C]0.348412[/C][/ROW]
[ROW][C]9[/C][C]0.147234[/C][C]1.0306[/C][C]0.153885[/C][/ROW]
[ROW][C]10[/C][C]0.143805[/C][C]1.0066[/C][C]0.159527[/C][/ROW]
[ROW][C]11[/C][C]-0.157209[/C][C]-1.1005[/C][C]0.138253[/C][/ROW]
[ROW][C]12[/C][C]-0.176291[/C][C]-1.234[/C][C]0.111537[/C][/ROW]
[ROW][C]13[/C][C]-0.065328[/C][C]-0.4573[/C][C]0.324741[/C][/ROW]
[ROW][C]14[/C][C]-0.027334[/C][C]-0.1913[/C][C]0.424526[/C][/ROW]
[ROW][C]15[/C][C]0.060539[/C][C]0.4238[/C][C]0.336793[/C][/ROW]
[ROW][C]16[/C][C]-0.099718[/C][C]-0.698[/C][C]0.24423[/C][/ROW]
[ROW][C]17[/C][C]0.027953[/C][C]0.1957[/C][C]0.422839[/C][/ROW]
[ROW][C]18[/C][C]0.008938[/C][C]0.0626[/C][C]0.475184[/C][/ROW]
[ROW][C]19[/C][C]-0.014462[/C][C]-0.1012[/C][C]0.459888[/C][/ROW]
[ROW][C]20[/C][C]0.04373[/C][C]0.3061[/C][C]0.380409[/C][/ROW]
[ROW][C]21[/C][C]-0.018167[/C][C]-0.1272[/C][C]0.449662[/C][/ROW]
[ROW][C]22[/C][C]-0.182732[/C][C]-1.2791[/C][C]0.103439[/C][/ROW]
[ROW][C]23[/C][C]0.132669[/C][C]0.9287[/C][C]0.178803[/C][/ROW]
[ROW][C]24[/C][C]-0.221012[/C][C]-1.5471[/C][C]0.064139[/C][/ROW]
[ROW][C]25[/C][C]0.028792[/C][C]0.2015[/C][C]0.420554[/C][/ROW]
[ROW][C]26[/C][C]0.042077[/C][C]0.2945[/C][C]0.384794[/C][/ROW]
[ROW][C]27[/C][C]-0.002967[/C][C]-0.0208[/C][C]0.491757[/C][/ROW]
[ROW][C]28[/C][C]-0.138541[/C][C]-0.9698[/C][C]0.168457[/C][/ROW]
[ROW][C]29[/C][C]-0.089459[/C][C]-0.6262[/C][C]0.267042[/C][/ROW]
[ROW][C]30[/C][C]0.017829[/C][C]0.1248[/C][C]0.450595[/C][/ROW]
[ROW][C]31[/C][C]-0.120285[/C][C]-0.842[/C][C]0.20194[/C][/ROW]
[ROW][C]32[/C][C]-0.083932[/C][C]-0.5875[/C][C]0.279775[/C][/ROW]
[ROW][C]33[/C][C]-0.01247[/C][C]-0.0873[/C][C]0.465397[/C][/ROW]
[ROW][C]34[/C][C]0.05855[/C][C]0.4099[/C][C]0.34185[/C][/ROW]
[ROW][C]35[/C][C]-0.066881[/C][C]-0.4682[/C][C]0.320869[/C][/ROW]
[ROW][C]36[/C][C]0.005757[/C][C]0.0403[/C][C]0.484008[/C][/ROW]
[ROW][C]37[/C][C]0.031148[/C][C]0.218[/C][C]0.414153[/C][/ROW]
[ROW][C]38[/C][C]-0.064955[/C][C]-0.4547[/C][C]0.325673[/C][/ROW]
[ROW][C]39[/C][C]0.091612[/C][C]0.6413[/C][C]0.262163[/C][/ROW]
[ROW][C]40[/C][C]-0.045483[/C][C]-0.3184[/C][C]0.375775[/C][/ROW]
[ROW][C]41[/C][C]0.040016[/C][C]0.2801[/C][C]0.390285[/C][/ROW]
[ROW][C]42[/C][C]0.033635[/C][C]0.2354[/C][C]0.407423[/C][/ROW]
[ROW][C]43[/C][C]0.023832[/C][C]0.1668[/C][C]0.434096[/C][/ROW]
[ROW][C]44[/C][C]-0.035184[/C][C]-0.2463[/C][C]0.403244[/C][/ROW]
[ROW][C]45[/C][C]-0.071669[/C][C]-0.5017[/C][C]0.309068[/C][/ROW]
[ROW][C]46[/C][C]-0.134636[/C][C]-0.9425[/C][C]0.175292[/C][/ROW]
[ROW][C]47[/C][C]0.005652[/C][C]0.0396[/C][C]0.4843[/C][/ROW]
[ROW][C]48[/C][C]-0.101818[/C][C]-0.7127[/C][C]0.239697[/C][/ROW]
[ROW][C]49[/C][C]NA[/C][C]NA[/C][C]NA[/C][/ROW]
[ROW][C]50[/C][C]NA[/C][C]NA[/C][C]NA[/C][/ROW]
[ROW][C]51[/C][C]NA[/C][C]NA[/C][C]NA[/C][/ROW]
[ROW][C]52[/C][C]NA[/C][C]NA[/C][C]NA[/C][/ROW]
[ROW][C]53[/C][C]NA[/C][C]NA[/C][C]NA[/C][/ROW]
[ROW][C]54[/C][C]NA[/C][C]NA[/C][C]NA[/C][/ROW]
[ROW][C]55[/C][C]NA[/C][C]NA[/C][C]NA[/C][/ROW]
[ROW][C]56[/C][C]NA[/C][C]NA[/C][C]NA[/C][/ROW]
[ROW][C]57[/C][C]NA[/C][C]NA[/C][C]NA[/C][/ROW]
[ROW][C]58[/C][C]NA[/C][C]NA[/C][C]NA[/C][/ROW]
[ROW][C]59[/C][C]NA[/C][C]NA[/C][C]NA[/C][/ROW]
[ROW][C]60[/C][C]NA[/C][C]NA[/C][C]NA[/C][/ROW]
[/TABLE]
Source: https://freestatistics.org/blog/index.php?pk=33833&T=2

Globally Unique Identifier (entire table): ba.freestatistics.org/blog/index.php?pk=33833&T=2

As an alternative you can also use a QR Code:  

The GUIDs for individual cells are displayed in the table below:

Partial Autocorrelation Function
Time lag kPACF(k)T-STATP-value
1-0.133181-0.93230.177885
20.0889590.62270.268181
30.4620123.23410.001094
40.0669710.46880.320648
5-0.129872-0.90910.183873
60.027760.19430.423364
7-0.185787-1.30050.099755
8-0.055987-0.39190.348412
90.1472341.03060.153885
100.1438051.00660.159527
11-0.157209-1.10050.138253
12-0.176291-1.2340.111537
13-0.065328-0.45730.324741
14-0.027334-0.19130.424526
150.0605390.42380.336793
16-0.099718-0.6980.24423
170.0279530.19570.422839
180.0089380.06260.475184
19-0.014462-0.10120.459888
200.043730.30610.380409
21-0.018167-0.12720.449662
22-0.182732-1.27910.103439
230.1326690.92870.178803
24-0.221012-1.54710.064139
250.0287920.20150.420554
260.0420770.29450.384794
27-0.002967-0.02080.491757
28-0.138541-0.96980.168457
29-0.089459-0.62620.267042
300.0178290.12480.450595
31-0.120285-0.8420.20194
32-0.083932-0.58750.279775
33-0.01247-0.08730.465397
340.058550.40990.34185
35-0.066881-0.46820.320869
360.0057570.04030.484008
370.0311480.2180.414153
38-0.064955-0.45470.325673
390.0916120.64130.262163
40-0.045483-0.31840.375775
410.0400160.28010.390285
420.0336350.23540.407423
430.0238320.16680.434096
44-0.035184-0.24630.403244
45-0.071669-0.50170.309068
46-0.134636-0.94250.175292
470.0056520.03960.4843
48-0.101818-0.71270.239697
49NANANA
50NANANA
51NANANA
52NANANA
53NANANA
54NANANA
55NANANA
56NANANA
57NANANA
58NANANA
59NANANA
60NANANA


Parameters (Session):
par1 = 60 ; par2 = 1 ; par3 = 0 ; par4 = 1 ; par5 = 12 ;
Parameters (R input):
par1 = 60 ; par2 = 1 ; par3 = 0 ; par4 = 1 ; par5 = 12 ;
R code (references can be found in the software module):
if (par1 == 'Default') {
par1 = 10*log10(length(x))
} else {
par1 <- as.numeric(par1)
}
par2 <- as.numeric(par2)
par3 <- as.numeric(par3)
par4 <- as.numeric(par4)
par5 <- as.numeric(par5)
if (par2 == 0) {
x <- log(x)
} else {
x <- (x ^ par2 - 1) / par2
}
if (par3 > 0) x <- diff(x,lag=1,difference=par3)
if (par4 > 0) x <- diff(x,lag=par5,difference=par4)
bitmap(file='pic1.png')
racf <- acf(x,par1,main='Autocorrelation',xlab='lags',ylab='ACF')
dev.off()
bitmap(file='pic2.png')
rpacf <- pacf(x,par1,main='Partial Autocorrelation',xlab='lags',ylab='PACF')
dev.off()
(myacf <- c(racf$acf))
(mypacf <- c(rpacf$acf))
lengthx <- length(x)
sqrtn <- sqrt(lengthx)
load(file='createtable')
a<-table.start()
a<-table.row.start(a)
a<-table.element(a,'Autocorrelation Function',4,TRUE)
a<-table.row.end(a)
a<-table.row.start(a)
a<-table.element(a,'Time lag k',header=TRUE)
a<-table.element(a,hyperlink('basics.htm','ACF(k)','click here for more information about the Autocorrelation Function'),header=TRUE)
a<-table.element(a,'T-STAT',header=TRUE)
a<-table.element(a,'P-value',header=TRUE)
a<-table.row.end(a)
for (i in 2:(par1+1)) {
a<-table.row.start(a)
a<-table.element(a,i-1,header=TRUE)
a<-table.element(a,round(myacf[i],6))
mytstat <- myacf[i]*sqrtn
a<-table.element(a,round(mytstat,4))
a<-table.element(a,round(1-pt(abs(mytstat),lengthx),6))
a<-table.row.end(a)
}
a<-table.end(a)
table.save(a,file='mytable.tab')
a<-table.start()
a<-table.row.start(a)
a<-table.element(a,'Partial Autocorrelation Function',4,TRUE)
a<-table.row.end(a)
a<-table.row.start(a)
a<-table.element(a,'Time lag k',header=TRUE)
a<-table.element(a,hyperlink('basics.htm','PACF(k)','click here for more information about the Partial Autocorrelation Function'),header=TRUE)
a<-table.element(a,'T-STAT',header=TRUE)
a<-table.element(a,'P-value',header=TRUE)
a<-table.row.end(a)
for (i in 1:par1) {
a<-table.row.start(a)
a<-table.element(a,i,header=TRUE)
a<-table.element(a,round(mypacf[i],6))
mytstat <- mypacf[i]*sqrtn
a<-table.element(a,round(mytstat,4))
a<-table.element(a,round(1-pt(abs(mytstat),lengthx),6))
a<-table.row.end(a)
}
a<-table.end(a)
table.save(a,file='mytable1.tab')