Free Statistics

of Irreproducible Research!

Author's title

Author*The author of this computation has been verified*
R Software Modulerwasp_arimabackwardselection.wasp
Title produced by softwareARIMA Backward Selection
Date of computationMon, 15 Dec 2008 14:09:07 -0700
Cite this page as followsStatistical Computations at FreeStatistics.org, Office for Research Development and Education, URL https://freestatistics.org/blog/index.php?v=date/2008/Dec/15/t1229375494civdq0yrvg00t1w.htm/, Retrieved Wed, 15 May 2024 15:31:24 +0000
Statistical Computations at FreeStatistics.org, Office for Research Development and Education, URL https://freestatistics.org/blog/index.php?pk=33823, Retrieved Wed, 15 May 2024 15:31:24 +0000
QR Codes:

Original text written by user:
IsPrivate?No (this computation is public)
User-defined keywords
Estimated Impact200
Family? (F = Feedback message, R = changed R code, M = changed R Module, P = changed Parameters, D = changed Data)
F     [Spectral Analysis] [SA] [2008-12-03 17:24:26] [bc937651ef42bf891200cf0e0edc7238]
F   P   [Spectral Analysis] [SA eigen reeks 1 ...] [2008-12-07 19:01:53] [bc937651ef42bf891200cf0e0edc7238]
F RMP     [(Partial) Autocorrelation Function] [ACF stationaire r...] [2008-12-07 19:04:47] [bc937651ef42bf891200cf0e0edc7238]
F RMP       [ARIMA Backward Selection] [ARIMA eigen reeks] [2008-12-07 19:30:35] [bc937651ef42bf891200cf0e0edc7238]
-               [ARIMA Backward Selection] [Nieuwe arima eige...] [2008-12-15 21:09:07] [21d7d81e7693ad6dde5aadefb1046611] [Current]
Feedback Forum

Post a new message
Dataseries X:
206010
198112
194519
185705
180173
176142
203401
221902
197378
185001
176356
180449
180144
173666
165688
161570
156145
153730
182698
200765
176512
166618
158644
159585
163095
159044
155511
153745
150569
150605
179612
194690
189917
184128
175335
179566
181140
177876
175041
169292
166070
166972
206348
215706
202108
195411
193111
195198
198770
194163
190420
189733
186029
191531
232571
243477
227247
217859
208679
213188
216234
213586
209465
204045
200237
203666
241476
260307
243324
244460
233575
237217
235243
230354
227184
221678
217142
219452
256446
265845
248624
241114
229245
231805
219277
219313
212610
214771
211142
211457
240048
240636
230580
208795
197922
194596
194581
185686
178106
172608
167302
168053
202300
202388
182516
173476
166444
171297
169701
164182
161914
159612
151001
158114
186530
187069
174330
169362


Summary of computational transaction
Raw Inputview raw input (R code)
Raw Outputview raw output of R engine
Computing time6 seconds
R Server'Sir Ronald Aylmer Fisher' @ 193.190.124.24

\begin{tabular}{lllllllll}
\hline
Summary of computational transaction \tabularnewline
Raw Input & view raw input (R code)  \tabularnewline
Raw Output & view raw output of R engine  \tabularnewline
Computing time & 6 seconds \tabularnewline
R Server & 'Sir Ronald Aylmer Fisher' @ 193.190.124.24 \tabularnewline
\hline
\end{tabular}
%Source: https://freestatistics.org/blog/index.php?pk=33823&T=0

[TABLE]
[ROW][C]Summary of computational transaction[/C][/ROW]
[ROW][C]Raw Input[/C][C]view raw input (R code) [/C][/ROW]
[ROW][C]Raw Output[/C][C]view raw output of R engine [/C][/ROW]
[ROW][C]Computing time[/C][C]6 seconds[/C][/ROW]
[ROW][C]R Server[/C][C]'Sir Ronald Aylmer Fisher' @ 193.190.124.24[/C][/ROW]
[/TABLE]
Source: https://freestatistics.org/blog/index.php?pk=33823&T=0

Globally Unique Identifier (entire table): ba.freestatistics.org/blog/index.php?pk=33823&T=0

As an alternative you can also use a QR Code:  

The GUIDs for individual cells are displayed in the table below:

Summary of computational transaction
Raw Inputview raw input (R code)
Raw Outputview raw output of R engine
Computing time6 seconds
R Server'Sir Ronald Aylmer Fisher' @ 193.190.124.24


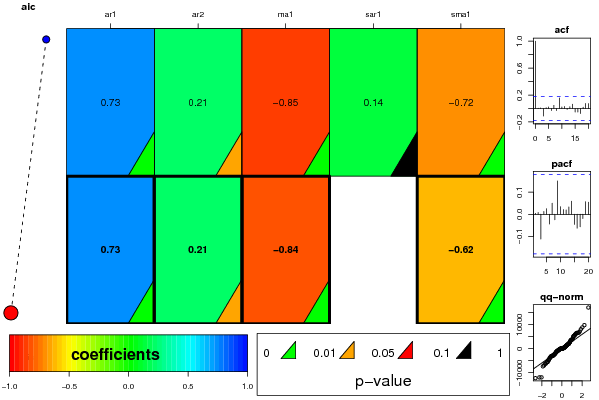
ARIMA Parameter Estimation and Backward Selection
Iterationar1ar2ma1sar1sma1
Estimates ( 1 )0.73370.2087-0.84610.1442-0.7195
(p-val)(0 )(0.0371 )(0 )(0.3815 )(0 )
Estimates ( 2 )0.73170.2123-0.83920-0.6207
(p-val)(0 )(0.0348 )(0 )(NA )(0 )
Estimates ( 3 )NANANANANA
(p-val)(NA )(NA )(NA )(NA )(NA )
Estimates ( 4 )NANANANANA
(p-val)(NA )(NA )(NA )(NA )(NA )
Estimates ( 5 )NANANANANA
(p-val)(NA )(NA )(NA )(NA )(NA )
Estimates ( 6 )NANANANANA
(p-val)(NA )(NA )(NA )(NA )(NA )
Estimates ( 7 )NANANANANA
(p-val)(NA )(NA )(NA )(NA )(NA )
Estimates ( 8 )NANANANANA
(p-val)(NA )(NA )(NA )(NA )(NA )
Estimates ( 9 )NANANANANA
(p-val)(NA )(NA )(NA )(NA )(NA )

\begin{tabular}{lllllllll}
\hline
ARIMA Parameter Estimation and Backward Selection \tabularnewline
Iteration & ar1 & ar2 & ma1 & sar1 & sma1 \tabularnewline
Estimates ( 1 ) & 0.7337 & 0.2087 & -0.8461 & 0.1442 & -0.7195 \tabularnewline
(p-val) & (0 ) & (0.0371 ) & (0 ) & (0.3815 ) & (0 ) \tabularnewline
Estimates ( 2 ) & 0.7317 & 0.2123 & -0.8392 & 0 & -0.6207 \tabularnewline
(p-val) & (0 ) & (0.0348 ) & (0 ) & (NA ) & (0 ) \tabularnewline
Estimates ( 3 ) & NA & NA & NA & NA & NA \tabularnewline
(p-val) & (NA ) & (NA ) & (NA ) & (NA ) & (NA ) \tabularnewline
Estimates ( 4 ) & NA & NA & NA & NA & NA \tabularnewline
(p-val) & (NA ) & (NA ) & (NA ) & (NA ) & (NA ) \tabularnewline
Estimates ( 5 ) & NA & NA & NA & NA & NA \tabularnewline
(p-val) & (NA ) & (NA ) & (NA ) & (NA ) & (NA ) \tabularnewline
Estimates ( 6 ) & NA & NA & NA & NA & NA \tabularnewline
(p-val) & (NA ) & (NA ) & (NA ) & (NA ) & (NA ) \tabularnewline
Estimates ( 7 ) & NA & NA & NA & NA & NA \tabularnewline
(p-val) & (NA ) & (NA ) & (NA ) & (NA ) & (NA ) \tabularnewline
Estimates ( 8 ) & NA & NA & NA & NA & NA \tabularnewline
(p-val) & (NA ) & (NA ) & (NA ) & (NA ) & (NA ) \tabularnewline
Estimates ( 9 ) & NA & NA & NA & NA & NA \tabularnewline
(p-val) & (NA ) & (NA ) & (NA ) & (NA ) & (NA ) \tabularnewline
\hline
\end{tabular}
%Source: https://freestatistics.org/blog/index.php?pk=33823&T=1

[TABLE]
[ROW][C]ARIMA Parameter Estimation and Backward Selection[/C][/ROW]
[ROW][C]Iteration[/C][C]ar1[/C][C]ar2[/C][C]ma1[/C][C]sar1[/C][C]sma1[/C][/ROW]
[ROW][C]Estimates ( 1 )[/C][C]0.7337[/C][C]0.2087[/C][C]-0.8461[/C][C]0.1442[/C][C]-0.7195[/C][/ROW]
[ROW][C](p-val)[/C][C](0 )[/C][C](0.0371 )[/C][C](0 )[/C][C](0.3815 )[/C][C](0 )[/C][/ROW]
[ROW][C]Estimates ( 2 )[/C][C]0.7317[/C][C]0.2123[/C][C]-0.8392[/C][C]0[/C][C]-0.6207[/C][/ROW]
[ROW][C](p-val)[/C][C](0 )[/C][C](0.0348 )[/C][C](0 )[/C][C](NA )[/C][C](0 )[/C][/ROW]
[ROW][C]Estimates ( 3 )[/C][C]NA[/C][C]NA[/C][C]NA[/C][C]NA[/C][C]NA[/C][/ROW]
[ROW][C](p-val)[/C][C](NA )[/C][C](NA )[/C][C](NA )[/C][C](NA )[/C][C](NA )[/C][/ROW]
[ROW][C]Estimates ( 4 )[/C][C]NA[/C][C]NA[/C][C]NA[/C][C]NA[/C][C]NA[/C][/ROW]
[ROW][C](p-val)[/C][C](NA )[/C][C](NA )[/C][C](NA )[/C][C](NA )[/C][C](NA )[/C][/ROW]
[ROW][C]Estimates ( 5 )[/C][C]NA[/C][C]NA[/C][C]NA[/C][C]NA[/C][C]NA[/C][/ROW]
[ROW][C](p-val)[/C][C](NA )[/C][C](NA )[/C][C](NA )[/C][C](NA )[/C][C](NA )[/C][/ROW]
[ROW][C]Estimates ( 6 )[/C][C]NA[/C][C]NA[/C][C]NA[/C][C]NA[/C][C]NA[/C][/ROW]
[ROW][C](p-val)[/C][C](NA )[/C][C](NA )[/C][C](NA )[/C][C](NA )[/C][C](NA )[/C][/ROW]
[ROW][C]Estimates ( 7 )[/C][C]NA[/C][C]NA[/C][C]NA[/C][C]NA[/C][C]NA[/C][/ROW]
[ROW][C](p-val)[/C][C](NA )[/C][C](NA )[/C][C](NA )[/C][C](NA )[/C][C](NA )[/C][/ROW]
[ROW][C]Estimates ( 8 )[/C][C]NA[/C][C]NA[/C][C]NA[/C][C]NA[/C][C]NA[/C][/ROW]
[ROW][C](p-val)[/C][C](NA )[/C][C](NA )[/C][C](NA )[/C][C](NA )[/C][C](NA )[/C][/ROW]
[ROW][C]Estimates ( 9 )[/C][C]NA[/C][C]NA[/C][C]NA[/C][C]NA[/C][C]NA[/C][/ROW]
[ROW][C](p-val)[/C][C](NA )[/C][C](NA )[/C][C](NA )[/C][C](NA )[/C][C](NA )[/C][/ROW]
[/TABLE]
Source: https://freestatistics.org/blog/index.php?pk=33823&T=1

Globally Unique Identifier (entire table): ba.freestatistics.org/blog/index.php?pk=33823&T=1

As an alternative you can also use a QR Code:  

The GUIDs for individual cells are displayed in the table below:

ARIMA Parameter Estimation and Backward Selection
Iterationar1ar2ma1sar1sma1
Estimates ( 1 )0.73370.2087-0.84610.1442-0.7195
(p-val)(0 )(0.0371 )(0 )(0.3815 )(0 )
Estimates ( 2 )0.73170.2123-0.83920-0.6207
(p-val)(0 )(0.0348 )(0 )(NA )(0 )
Estimates ( 3 )NANANANANA
(p-val)(NA )(NA )(NA )(NA )(NA )
Estimates ( 4 )NANANANANA
(p-val)(NA )(NA )(NA )(NA )(NA )
Estimates ( 5 )NANANANANA
(p-val)(NA )(NA )(NA )(NA )(NA )
Estimates ( 6 )NANANANANA
(p-val)(NA )(NA )(NA )(NA )(NA )
Estimates ( 7 )NANANANANA
(p-val)(NA )(NA )(NA )(NA )(NA )
Estimates ( 8 )NANANANANA
(p-val)(NA )(NA )(NA )(NA )(NA )
Estimates ( 9 )NANANANANA
(p-val)(NA )(NA )(NA )(NA )(NA )


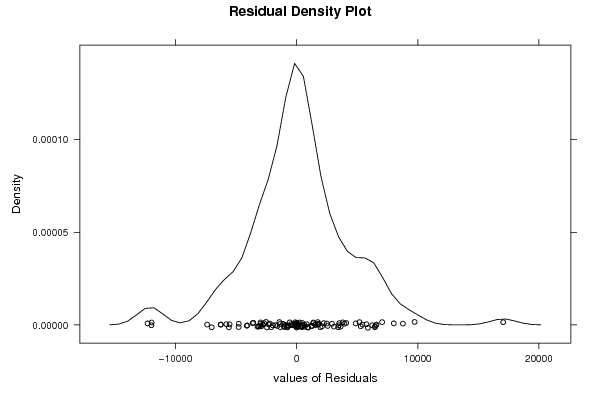
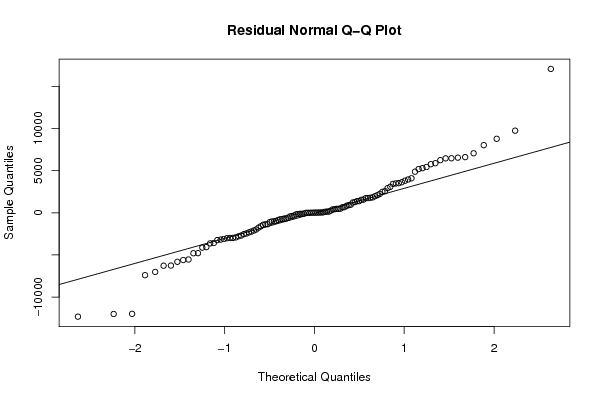
Estimated ARIMA Residuals
Value
-769.932546705033
1216.64499834768
-3629.23794989911
3517.05779589586
899.633286577829
1264.80468569016
1538.07353142721
-423.73933114818
-145.683813921562
1967.48748239816
665.066685337755
-3011.658655173
2556.62728129635
3080.84474333823
2489.88966044682
3624.80445167728
1830.66048766483
2091.45979192160
-97.9011479755479
-4130.02445491736
17057.0511947830
6466.01537961283
-2321.46405755985
-572.367182941303
-2223.04120066173
137.395269004699
251.180920298781
-3110.49849010892
-736.739839684468
1373.85599576315
9736.72040223393
-7018.79359016801
-2102.62719492037
832.768883427613
5431.20362908312
-1425.68348747281
391.6873260902
-852.088610388892
-1032.02020664003
3426.86678089199
-124.665304790022
4872.24672175761
7057.09435072997
-3238.19667556599
-3177.81284503524
-2917.63704732338
-4797.62849120631
655.763518343012
496.232823877567
1744.63129290206
-387.710758958152
-2991.14273016599
-666.298369613642
1378.23753913722
1780.73101104321
5762.5275468468
-688.486128444333
8773.00142603792
-2785.65174752468
-1983.46324873032
-5600.77191593484
-2453.92152743456
463.825960050853
-1117.63061164403
-973.66252154853
138.168306719125
952.571425684278
-6278.78413636602
-1602.57432255106
-2536.75240408020
-2694.84724949309
-316.829823779612
-12001.3327624243
4091.26482009021
-188.253311219807
8019.34432900103
2917.34666229706
-1013.95313350168
-7399.06956796278
-12318.2630705682
6598.15013973878
-11985.1601694167
-1359.06290931747
-3584.21264918455
6539.4998531738
-2980.38322450877
-1365.00962084112
-1765.80776434083
424.418930010675
1735.57445025599
3484.09337239532
-5811.2401370971
-5543.27643248552
5287.76172887286
5880.60968471602
6453.11497515146
1557.74722727481
468.164474342751
3949.2951790585
2240.86509644477
-4075.13625902431
5185.86301959626
-4787.74764971404
-6260.44992771737
3801.00124551258
6239.19826592301

\begin{tabular}{lllllllll}
\hline
Estimated ARIMA Residuals \tabularnewline
Value \tabularnewline
-769.932546705033 \tabularnewline
1216.64499834768 \tabularnewline
-3629.23794989911 \tabularnewline
3517.05779589586 \tabularnewline
899.633286577829 \tabularnewline
1264.80468569016 \tabularnewline
1538.07353142721 \tabularnewline
-423.73933114818 \tabularnewline
-145.683813921562 \tabularnewline
1967.48748239816 \tabularnewline
665.066685337755 \tabularnewline
-3011.658655173 \tabularnewline
2556.62728129635 \tabularnewline
3080.84474333823 \tabularnewline
2489.88966044682 \tabularnewline
3624.80445167728 \tabularnewline
1830.66048766483 \tabularnewline
2091.45979192160 \tabularnewline
-97.9011479755479 \tabularnewline
-4130.02445491736 \tabularnewline
17057.0511947830 \tabularnewline
6466.01537961283 \tabularnewline
-2321.46405755985 \tabularnewline
-572.367182941303 \tabularnewline
-2223.04120066173 \tabularnewline
137.395269004699 \tabularnewline
251.180920298781 \tabularnewline
-3110.49849010892 \tabularnewline
-736.739839684468 \tabularnewline
1373.85599576315 \tabularnewline
9736.72040223393 \tabularnewline
-7018.79359016801 \tabularnewline
-2102.62719492037 \tabularnewline
832.768883427613 \tabularnewline
5431.20362908312 \tabularnewline
-1425.68348747281 \tabularnewline
391.6873260902 \tabularnewline
-852.088610388892 \tabularnewline
-1032.02020664003 \tabularnewline
3426.86678089199 \tabularnewline
-124.665304790022 \tabularnewline
4872.24672175761 \tabularnewline
7057.09435072997 \tabularnewline
-3238.19667556599 \tabularnewline
-3177.81284503524 \tabularnewline
-2917.63704732338 \tabularnewline
-4797.62849120631 \tabularnewline
655.763518343012 \tabularnewline
496.232823877567 \tabularnewline
1744.63129290206 \tabularnewline
-387.710758958152 \tabularnewline
-2991.14273016599 \tabularnewline
-666.298369613642 \tabularnewline
1378.23753913722 \tabularnewline
1780.73101104321 \tabularnewline
5762.5275468468 \tabularnewline
-688.486128444333 \tabularnewline
8773.00142603792 \tabularnewline
-2785.65174752468 \tabularnewline
-1983.46324873032 \tabularnewline
-5600.77191593484 \tabularnewline
-2453.92152743456 \tabularnewline
463.825960050853 \tabularnewline
-1117.63061164403 \tabularnewline
-973.66252154853 \tabularnewline
138.168306719125 \tabularnewline
952.571425684278 \tabularnewline
-6278.78413636602 \tabularnewline
-1602.57432255106 \tabularnewline
-2536.75240408020 \tabularnewline
-2694.84724949309 \tabularnewline
-316.829823779612 \tabularnewline
-12001.3327624243 \tabularnewline
4091.26482009021 \tabularnewline
-188.253311219807 \tabularnewline
8019.34432900103 \tabularnewline
2917.34666229706 \tabularnewline
-1013.95313350168 \tabularnewline
-7399.06956796278 \tabularnewline
-12318.2630705682 \tabularnewline
6598.15013973878 \tabularnewline
-11985.1601694167 \tabularnewline
-1359.06290931747 \tabularnewline
-3584.21264918455 \tabularnewline
6539.4998531738 \tabularnewline
-2980.38322450877 \tabularnewline
-1365.00962084112 \tabularnewline
-1765.80776434083 \tabularnewline
424.418930010675 \tabularnewline
1735.57445025599 \tabularnewline
3484.09337239532 \tabularnewline
-5811.2401370971 \tabularnewline
-5543.27643248552 \tabularnewline
5287.76172887286 \tabularnewline
5880.60968471602 \tabularnewline
6453.11497515146 \tabularnewline
1557.74722727481 \tabularnewline
468.164474342751 \tabularnewline
3949.2951790585 \tabularnewline
2240.86509644477 \tabularnewline
-4075.13625902431 \tabularnewline
5185.86301959626 \tabularnewline
-4787.74764971404 \tabularnewline
-6260.44992771737 \tabularnewline
3801.00124551258 \tabularnewline
6239.19826592301 \tabularnewline
\hline
\end{tabular}
%Source: https://freestatistics.org/blog/index.php?pk=33823&T=2

[TABLE]
[ROW][C]Estimated ARIMA Residuals[/C][/ROW]
[ROW][C]Value[/C][/ROW]
[ROW][C]-769.932546705033[/C][/ROW]
[ROW][C]1216.64499834768[/C][/ROW]
[ROW][C]-3629.23794989911[/C][/ROW]
[ROW][C]3517.05779589586[/C][/ROW]
[ROW][C]899.633286577829[/C][/ROW]
[ROW][C]1264.80468569016[/C][/ROW]
[ROW][C]1538.07353142721[/C][/ROW]
[ROW][C]-423.73933114818[/C][/ROW]
[ROW][C]-145.683813921562[/C][/ROW]
[ROW][C]1967.48748239816[/C][/ROW]
[ROW][C]665.066685337755[/C][/ROW]
[ROW][C]-3011.658655173[/C][/ROW]
[ROW][C]2556.62728129635[/C][/ROW]
[ROW][C]3080.84474333823[/C][/ROW]
[ROW][C]2489.88966044682[/C][/ROW]
[ROW][C]3624.80445167728[/C][/ROW]
[ROW][C]1830.66048766483[/C][/ROW]
[ROW][C]2091.45979192160[/C][/ROW]
[ROW][C]-97.9011479755479[/C][/ROW]
[ROW][C]-4130.02445491736[/C][/ROW]
[ROW][C]17057.0511947830[/C][/ROW]
[ROW][C]6466.01537961283[/C][/ROW]
[ROW][C]-2321.46405755985[/C][/ROW]
[ROW][C]-572.367182941303[/C][/ROW]
[ROW][C]-2223.04120066173[/C][/ROW]
[ROW][C]137.395269004699[/C][/ROW]
[ROW][C]251.180920298781[/C][/ROW]
[ROW][C]-3110.49849010892[/C][/ROW]
[ROW][C]-736.739839684468[/C][/ROW]
[ROW][C]1373.85599576315[/C][/ROW]
[ROW][C]9736.72040223393[/C][/ROW]
[ROW][C]-7018.79359016801[/C][/ROW]
[ROW][C]-2102.62719492037[/C][/ROW]
[ROW][C]832.768883427613[/C][/ROW]
[ROW][C]5431.20362908312[/C][/ROW]
[ROW][C]-1425.68348747281[/C][/ROW]
[ROW][C]391.6873260902[/C][/ROW]
[ROW][C]-852.088610388892[/C][/ROW]
[ROW][C]-1032.02020664003[/C][/ROW]
[ROW][C]3426.86678089199[/C][/ROW]
[ROW][C]-124.665304790022[/C][/ROW]
[ROW][C]4872.24672175761[/C][/ROW]
[ROW][C]7057.09435072997[/C][/ROW]
[ROW][C]-3238.19667556599[/C][/ROW]
[ROW][C]-3177.81284503524[/C][/ROW]
[ROW][C]-2917.63704732338[/C][/ROW]
[ROW][C]-4797.62849120631[/C][/ROW]
[ROW][C]655.763518343012[/C][/ROW]
[ROW][C]496.232823877567[/C][/ROW]
[ROW][C]1744.63129290206[/C][/ROW]
[ROW][C]-387.710758958152[/C][/ROW]
[ROW][C]-2991.14273016599[/C][/ROW]
[ROW][C]-666.298369613642[/C][/ROW]
[ROW][C]1378.23753913722[/C][/ROW]
[ROW][C]1780.73101104321[/C][/ROW]
[ROW][C]5762.5275468468[/C][/ROW]
[ROW][C]-688.486128444333[/C][/ROW]
[ROW][C]8773.00142603792[/C][/ROW]
[ROW][C]-2785.65174752468[/C][/ROW]
[ROW][C]-1983.46324873032[/C][/ROW]
[ROW][C]-5600.77191593484[/C][/ROW]
[ROW][C]-2453.92152743456[/C][/ROW]
[ROW][C]463.825960050853[/C][/ROW]
[ROW][C]-1117.63061164403[/C][/ROW]
[ROW][C]-973.66252154853[/C][/ROW]
[ROW][C]138.168306719125[/C][/ROW]
[ROW][C]952.571425684278[/C][/ROW]
[ROW][C]-6278.78413636602[/C][/ROW]
[ROW][C]-1602.57432255106[/C][/ROW]
[ROW][C]-2536.75240408020[/C][/ROW]
[ROW][C]-2694.84724949309[/C][/ROW]
[ROW][C]-316.829823779612[/C][/ROW]
[ROW][C]-12001.3327624243[/C][/ROW]
[ROW][C]4091.26482009021[/C][/ROW]
[ROW][C]-188.253311219807[/C][/ROW]
[ROW][C]8019.34432900103[/C][/ROW]
[ROW][C]2917.34666229706[/C][/ROW]
[ROW][C]-1013.95313350168[/C][/ROW]
[ROW][C]-7399.06956796278[/C][/ROW]
[ROW][C]-12318.2630705682[/C][/ROW]
[ROW][C]6598.15013973878[/C][/ROW]
[ROW][C]-11985.1601694167[/C][/ROW]
[ROW][C]-1359.06290931747[/C][/ROW]
[ROW][C]-3584.21264918455[/C][/ROW]
[ROW][C]6539.4998531738[/C][/ROW]
[ROW][C]-2980.38322450877[/C][/ROW]
[ROW][C]-1365.00962084112[/C][/ROW]
[ROW][C]-1765.80776434083[/C][/ROW]
[ROW][C]424.418930010675[/C][/ROW]
[ROW][C]1735.57445025599[/C][/ROW]
[ROW][C]3484.09337239532[/C][/ROW]
[ROW][C]-5811.2401370971[/C][/ROW]
[ROW][C]-5543.27643248552[/C][/ROW]
[ROW][C]5287.76172887286[/C][/ROW]
[ROW][C]5880.60968471602[/C][/ROW]
[ROW][C]6453.11497515146[/C][/ROW]
[ROW][C]1557.74722727481[/C][/ROW]
[ROW][C]468.164474342751[/C][/ROW]
[ROW][C]3949.2951790585[/C][/ROW]
[ROW][C]2240.86509644477[/C][/ROW]
[ROW][C]-4075.13625902431[/C][/ROW]
[ROW][C]5185.86301959626[/C][/ROW]
[ROW][C]-4787.74764971404[/C][/ROW]
[ROW][C]-6260.44992771737[/C][/ROW]
[ROW][C]3801.00124551258[/C][/ROW]
[ROW][C]6239.19826592301[/C][/ROW]
[/TABLE]
Source: https://freestatistics.org/blog/index.php?pk=33823&T=2

Globally Unique Identifier (entire table): ba.freestatistics.org/blog/index.php?pk=33823&T=2

As an alternative you can also use a QR Code:  

The GUIDs for individual cells are displayed in the table below:

Estimated ARIMA Residuals
Value
-769.932546705033
1216.64499834768
-3629.23794989911
3517.05779589586
899.633286577829
1264.80468569016
1538.07353142721
-423.73933114818
-145.683813921562
1967.48748239816
665.066685337755
-3011.658655173
2556.62728129635
3080.84474333823
2489.88966044682
3624.80445167728
1830.66048766483
2091.45979192160
-97.9011479755479
-4130.02445491736
17057.0511947830
6466.01537961283
-2321.46405755985
-572.367182941303
-2223.04120066173
137.395269004699
251.180920298781
-3110.49849010892
-736.739839684468
1373.85599576315
9736.72040223393
-7018.79359016801
-2102.62719492037
832.768883427613
5431.20362908312
-1425.68348747281
391.6873260902
-852.088610388892
-1032.02020664003
3426.86678089199
-124.665304790022
4872.24672175761
7057.09435072997
-3238.19667556599
-3177.81284503524
-2917.63704732338
-4797.62849120631
655.763518343012
496.232823877567
1744.63129290206
-387.710758958152
-2991.14273016599
-666.298369613642
1378.23753913722
1780.73101104321
5762.5275468468
-688.486128444333
8773.00142603792
-2785.65174752468
-1983.46324873032
-5600.77191593484
-2453.92152743456
463.825960050853
-1117.63061164403
-973.66252154853
138.168306719125
952.571425684278
-6278.78413636602
-1602.57432255106
-2536.75240408020
-2694.84724949309
-316.829823779612
-12001.3327624243
4091.26482009021
-188.253311219807
8019.34432900103
2917.34666229706
-1013.95313350168
-7399.06956796278
-12318.2630705682
6598.15013973878
-11985.1601694167
-1359.06290931747
-3584.21264918455
6539.4998531738
-2980.38322450877
-1365.00962084112
-1765.80776434083
424.418930010675
1735.57445025599
3484.09337239532
-5811.2401370971
-5543.27643248552
5287.76172887286
5880.60968471602
6453.11497515146
1557.74722727481
468.164474342751
3949.2951790585
2240.86509644477
-4075.13625902431
5185.86301959626
-4787.74764971404
-6260.44992771737
3801.00124551258
6239.19826592301


Parameters (Session):
par1 = FALSE ; par2 = 0.5 ; par3 = 1 ; par4 = 1 ; par5 = 12 ; par6 = 3 ; par7 = 1 ; par8 = 2 ; par9 = 1 ;
Parameters (R input):
par1 = FALSE ; par2 = 1 ; par3 = 1 ; par4 = 1 ; par5 = 12 ; par6 = 2 ; par7 = 1 ; par8 = 1 ; par9 = 1 ;
R code (references can be found in the software module):
library(lattice)
if (par1 == 'TRUE') par1 <- TRUE
if (par1 == 'FALSE') par1 <- FALSE
par2 <- as.numeric(par2) #Box-Cox lambda transformation parameter
par3 <- as.numeric(par3) #degree of non-seasonal differencing
par4 <- as.numeric(par4) #degree of seasonal differencing
par5 <- as.numeric(par5) #seasonal period
par6 <- as.numeric(par6) #degree (p) of the non-seasonal AR(p) polynomial
par7 <- as.numeric(par7) #degree (q) of the non-seasonal MA(q) polynomial
par8 <- as.numeric(par8) #degree (P) of the seasonal AR(P) polynomial
par9 <- as.numeric(par9) #degree (Q) of the seasonal MA(Q) polynomial
armaGR <- function(arima.out, names, n){
try1 <- arima.out$coef
try2 <- sqrt(diag(arima.out$var.coef))
try.data.frame <- data.frame(matrix(NA,ncol=4,nrow=length(names)))
dimnames(try.data.frame) <- list(names,c('coef','std','tstat','pv'))
try.data.frame[,1] <- try1
for(i in 1:length(try2)) try.data.frame[which(rownames(try.data.frame)==names(try2)[i]),2] <- try2[i]
try.data.frame[,3] <- try.data.frame[,1] / try.data.frame[,2]
try.data.frame[,4] <- round((1-pt(abs(try.data.frame[,3]),df=n-(length(try2)+1)))*2,5)
vector <- rep(NA,length(names))
vector[is.na(try.data.frame[,4])] <- 0
maxi <- which.max(try.data.frame[,4])
continue <- max(try.data.frame[,4],na.rm=TRUE) > .05
vector[maxi] <- 0
list(summary=try.data.frame,next.vector=vector,continue=continue)
}
arimaSelect <- function(series, order=c(13,0,0), seasonal=list(order=c(2,0,0),period=12), include.mean=F){
nrc <- order[1]+order[3]+seasonal$order[1]+seasonal$order[3]
coeff <- matrix(NA, nrow=nrc*2, ncol=nrc)
pval <- matrix(NA, nrow=nrc*2, ncol=nrc)
mylist <- rep(list(NULL), nrc)
names <- NULL
if(order[1] > 0) names <- paste('ar',1:order[1],sep='')
if(order[3] > 0) names <- c( names , paste('ma',1:order[3],sep='') )
if(seasonal$order[1] > 0) names <- c(names, paste('sar',1:seasonal$order[1],sep=''))
if(seasonal$order[3] > 0) names <- c(names, paste('sma',1:seasonal$order[3],sep=''))
arima.out <- arima(series, order=order, seasonal=seasonal, include.mean=include.mean, method='ML')
mylist[[1]] <- arima.out
last.arma <- armaGR(arima.out, names, length(series))
mystop <- FALSE
i <- 1
coeff[i,] <- last.arma[[1]][,1]
pval [i,] <- last.arma[[1]][,4]
i <- 2
aic <- arima.out$aic
while(!mystop){
mylist[[i]] <- arima.out
arima.out <- arima(series, order=order, seasonal=seasonal, include.mean=include.mean, method='ML', fixed=last.arma$next.vector)
aic <- c(aic, arima.out$aic)
last.arma <- armaGR(arima.out, names, length(series))
mystop <- !last.arma$continue
coeff[i,] <- last.arma[[1]][,1]
pval [i,] <- last.arma[[1]][,4]
i <- i+1
}
list(coeff, pval, mylist, aic=aic)
}
arimaSelectplot <- function(arimaSelect.out,noms,choix){
noms <- names(arimaSelect.out[[3]][[1]]$coef)
coeff <- arimaSelect.out[[1]]
k <- min(which(is.na(coeff[,1])))-1
coeff <- coeff[1:k,]
pval <- arimaSelect.out[[2]][1:k,]
aic <- arimaSelect.out$aic[1:k]
coeff[coeff==0] <- NA
n <- ncol(coeff)
if(missing(choix)) choix <- k
layout(matrix(c(1,1,1,2,
3,3,3,2,
3,3,3,4,
5,6,7,7),nr=4),
widths=c(10,35,45,15),
heights=c(30,30,15,15))
couleurs <- rainbow(75)[1:50]#(50)
ticks <- pretty(coeff)
par(mar=c(1,1,3,1))
plot(aic,k:1-.5,type='o',pch=21,bg='blue',cex=2,axes=F,lty=2,xpd=NA)
points(aic[choix],k-choix+.5,pch=21,cex=4,bg=2,xpd=NA)
title('aic',line=2)
par(mar=c(3,0,0,0))
plot(0,axes=F,xlab='',ylab='',xlim=range(ticks),ylim=c(.1,1))
rect(xleft = min(ticks) + (0:49)/50*(max(ticks)-min(ticks)),
xright = min(ticks) + (1:50)/50*(max(ticks)-min(ticks)),
ytop = rep(1,50),
ybottom= rep(0,50),col=couleurs,border=NA)
axis(1,ticks)
rect(xleft=min(ticks),xright=max(ticks),ytop=1,ybottom=0)
text(mean(coeff,na.rm=T),.5,'coefficients',cex=2,font=2)
par(mar=c(1,1,3,1))
image(1:n,1:k,t(coeff[k:1,]),axes=F,col=couleurs,zlim=range(ticks))
for(i in 1:n) for(j in 1:k) if(!is.na(coeff[j,i])) {
if(pval[j,i]<.01) symb = 'green'
else if( (pval[j,i]<.05) & (pval[j,i]>=.01)) symb = 'orange'
else if( (pval[j,i]<.1) & (pval[j,i]>=.05)) symb = 'red'
else symb = 'black'
polygon(c(i+.5 ,i+.2 ,i+.5 ,i+.5),
c(k-j+0.5,k-j+0.5,k-j+0.8,k-j+0.5),
col=symb)
if(j==choix) {
rect(xleft=i-.5,
xright=i+.5,
ybottom=k-j+1.5,
ytop=k-j+.5,
lwd=4)
text(i,
k-j+1,
round(coeff[j,i],2),
cex=1.2,
font=2)
}
else{
rect(xleft=i-.5,xright=i+.5,ybottom=k-j+1.5,ytop=k-j+.5)
text(i,k-j+1,round(coeff[j,i],2),cex=1.2,font=1)
}
}
axis(3,1:n,noms)
par(mar=c(0.5,0,0,0.5))
plot(0,axes=F,xlab='',ylab='',type='n',xlim=c(0,8),ylim=c(-.2,.8))
cols <- c('green','orange','red','black')
niv <- c('0','0.01','0.05','0.1')
for(i in 0:3){
polygon(c(1+2*i ,1+2*i ,1+2*i-.5 ,1+2*i),
c(.4 ,.7 , .4 , .4),
col=cols[i+1])
text(2*i,0.5,niv[i+1],cex=1.5)
}
text(8,.5,1,cex=1.5)
text(4,0,'p-value',cex=2)
box()
residus <- arimaSelect.out[[3]][[choix]]$res
par(mar=c(1,2,4,1))
acf(residus,main='')
title('acf',line=.5)
par(mar=c(1,2,4,1))
pacf(residus,main='')
title('pacf',line=.5)
par(mar=c(2,2,4,1))
qqnorm(residus,main='')
title('qq-norm',line=.5)
qqline(residus)
residus
}
if (par2 == 0) x <- log(x)
if (par2 != 0) x <- x^par2
(selection <- arimaSelect(x, order=c(par6,par3,par7), seasonal=list(order=c(par8,par4,par9), period=par5)))
bitmap(file='test1.png')
resid <- arimaSelectplot(selection)
dev.off()
resid
bitmap(file='test2.png')
acf(resid,length(resid)/2, main='Residual Autocorrelation Function')
dev.off()
bitmap(file='test3.png')
pacf(resid,length(resid)/2, main='Residual Partial Autocorrelation Function')
dev.off()
bitmap(file='test4.png')
cpgram(resid, main='Residual Cumulative Periodogram')
dev.off()
bitmap(file='test5.png')
hist(resid, main='Residual Histogram', xlab='values of Residuals')
dev.off()
bitmap(file='test6.png')
densityplot(~resid,col='black',main='Residual Density Plot', xlab='values of Residuals')
dev.off()
bitmap(file='test7.png')
qqnorm(resid, main='Residual Normal Q-Q Plot')
qqline(resid)
dev.off()
ncols <- length(selection[[1]][1,])
nrows <- length(selection[[2]][,1])-1
load(file='createtable')
a<-table.start()
a<-table.row.start(a)
a<-table.element(a,'ARIMA Parameter Estimation and Backward Selection', ncols+1,TRUE)
a<-table.row.end(a)
a<-table.row.start(a)
a<-table.element(a,'Iteration', header=TRUE)
for (i in 1:ncols) {
a<-table.element(a,names(selection[[3]][[1]]$coef)[i],header=TRUE)
}
a<-table.row.end(a)
for (j in 1:nrows) {
a<-table.row.start(a)
mydum <- 'Estimates ('
mydum <- paste(mydum,j)
mydum <- paste(mydum,')')
a<-table.element(a,mydum, header=TRUE)
for (i in 1:ncols) {
a<-table.element(a,round(selection[[1]][j,i],4))
}
a<-table.row.end(a)
a<-table.row.start(a)
a<-table.element(a,'(p-val)', header=TRUE)
for (i in 1:ncols) {
mydum <- '('
mydum <- paste(mydum,round(selection[[2]][j,i],4),sep='')
mydum <- paste(mydum,')')
a<-table.element(a,mydum)
}
a<-table.row.end(a)
}
a<-table.end(a)
table.save(a,file='mytable.tab')
a<-table.start()
a<-table.row.start(a)
a<-table.element(a,'Estimated ARIMA Residuals', 1,TRUE)
a<-table.row.end(a)
a<-table.row.start(a)
a<-table.element(a,'Value', 1,TRUE)
a<-table.row.end(a)
for (i in (par4*par5+par3):length(resid)) {
a<-table.row.start(a)
a<-table.element(a,resid[i])
a<-table.row.end(a)
}
a<-table.end(a)
table.save(a,file='mytable1.tab')