Free Statistics

of Irreproducible Research!

Author's title

Author*The author of this computation has been verified*
R Software Modulerwasp_arimaforecasting.wasp
Title produced by softwareARIMA Forecasting
Date of computationMon, 15 Dec 2008 13:25:56 -0700
Cite this page as followsStatistical Computations at FreeStatistics.org, Office for Research Development and Education, URL https://freestatistics.org/blog/index.php?v=date/2008/Dec/15/t1229372787xcw2ou2pcbnq4rl.htm/, Retrieved Wed, 15 May 2024 11:32:09 +0000
Statistical Computations at FreeStatistics.org, Office for Research Development and Education, URL https://freestatistics.org/blog/index.php?pk=33813, Retrieved Wed, 15 May 2024 11:32:09 +0000
QR Codes:

Original text written by user:
IsPrivate?No (this computation is public)
User-defined keywords
Estimated Impact165
Family? (F = Feedback message, R = changed R code, M = changed R Module, P = changed Parameters, D = changed Data)
F     [ARIMA Forecasting] [arima forecast ex...] [2008-12-10 16:35:06] [1e1d8320a8a1170c475bf6e4ce119de6]
F         [ARIMA Forecasting] [ARIMA Forecasting] [2008-12-15 20:25:56] [02e7fb326979b65614900650d62c19a6] [Current]
- RMP       [ARIMA Backward Selection] [feedback op blog] [2008-12-16 20:22:41] [b635de6fc42b001d22cbe6e730fec936]
-   P       [ARIMA Forecasting] [feedback op blog] [2008-12-16 20:25:28] [b635de6fc42b001d22cbe6e730fec936]
Feedback Forum
2008-12-16 20:49:17 [Bas van Keken] [reply
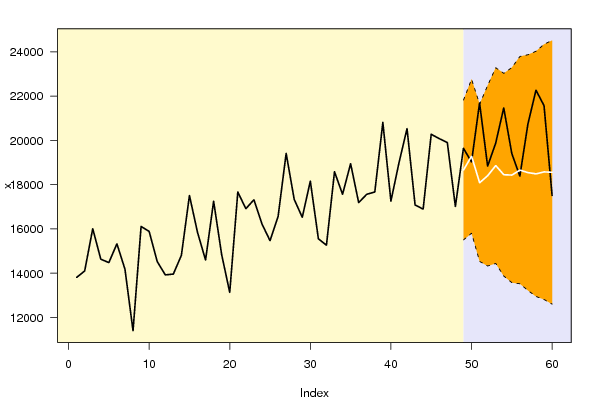
Hier had de seasonal period op 12 moeten staan. Dan zal de forecast beter overeenkomen. Verder geeft de ARIMA backword selection een AR(1),AR(3) resultaat:
http://www.freestatistics.org/blog/index.php?v=date/2008/Dec/16/t1229459053r5rum9ibifj4eqb.htm
Het staat u vrij om deze te nuanceren. De forecast is met deze parameters een stuk betrouwbaarder:
http://www.freestatistics.org/blog/index.php?v=date/2008/Dec/16/t12294591585zl4c85ooflpm0w.htm
Hier is dan ook te zien dat de P-waarden dichter bij nul liggen (met een uitschieter van 0,49). Dat wil zeggen dat de forecast nu redelijk betrouwbaar is, maar altijd nog niet onder de 5% duikt. Dat betekent dat de H0 inderdaad verworpen moet worden voor het grootste gedeelte van de F(t).
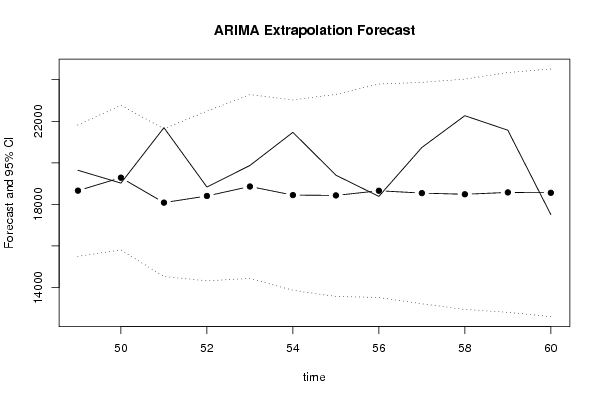
Ook de standaardfout is aanzienlijk lager en topt op 6,8% van de gevallen en de extrapolation forecast is nauwkeuriger.


Post a new message
Dataseries X:
13807.9
14101.7
16010.3
14633.1
14478.5
15327.3
14179.5
11398.2
16111.5
15887.4
14529.3
13923.1
13960.2
14807.8
17511.5
15845.9
14594.2
17252.2
14832.8
13132.1
17665.9
16913
17318.8
16224.2
15469.6
16557.5
19414.8
17335
16525.2
18160.4
15553.8
15262.2
18581
17564.1
18948.6
17187.8
17564.8
17668.4
20811.7
17257.8
18984.2
20532.6
17082.3
16894.9
20274.9
20078.6
19900.9
17012.2
19642.9
19024
21691
18835.9
19873.4
21468.2
19406.8
18385.3
20739.3
22268.3
21569
17514.8


Summary of computational transaction
Raw Inputview raw input (R code)
Raw Outputview raw output of R engine
Computing time3 seconds
R Server'Herman Ole Andreas Wold' @ 193.190.124.10:1001

\begin{tabular}{lllllllll}
\hline
Summary of computational transaction \tabularnewline
Raw Input & view raw input (R code)  \tabularnewline
Raw Output & view raw output of R engine  \tabularnewline
Computing time & 3 seconds \tabularnewline
R Server & 'Herman Ole Andreas Wold' @ 193.190.124.10:1001 \tabularnewline
\hline
\end{tabular}
%Source: https://freestatistics.org/blog/index.php?pk=33813&T=0

[TABLE]
[ROW][C]Summary of computational transaction[/C][/ROW]
[ROW][C]Raw Input[/C][C]view raw input (R code) [/C][/ROW]
[ROW][C]Raw Output[/C][C]view raw output of R engine [/C][/ROW]
[ROW][C]Computing time[/C][C]3 seconds[/C][/ROW]
[ROW][C]R Server[/C][C]'Herman Ole Andreas Wold' @ 193.190.124.10:1001[/C][/ROW]
[/TABLE]
Source: https://freestatistics.org/blog/index.php?pk=33813&T=0

Globally Unique Identifier (entire table): ba.freestatistics.org/blog/index.php?pk=33813&T=0

As an alternative you can also use a QR Code:  

The GUIDs for individual cells are displayed in the table below:

Summary of computational transaction
Raw Inputview raw input (R code)
Raw Outputview raw output of R engine
Computing time3 seconds
R Server'Herman Ole Andreas Wold' @ 193.190.124.10:1001


Univariate ARIMA Extrapolation Forecast
timeY[t]F[t]95% LB95% UBp-value(H0: Y[t] = F[t])P(F[t]>Y[t-1])P(F[t]>Y[t-s])P(F[t]>Y[48])
4719900.9-------
4817012.2-------
4919642.918662.237315502.552721821.92190.27150.8470.8470.847
501902419285.455815806.175222764.73650.44150.42020.42020.8998
512169118085.554514532.53721638.57210.02340.30230.30230.7231
5218835.918405.964414324.377422487.55140.41820.05730.05730.7483
5319873.418861.556614440.13823282.97510.32690.50450.50450.7938
5421468.218448.222813869.047623027.39790.09810.27090.27090.7306
5519406.818432.450313572.711923292.18880.34720.11040.11040.7166
5618385.318657.380913522.395223792.36670.45860.38740.38740.735
5720739.318544.403613218.39823870.40910.20960.52330.52330.7136
5822268.318487.519712946.307424028.7320.09060.21290.21290.6991
592156918577.336812811.074524343.59920.15460.10480.10480.7026
6017514.818558.711412600.766624516.65630.36560.1610.1610.6945

\begin{tabular}{lllllllll}
\hline
Univariate ARIMA Extrapolation Forecast \tabularnewline
time & Y[t] & F[t] & 95% LB & 95% UB & p-value(H0: Y[t] = F[t]) & P(F[t]>Y[t-1]) & P(F[t]>Y[t-s]) & P(F[t]>Y[48]) \tabularnewline
47 & 19900.9 & - & - & - & - & - & - & - \tabularnewline
48 & 17012.2 & - & - & - & - & - & - & - \tabularnewline
49 & 19642.9 & 18662.2373 & 15502.5527 & 21821.9219 & 0.2715 & 0.847 & 0.847 & 0.847 \tabularnewline
50 & 19024 & 19285.4558 & 15806.1752 & 22764.7365 & 0.4415 & 0.4202 & 0.4202 & 0.8998 \tabularnewline
51 & 21691 & 18085.5545 & 14532.537 & 21638.5721 & 0.0234 & 0.3023 & 0.3023 & 0.7231 \tabularnewline
52 & 18835.9 & 18405.9644 & 14324.3774 & 22487.5514 & 0.4182 & 0.0573 & 0.0573 & 0.7483 \tabularnewline
53 & 19873.4 & 18861.5566 & 14440.138 & 23282.9751 & 0.3269 & 0.5045 & 0.5045 & 0.7938 \tabularnewline
54 & 21468.2 & 18448.2228 & 13869.0476 & 23027.3979 & 0.0981 & 0.2709 & 0.2709 & 0.7306 \tabularnewline
55 & 19406.8 & 18432.4503 & 13572.7119 & 23292.1888 & 0.3472 & 0.1104 & 0.1104 & 0.7166 \tabularnewline
56 & 18385.3 & 18657.3809 & 13522.3952 & 23792.3667 & 0.4586 & 0.3874 & 0.3874 & 0.735 \tabularnewline
57 & 20739.3 & 18544.4036 & 13218.398 & 23870.4091 & 0.2096 & 0.5233 & 0.5233 & 0.7136 \tabularnewline
58 & 22268.3 & 18487.5197 & 12946.3074 & 24028.732 & 0.0906 & 0.2129 & 0.2129 & 0.6991 \tabularnewline
59 & 21569 & 18577.3368 & 12811.0745 & 24343.5992 & 0.1546 & 0.1048 & 0.1048 & 0.7026 \tabularnewline
60 & 17514.8 & 18558.7114 & 12600.7666 & 24516.6563 & 0.3656 & 0.161 & 0.161 & 0.6945 \tabularnewline
\hline
\end{tabular}
%Source: https://freestatistics.org/blog/index.php?pk=33813&T=1

[TABLE]
[ROW][C]Univariate ARIMA Extrapolation Forecast[/C][/ROW]
[ROW][C]time[/C][C]Y[t][/C][C]F[t][/C][C]95% LB[/C][C]95% UB[/C][C]p-value(H0: Y[t] = F[t])[/C][C]P(F[t]>Y[t-1])[/C][C]P(F[t]>Y[t-s])[/C][C]P(F[t]>Y[48])[/C][/ROW]
[ROW][C]47[/C][C]19900.9[/C][C]-[/C][C]-[/C][C]-[/C][C]-[/C][C]-[/C][C]-[/C][C]-[/C][/ROW]
[ROW][C]48[/C][C]17012.2[/C][C]-[/C][C]-[/C][C]-[/C][C]-[/C][C]-[/C][C]-[/C][C]-[/C][/ROW]
[ROW][C]49[/C][C]19642.9[/C][C]18662.2373[/C][C]15502.5527[/C][C]21821.9219[/C][C]0.2715[/C][C]0.847[/C][C]0.847[/C][C]0.847[/C][/ROW]
[ROW][C]50[/C][C]19024[/C][C]19285.4558[/C][C]15806.1752[/C][C]22764.7365[/C][C]0.4415[/C][C]0.4202[/C][C]0.4202[/C][C]0.8998[/C][/ROW]
[ROW][C]51[/C][C]21691[/C][C]18085.5545[/C][C]14532.537[/C][C]21638.5721[/C][C]0.0234[/C][C]0.3023[/C][C]0.3023[/C][C]0.7231[/C][/ROW]
[ROW][C]52[/C][C]18835.9[/C][C]18405.9644[/C][C]14324.3774[/C][C]22487.5514[/C][C]0.4182[/C][C]0.0573[/C][C]0.0573[/C][C]0.7483[/C][/ROW]
[ROW][C]53[/C][C]19873.4[/C][C]18861.5566[/C][C]14440.138[/C][C]23282.9751[/C][C]0.3269[/C][C]0.5045[/C][C]0.5045[/C][C]0.7938[/C][/ROW]
[ROW][C]54[/C][C]21468.2[/C][C]18448.2228[/C][C]13869.0476[/C][C]23027.3979[/C][C]0.0981[/C][C]0.2709[/C][C]0.2709[/C][C]0.7306[/C][/ROW]
[ROW][C]55[/C][C]19406.8[/C][C]18432.4503[/C][C]13572.7119[/C][C]23292.1888[/C][C]0.3472[/C][C]0.1104[/C][C]0.1104[/C][C]0.7166[/C][/ROW]
[ROW][C]56[/C][C]18385.3[/C][C]18657.3809[/C][C]13522.3952[/C][C]23792.3667[/C][C]0.4586[/C][C]0.3874[/C][C]0.3874[/C][C]0.735[/C][/ROW]
[ROW][C]57[/C][C]20739.3[/C][C]18544.4036[/C][C]13218.398[/C][C]23870.4091[/C][C]0.2096[/C][C]0.5233[/C][C]0.5233[/C][C]0.7136[/C][/ROW]
[ROW][C]58[/C][C]22268.3[/C][C]18487.5197[/C][C]12946.3074[/C][C]24028.732[/C][C]0.0906[/C][C]0.2129[/C][C]0.2129[/C][C]0.6991[/C][/ROW]
[ROW][C]59[/C][C]21569[/C][C]18577.3368[/C][C]12811.0745[/C][C]24343.5992[/C][C]0.1546[/C][C]0.1048[/C][C]0.1048[/C][C]0.7026[/C][/ROW]
[ROW][C]60[/C][C]17514.8[/C][C]18558.7114[/C][C]12600.7666[/C][C]24516.6563[/C][C]0.3656[/C][C]0.161[/C][C]0.161[/C][C]0.6945[/C][/ROW]
[/TABLE]
Source: https://freestatistics.org/blog/index.php?pk=33813&T=1

Globally Unique Identifier (entire table): ba.freestatistics.org/blog/index.php?pk=33813&T=1

As an alternative you can also use a QR Code:  

The GUIDs for individual cells are displayed in the table below:

Univariate ARIMA Extrapolation Forecast
timeY[t]F[t]95% LB95% UBp-value(H0: Y[t] = F[t])P(F[t]>Y[t-1])P(F[t]>Y[t-s])P(F[t]>Y[48])
4719900.9-------
4817012.2-------
4919642.918662.237315502.552721821.92190.27150.8470.8470.847
501902419285.455815806.175222764.73650.44150.42020.42020.8998
512169118085.554514532.53721638.57210.02340.30230.30230.7231
5218835.918405.964414324.377422487.55140.41820.05730.05730.7483
5319873.418861.556614440.13823282.97510.32690.50450.50450.7938
5421468.218448.222813869.047623027.39790.09810.27090.27090.7306
5519406.818432.450313572.711923292.18880.34720.11040.11040.7166
5618385.318657.380913522.395223792.36670.45860.38740.38740.735
5720739.318544.403613218.39823870.40910.20960.52330.52330.7136
5822268.318487.519712946.307424028.7320.09060.21290.21290.6991
592156918577.336812811.074524343.59920.15460.10480.10480.7026
6017514.818558.711412600.766624516.65630.36560.1610.1610.6945


Univariate ARIMA Extrapolation Forecast Performance
time% S.E.PEMAPESq.EMSERMSE
490.08640.05250.0044961699.362680141.6136283.0929
500.092-0.01360.001168359.15925696.596675.4758
510.10020.19940.016612999236.94991083269.74581040.8025
520.11310.02340.0019184844.590815403.7159124.1117
530.11960.05360.00451023827.160685318.93292.094
540.12660.16370.01369120262.569760021.8807871.7923
550.13450.05290.0044949357.295479113.1079281.2705
560.1404-0.01460.001274028.02976169.002578.543
570.14650.11840.00994817570.3893401464.1991633.612
580.15290.20450.01714294299.60091191191.63341091.4173
590.15840.1610.01348950048.6624745837.3885863.6188
600.1638-0.05620.00471089751.094490812.5912301.3513

\begin{tabular}{lllllllll}
\hline
Univariate ARIMA Extrapolation Forecast Performance \tabularnewline
time & % S.E. & PE & MAPE & Sq.E & MSE & RMSE \tabularnewline
49 & 0.0864 & 0.0525 & 0.0044 & 961699.3626 & 80141.6136 & 283.0929 \tabularnewline
50 & 0.092 & -0.0136 & 0.0011 & 68359.1592 & 5696.5966 & 75.4758 \tabularnewline
51 & 0.1002 & 0.1994 & 0.0166 & 12999236.9499 & 1083269.7458 & 1040.8025 \tabularnewline
52 & 0.1131 & 0.0234 & 0.0019 & 184844.5908 & 15403.7159 & 124.1117 \tabularnewline
53 & 0.1196 & 0.0536 & 0.0045 & 1023827.1606 & 85318.93 & 292.094 \tabularnewline
54 & 0.1266 & 0.1637 & 0.0136 & 9120262.569 & 760021.8807 & 871.7923 \tabularnewline
55 & 0.1345 & 0.0529 & 0.0044 & 949357.2954 & 79113.1079 & 281.2705 \tabularnewline
56 & 0.1404 & -0.0146 & 0.0012 & 74028.0297 & 6169.0025 & 78.543 \tabularnewline
57 & 0.1465 & 0.1184 & 0.0099 & 4817570.3893 & 401464.1991 & 633.612 \tabularnewline
58 & 0.1529 & 0.2045 & 0.017 & 14294299.6009 & 1191191.6334 & 1091.4173 \tabularnewline
59 & 0.1584 & 0.161 & 0.0134 & 8950048.6624 & 745837.3885 & 863.6188 \tabularnewline
60 & 0.1638 & -0.0562 & 0.0047 & 1089751.0944 & 90812.5912 & 301.3513 \tabularnewline
\hline
\end{tabular}
%Source: https://freestatistics.org/blog/index.php?pk=33813&T=2

[TABLE]
[ROW][C]Univariate ARIMA Extrapolation Forecast Performance[/C][/ROW]
[ROW][C]time[/C][C]% S.E.[/C][C]PE[/C][C]MAPE[/C][C]Sq.E[/C][C]MSE[/C][C]RMSE[/C][/ROW]
[ROW][C]49[/C][C]0.0864[/C][C]0.0525[/C][C]0.0044[/C][C]961699.3626[/C][C]80141.6136[/C][C]283.0929[/C][/ROW]
[ROW][C]50[/C][C]0.092[/C][C]-0.0136[/C][C]0.0011[/C][C]68359.1592[/C][C]5696.5966[/C][C]75.4758[/C][/ROW]
[ROW][C]51[/C][C]0.1002[/C][C]0.1994[/C][C]0.0166[/C][C]12999236.9499[/C][C]1083269.7458[/C][C]1040.8025[/C][/ROW]
[ROW][C]52[/C][C]0.1131[/C][C]0.0234[/C][C]0.0019[/C][C]184844.5908[/C][C]15403.7159[/C][C]124.1117[/C][/ROW]
[ROW][C]53[/C][C]0.1196[/C][C]0.0536[/C][C]0.0045[/C][C]1023827.1606[/C][C]85318.93[/C][C]292.094[/C][/ROW]
[ROW][C]54[/C][C]0.1266[/C][C]0.1637[/C][C]0.0136[/C][C]9120262.569[/C][C]760021.8807[/C][C]871.7923[/C][/ROW]
[ROW][C]55[/C][C]0.1345[/C][C]0.0529[/C][C]0.0044[/C][C]949357.2954[/C][C]79113.1079[/C][C]281.2705[/C][/ROW]
[ROW][C]56[/C][C]0.1404[/C][C]-0.0146[/C][C]0.0012[/C][C]74028.0297[/C][C]6169.0025[/C][C]78.543[/C][/ROW]
[ROW][C]57[/C][C]0.1465[/C][C]0.1184[/C][C]0.0099[/C][C]4817570.3893[/C][C]401464.1991[/C][C]633.612[/C][/ROW]
[ROW][C]58[/C][C]0.1529[/C][C]0.2045[/C][C]0.017[/C][C]14294299.6009[/C][C]1191191.6334[/C][C]1091.4173[/C][/ROW]
[ROW][C]59[/C][C]0.1584[/C][C]0.161[/C][C]0.0134[/C][C]8950048.6624[/C][C]745837.3885[/C][C]863.6188[/C][/ROW]
[ROW][C]60[/C][C]0.1638[/C][C]-0.0562[/C][C]0.0047[/C][C]1089751.0944[/C][C]90812.5912[/C][C]301.3513[/C][/ROW]
[/TABLE]
Source: https://freestatistics.org/blog/index.php?pk=33813&T=2

Globally Unique Identifier (entire table): ba.freestatistics.org/blog/index.php?pk=33813&T=2

As an alternative you can also use a QR Code:  

The GUIDs for individual cells are displayed in the table below:

Univariate ARIMA Extrapolation Forecast Performance
time% S.E.PEMAPESq.EMSERMSE
490.08640.05250.0044961699.362680141.6136283.0929
500.092-0.01360.001168359.15925696.596675.4758
510.10020.19940.016612999236.94991083269.74581040.8025
520.11310.02340.0019184844.590815403.7159124.1117
530.11960.05360.00451023827.160685318.93292.094
540.12660.16370.01369120262.569760021.8807871.7923
550.13450.05290.0044949357.295479113.1079281.2705
560.1404-0.01460.001274028.02976169.002578.543
570.14650.11840.00994817570.3893401464.1991633.612
580.15290.20450.01714294299.60091191191.63341091.4173
590.15840.1610.01348950048.6624745837.3885863.6188
600.1638-0.05620.00471089751.094490812.5912301.3513


Parameters (Session):
par1 = 12 ; par2 = 1 ; par3 = 0 ; par4 = 1 ; par5 = 1 ; par6 = 2 ; par7 = 0 ; par8 = 0 ; par9 = 0 ; par10 = FALSE ;
Parameters (R input):
par1 = 12 ; par2 = 1 ; par3 = 0 ; par4 = 1 ; par5 = 1 ; par6 = 2 ; par7 = 0 ; par8 = 0 ; par9 = 0 ; par10 = FALSE ;
R code (references can be found in the software module):
par1 <- as.numeric(par1) #cut off periods
par2 <- as.numeric(par2) #lambda
par3 <- as.numeric(par3) #degree of non-seasonal differencing
par4 <- as.numeric(par4) #degree of seasonal differencing
par5 <- as.numeric(par5) #seasonal period
par6 <- as.numeric(par6) #p
par7 <- as.numeric(par7) #q
par8 <- as.numeric(par8) #P
par9 <- as.numeric(par9) #Q
if (par10 == 'TRUE') par10 <- TRUE
if (par10 == 'FALSE') par10 <- FALSE
if (par2 == 0) x <- log(x)
if (par2 != 0) x <- x^par2
lx <- length(x)
first <- lx - 2*par1
nx <- lx - par1
nx1 <- nx + 1
fx <- lx - nx
if (fx < 1) {
fx <- par5
nx1 <- lx + fx - 1
first <- lx - 2*fx
}
first <- 1
if (fx < 3) fx <- round(lx/10,0)
(arima.out <- arima(x[1:nx], order=c(par6,par3,par7), seasonal=list(order=c(par8,par4,par9), period=par5), include.mean=par10, method='ML'))
(forecast <- predict(arima.out,fx))
(lb <- forecast$pred - 1.96 * forecast$se)
(ub <- forecast$pred + 1.96 * forecast$se)
if (par2 == 0) {
x <- exp(x)
forecast$pred <- exp(forecast$pred)
lb <- exp(lb)
ub <- exp(ub)
}
if (par2 != 0) {
x <- x^(1/par2)
forecast$pred <- forecast$pred^(1/par2)
lb <- lb^(1/par2)
ub <- ub^(1/par2)
}
if (par2 < 0) {
olb <- lb
lb <- ub
ub <- olb
}
(actandfor <- c(x[1:nx], forecast$pred))
(perc.se <- (ub-forecast$pred)/1.96/forecast$pred)
bitmap(file='test1.png')
opar <- par(mar=c(4,4,2,2),las=1)
ylim <- c( min(x[first:nx],lb), max(x[first:nx],ub))
plot(x,ylim=ylim,type='n',xlim=c(first,lx))
usr <- par('usr')
rect(usr[1],usr[3],nx+1,usr[4],border=NA,col='lemonchiffon')
rect(nx1,usr[3],usr[2],usr[4],border=NA,col='lavender')
abline(h= (-3:3)*2 , col ='gray', lty =3)
polygon( c(nx1:lx,lx:nx1), c(lb,rev(ub)), col = 'orange', lty=2,border=NA)
lines(nx1:lx, lb , lty=2)
lines(nx1:lx, ub , lty=2)
lines(x, lwd=2)
lines(nx1:lx, forecast$pred , lwd=2 , col ='white')
box()
par(opar)
dev.off()
prob.dec <- array(NA, dim=fx)
prob.sdec <- array(NA, dim=fx)
prob.ldec <- array(NA, dim=fx)
prob.pval <- array(NA, dim=fx)
perf.pe <- array(0, dim=fx)
perf.mape <- array(0, dim=fx)
perf.se <- array(0, dim=fx)
perf.mse <- array(0, dim=fx)
perf.rmse <- array(0, dim=fx)
for (i in 1:fx) {
locSD <- (ub[i] - forecast$pred[i]) / 1.96
perf.pe[i] = (x[nx+i] - forecast$pred[i]) / forecast$pred[i]
perf.mape[i] = perf.mape[i] + abs(perf.pe[i])
perf.se[i] = (x[nx+i] - forecast$pred[i])^2
perf.mse[i] = perf.mse[i] + perf.se[i]
prob.dec[i] = pnorm((x[nx+i-1] - forecast$pred[i]) / locSD)
prob.sdec[i] = pnorm((x[nx+i-par5] - forecast$pred[i]) / locSD)
prob.ldec[i] = pnorm((x[nx] - forecast$pred[i]) / locSD)
prob.pval[i] = pnorm(abs(x[nx+i] - forecast$pred[i]) / locSD)
}
perf.mape = perf.mape / fx
perf.mse = perf.mse / fx
perf.rmse = sqrt(perf.mse)
bitmap(file='test2.png')
plot(forecast$pred, pch=19, type='b',main='ARIMA Extrapolation Forecast', ylab='Forecast and 95% CI', xlab='time',ylim=c(min(lb),max(ub)))
dum <- forecast$pred
dum[1:12] <- x[(nx+1):lx]
lines(dum, lty=1)
lines(ub,lty=3)
lines(lb,lty=3)
dev.off()
load(file='createtable')
a<-table.start()
a<-table.row.start(a)
a<-table.element(a,'Univariate ARIMA Extrapolation Forecast',9,TRUE)
a<-table.row.end(a)
a<-table.row.start(a)
a<-table.element(a,'time',1,header=TRUE)
a<-table.element(a,'Y[t]',1,header=TRUE)
a<-table.element(a,'F[t]',1,header=TRUE)
a<-table.element(a,'95% LB',1,header=TRUE)
a<-table.element(a,'95% UB',1,header=TRUE)
a<-table.element(a,'p-value
(H0: Y[t] = F[t])',1,header=TRUE)
a<-table.element(a,'P(F[t]>Y[t-1])',1,header=TRUE)
a<-table.element(a,'P(F[t]>Y[t-s])',1,header=TRUE)
mylab <- paste('P(F[t]>Y[',nx,sep='')
mylab <- paste(mylab,'])',sep='')
a<-table.element(a,mylab,1,header=TRUE)
a<-table.row.end(a)
for (i in (nx-par5):nx) {
a<-table.row.start(a)
a<-table.element(a,i,header=TRUE)
a<-table.element(a,x[i])
a<-table.element(a,'-')
a<-table.row.end(a)
}
for (i in 1:fx) {
a<-table.row.start(a)
a<-table.element(a,nx+i,header=TRUE)
a<-table.element(a,round(x[nx+i],4))
a<-table.element(a,round(forecast$pred[i],4))
a<-table.element(a,round(lb[i],4))
a<-table.element(a,round(ub[i],4))
a<-table.element(a,round((1-prob.pval[i]),4))
a<-table.element(a,round((1-prob.dec[i]),4))
a<-table.element(a,round((1-prob.sdec[i]),4))
a<-table.element(a,round((1-prob.ldec[i]),4))
a<-table.row.end(a)
}
a<-table.end(a)
table.save(a,file='mytable.tab')
a<-table.start()
a<-table.row.start(a)
a<-table.element(a,'Univariate ARIMA Extrapolation Forecast Performance',7,TRUE)
a<-table.row.end(a)
a<-table.row.start(a)
a<-table.element(a,'time',1,header=TRUE)
a<-table.element(a,'% S.E.',1,header=TRUE)
a<-table.element(a,'PE',1,header=TRUE)
a<-table.element(a,'MAPE',1,header=TRUE)
a<-table.element(a,'Sq.E',1,header=TRUE)
a<-table.element(a,'MSE',1,header=TRUE)
a<-table.element(a,'RMSE',1,header=TRUE)
a<-table.row.end(a)
for (i in 1:fx) {
a<-table.row.start(a)
a<-table.element(a,nx+i,header=TRUE)
a<-table.element(a,round(perc.se[i],4))
a<-table.element(a,round(perf.pe[i],4))
a<-table.element(a,round(perf.mape[i],4))
a<-table.element(a,round(perf.se[i],4))
a<-table.element(a,round(perf.mse[i],4))
a<-table.element(a,round(perf.rmse[i],4))
a<-table.row.end(a)
}
a<-table.end(a)
table.save(a,file='mytable1.tab')