Free Statistics

of Irreproducible Research!

Author's title

Author*The author of this computation has been verified*
R Software Modulerwasp_arimaforecasting.wasp
Title produced by softwareARIMA Forecasting
Date of computationMon, 15 Dec 2008 12:52:13 -0700
Cite this page as followsStatistical Computations at FreeStatistics.org, Office for Research Development and Education, URL https://freestatistics.org/blog/index.php?v=date/2008/Dec/15/t1229370809i3zt5go2omnr3p2.htm/, Retrieved Thu, 16 May 2024 03:21:31 +0000
Statistical Computations at FreeStatistics.org, Office for Research Development and Education, URL https://freestatistics.org/blog/index.php?pk=33793, Retrieved Thu, 16 May 2024 03:21:31 +0000
QR Codes:

Original text written by user:
IsPrivate?No (this computation is public)
User-defined keywords
Estimated Impact149
Family? (F = Feedback message, R = changed R code, M = changed R Module, P = changed Parameters, D = changed Data)
F       [ARIMA Forecasting] [Arima forecast Q1] [2008-12-15 19:52:13] [e4cb5a8878d0401c2e8d19a1768b515b] [Current]
Feedback Forum
2008-12-22 14:03:25 [Matthieu Blondeau] [reply
Step 1:

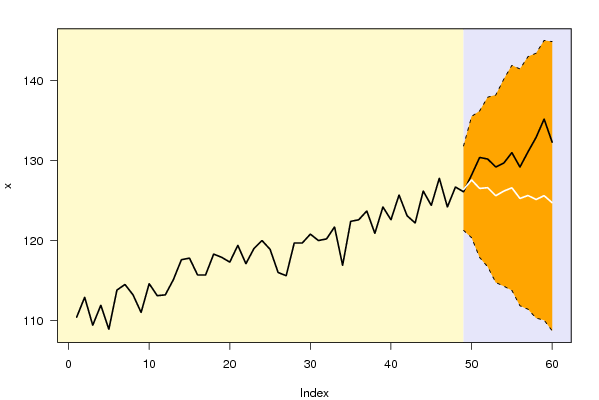
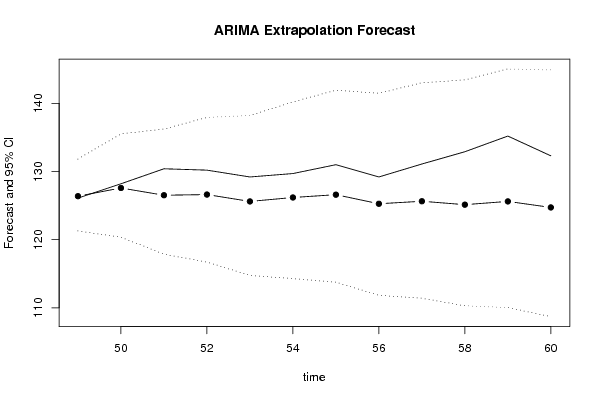
Men kan duidelijk op de grafieken zien dat de werkelijke waarden binnen het betrouwbaarheidsinterval liggen. Maar dit interval is dan ook heel erg breed. De werkelijke waarden volgen ook niet het verloop van de voorspelling. Men kan dus zeggen dat de voorspelling niet echt loopt zoals verwacht.

Step 2:

Ik zou bijna zeker zeggen dat er bij de voorspelling geen seizoenaliteit is. Wanneer men de testing period op 36 zou zetten dan is er geen seizoenaliteit te vinden, maar wel een random walk. Ik zou ook zeggen dat er geen lange termijn trend meer is. Vanaf de 40 op de grafiek kan men duidelijk een licht stijgende lijn terugvinden, deze lijn daalt terug met de voorspelling. Dit is een moeilijke reeks volgens mij, omdat bij een testing period van 12, is er nog enige golving in de voorspelling, maar als men de testing period op 36 zou zetten dan krijgen we een random walk.

Step 3:

De standaardfout is hier telkens tussen de 2,2 en 8,3 % gebleven. Dit is de verwachte afwijking van de resultaten. Als we kijken naar de werkelijke waarden dan bedragen zij een afwijking van – 0,2 tot 7,6 %.
Om te zeggen of de voorspelling accuraat is of niet, hangt af van wat men verstaat onder een (te)grote afwijking.

Step 4:

De 7de kolom is de stijgingskans ten opzichte van de vorige periode.

De 8ste kolom is de stijgingskans tegenover dezelfde maand van het vorig jaar.

De 9de kolom is de kans op stijging, berekend tegenover de laatst gekende waarde.

Step 5:

Ik vind dat het model hier een niet al te beste voorspelling maakt. De werkelijke waarden vallen hier allemaal binnen het betrouwbaarheidsinterval, maar ze liggen ver verwijdert van de voorspelling.
2008-12-23 08:02:50 [Jeroen Michel] [reply
step 1:
Je uitleg is nogal beknopt bij deze vraag. Probeer toch duidelijk je analyse te staven met concrete cijfers uit tabellen of grafieken.

Uit de tijdreeks moeten we kunnen stellen of de voorspelling al dan niet tussen de waarden ligt dankzij de betrouwbaarheidsintervallen 95% LB (benedengrens) en 95% UB (bovengrens). Dit is slechts indien de omstandigheden blijven zoals ze waren. We kunnen hier tevens ook bepalen of we met toevalligheid te maken hebben aangezien de P-waarde dit aanduidt. Deze P-waarde gaat van de nullhypothese uit, met andere woorden dat de voorspelde waarden en de werkelijke waarden niet significant verschillend zijn. Indien de P-waarde kleiner is dan 5% kunnen we wel spreken over een significant verschil aangezien deze dan verwaarloosbaar klein is.

step 2:
Je uitleg is nogal beknopt bij deze vraag. Probeer toch duidelijk je analyse te staven met concrete cijfers uit tabellen of grafieken.

Het betrouwbaarheidsinterval wordt bepaald door de stippellijn welke bij overschrijding bepaalt dat de voorspelde waarde significant verschillend is van de werkelijke waarde. Wanneer de weergegeven bolletjeslijn boven deze stippellijn komt, dan kunnen we spreken van een overschatting, eronder is een onderschatting.

step 3:
Ook hier is je uitleg nogal beknopt. Probeer toch duidelijk je analyse te staven met concrete cijfers uit tabellen of grafieken.

De werkelijke standaardfout wordt bepaald door de kolom PE terwijl de voorspelde standaardfout wordt bepaald door de kolom %SE. Deze voorspelde standaardfout is een voorspelling over hoever we met onze voorspelde waarde naast de eigenlijke waarde liggen.

step 4:
Ook hier is je uitleg nogal beknopt. Probeer toch duidelijk je analyse te staven met concrete cijfers uit tabellen of grafieken.

Hier kunnen we een waarschijnlijkheid P verkennen in de laatste kolommen.

P F(t) > Y(t-1)
De waarschijnlijkheid dat de voorspelde waarde groter is dan de werkelijke waarde van de vorige observatie = (t-1)
P F(t) > Y(t-s)
De waarschijnlijkheid dat de voorspelde waarde groter is dan de werkelijke waarde van de observatie s jaar geleden = (t-s)
P F(t) > Y(48)
De waarschijnlijkheid dat de voorspelde waarde groter is dan de laatst gekende waarde.

step 5:
Je uitleg is nogal beknopt bij deze vraag. Probeer toch duidelijk je analyse te staven met concrete cijfers uit tabellen of grafieken.

Vallen bepaalde voorspelde waarden buiten het betrouwbaarheidsinterval? Voorspelde waarden vergelijken met de werkelijke waarden!

Post a new message
Dataseries X:
110.4
112.9
109.4
111.9
108.9
113.8
114.5
113.2
111
114.6
113.1
113.2
115.1
117.6
117.8
115.7
115.7
118.3
117.9
117.3
119.4
117.1
119
120
118.9
116
115.6
119.7
119.7
120.8
120
120.2
121.7
116.9
122.4
122.6
123.7
120.9
124.2
122.6
125.7
123.1
122.2
126.2
124.4
127.8
124.2
126.7
126.1
128.2
130.4
130.2
129.2
129.7
131
129.2
131.1
132.9
135.2
132.3


Summary of computational transaction
Raw Inputview raw input (R code)
Raw Outputview raw output of R engine
Computing time3 seconds
R Server'Sir Ronald Aylmer Fisher' @ 193.190.124.24

\begin{tabular}{lllllllll}
\hline
Summary of computational transaction \tabularnewline
Raw Input & view raw input (R code)  \tabularnewline
Raw Output & view raw output of R engine  \tabularnewline
Computing time & 3 seconds \tabularnewline
R Server & 'Sir Ronald Aylmer Fisher' @ 193.190.124.24 \tabularnewline
\hline
\end{tabular}
%Source: https://freestatistics.org/blog/index.php?pk=33793&T=0

[TABLE]
[ROW][C]Summary of computational transaction[/C][/ROW]
[ROW][C]Raw Input[/C][C]view raw input (R code) [/C][/ROW]
[ROW][C]Raw Output[/C][C]view raw output of R engine [/C][/ROW]
[ROW][C]Computing time[/C][C]3 seconds[/C][/ROW]
[ROW][C]R Server[/C][C]'Sir Ronald Aylmer Fisher' @ 193.190.124.24[/C][/ROW]
[/TABLE]
Source: https://freestatistics.org/blog/index.php?pk=33793&T=0

Globally Unique Identifier (entire table): ba.freestatistics.org/blog/index.php?pk=33793&T=0

As an alternative you can also use a QR Code:  

The GUIDs for individual cells are displayed in the table below:

Summary of computational transaction
Raw Inputview raw input (R code)
Raw Outputview raw output of R engine
Computing time3 seconds
R Server'Sir Ronald Aylmer Fisher' @ 193.190.124.24


Univariate ARIMA Extrapolation Forecast
timeY[t]F[t]95% LB95% UBp-value(H0: Y[t] = F[t])P(F[t]>Y[t-1])P(F[t]>Y[t-s])P(F[t]>Y[48])
36122.6-------
37123.7-------
38120.9-------
39124.2-------
40122.6-------
41125.7-------
42123.1-------
43122.2-------
44126.2-------
45124.4-------
46127.8-------
47124.2-------
48126.7-------
49126.1126.3796121.2794131.8320.460.45420.83230.4542
50128.2127.5826120.3589135.52580.43950.64280.95040.5862
51130.4126.5179117.8749136.22140.21650.3670.68020.4853
52130.2126.6188116.7109137.94430.26770.25640.75660.4944
53129.2125.6097114.7508138.21140.28830.23760.49440.4327
54129.7126.1886114.2875140.20420.31170.33680.66710.4715
55131126.6009113.7598141.92910.28690.3460.71320.4949
56129.2125.2688111.8402141.47640.31720.24410.45520.4313
57131.1125.6368111.4042143.0190.26890.34390.55550.4523
58132.9125.1349110.2987143.4430.20290.26150.38770.4335
59135.2125.6131110.0344145.04650.16680.23120.55670.4564
60132.3124.7299108.7059144.89760.2310.15440.42410.4241

\begin{tabular}{lllllllll}
\hline
Univariate ARIMA Extrapolation Forecast \tabularnewline
time & Y[t] & F[t] & 95% LB & 95% UB & p-value(H0: Y[t] = F[t]) & P(F[t]>Y[t-1]) & P(F[t]>Y[t-s]) & P(F[t]>Y[48]) \tabularnewline
36 & 122.6 & - & - & - & - & - & - & - \tabularnewline
37 & 123.7 & - & - & - & - & - & - & - \tabularnewline
38 & 120.9 & - & - & - & - & - & - & - \tabularnewline
39 & 124.2 & - & - & - & - & - & - & - \tabularnewline
40 & 122.6 & - & - & - & - & - & - & - \tabularnewline
41 & 125.7 & - & - & - & - & - & - & - \tabularnewline
42 & 123.1 & - & - & - & - & - & - & - \tabularnewline
43 & 122.2 & - & - & - & - & - & - & - \tabularnewline
44 & 126.2 & - & - & - & - & - & - & - \tabularnewline
45 & 124.4 & - & - & - & - & - & - & - \tabularnewline
46 & 127.8 & - & - & - & - & - & - & - \tabularnewline
47 & 124.2 & - & - & - & - & - & - & - \tabularnewline
48 & 126.7 & - & - & - & - & - & - & - \tabularnewline
49 & 126.1 & 126.3796 & 121.2794 & 131.832 & 0.46 & 0.4542 & 0.8323 & 0.4542 \tabularnewline
50 & 128.2 & 127.5826 & 120.3589 & 135.5258 & 0.4395 & 0.6428 & 0.9504 & 0.5862 \tabularnewline
51 & 130.4 & 126.5179 & 117.8749 & 136.2214 & 0.2165 & 0.367 & 0.6802 & 0.4853 \tabularnewline
52 & 130.2 & 126.6188 & 116.7109 & 137.9443 & 0.2677 & 0.2564 & 0.7566 & 0.4944 \tabularnewline
53 & 129.2 & 125.6097 & 114.7508 & 138.2114 & 0.2883 & 0.2376 & 0.4944 & 0.4327 \tabularnewline
54 & 129.7 & 126.1886 & 114.2875 & 140.2042 & 0.3117 & 0.3368 & 0.6671 & 0.4715 \tabularnewline
55 & 131 & 126.6009 & 113.7598 & 141.9291 & 0.2869 & 0.346 & 0.7132 & 0.4949 \tabularnewline
56 & 129.2 & 125.2688 & 111.8402 & 141.4764 & 0.3172 & 0.2441 & 0.4552 & 0.4313 \tabularnewline
57 & 131.1 & 125.6368 & 111.4042 & 143.019 & 0.2689 & 0.3439 & 0.5555 & 0.4523 \tabularnewline
58 & 132.9 & 125.1349 & 110.2987 & 143.443 & 0.2029 & 0.2615 & 0.3877 & 0.4335 \tabularnewline
59 & 135.2 & 125.6131 & 110.0344 & 145.0465 & 0.1668 & 0.2312 & 0.5567 & 0.4564 \tabularnewline
60 & 132.3 & 124.7299 & 108.7059 & 144.8976 & 0.231 & 0.1544 & 0.4241 & 0.4241 \tabularnewline
\hline
\end{tabular}
%Source: https://freestatistics.org/blog/index.php?pk=33793&T=1

[TABLE]
[ROW][C]Univariate ARIMA Extrapolation Forecast[/C][/ROW]
[ROW][C]time[/C][C]Y[t][/C][C]F[t][/C][C]95% LB[/C][C]95% UB[/C][C]p-value(H0: Y[t] = F[t])[/C][C]P(F[t]>Y[t-1])[/C][C]P(F[t]>Y[t-s])[/C][C]P(F[t]>Y[48])[/C][/ROW]
[ROW][C]36[/C][C]122.6[/C][C]-[/C][C]-[/C][C]-[/C][C]-[/C][C]-[/C][C]-[/C][C]-[/C][/ROW]
[ROW][C]37[/C][C]123.7[/C][C]-[/C][C]-[/C][C]-[/C][C]-[/C][C]-[/C][C]-[/C][C]-[/C][/ROW]
[ROW][C]38[/C][C]120.9[/C][C]-[/C][C]-[/C][C]-[/C][C]-[/C][C]-[/C][C]-[/C][C]-[/C][/ROW]
[ROW][C]39[/C][C]124.2[/C][C]-[/C][C]-[/C][C]-[/C][C]-[/C][C]-[/C][C]-[/C][C]-[/C][/ROW]
[ROW][C]40[/C][C]122.6[/C][C]-[/C][C]-[/C][C]-[/C][C]-[/C][C]-[/C][C]-[/C][C]-[/C][/ROW]
[ROW][C]41[/C][C]125.7[/C][C]-[/C][C]-[/C][C]-[/C][C]-[/C][C]-[/C][C]-[/C][C]-[/C][/ROW]
[ROW][C]42[/C][C]123.1[/C][C]-[/C][C]-[/C][C]-[/C][C]-[/C][C]-[/C][C]-[/C][C]-[/C][/ROW]
[ROW][C]43[/C][C]122.2[/C][C]-[/C][C]-[/C][C]-[/C][C]-[/C][C]-[/C][C]-[/C][C]-[/C][/ROW]
[ROW][C]44[/C][C]126.2[/C][C]-[/C][C]-[/C][C]-[/C][C]-[/C][C]-[/C][C]-[/C][C]-[/C][/ROW]
[ROW][C]45[/C][C]124.4[/C][C]-[/C][C]-[/C][C]-[/C][C]-[/C][C]-[/C][C]-[/C][C]-[/C][/ROW]
[ROW][C]46[/C][C]127.8[/C][C]-[/C][C]-[/C][C]-[/C][C]-[/C][C]-[/C][C]-[/C][C]-[/C][/ROW]
[ROW][C]47[/C][C]124.2[/C][C]-[/C][C]-[/C][C]-[/C][C]-[/C][C]-[/C][C]-[/C][C]-[/C][/ROW]
[ROW][C]48[/C][C]126.7[/C][C]-[/C][C]-[/C][C]-[/C][C]-[/C][C]-[/C][C]-[/C][C]-[/C][/ROW]
[ROW][C]49[/C][C]126.1[/C][C]126.3796[/C][C]121.2794[/C][C]131.832[/C][C]0.46[/C][C]0.4542[/C][C]0.8323[/C][C]0.4542[/C][/ROW]
[ROW][C]50[/C][C]128.2[/C][C]127.5826[/C][C]120.3589[/C][C]135.5258[/C][C]0.4395[/C][C]0.6428[/C][C]0.9504[/C][C]0.5862[/C][/ROW]
[ROW][C]51[/C][C]130.4[/C][C]126.5179[/C][C]117.8749[/C][C]136.2214[/C][C]0.2165[/C][C]0.367[/C][C]0.6802[/C][C]0.4853[/C][/ROW]
[ROW][C]52[/C][C]130.2[/C][C]126.6188[/C][C]116.7109[/C][C]137.9443[/C][C]0.2677[/C][C]0.2564[/C][C]0.7566[/C][C]0.4944[/C][/ROW]
[ROW][C]53[/C][C]129.2[/C][C]125.6097[/C][C]114.7508[/C][C]138.2114[/C][C]0.2883[/C][C]0.2376[/C][C]0.4944[/C][C]0.4327[/C][/ROW]
[ROW][C]54[/C][C]129.7[/C][C]126.1886[/C][C]114.2875[/C][C]140.2042[/C][C]0.3117[/C][C]0.3368[/C][C]0.6671[/C][C]0.4715[/C][/ROW]
[ROW][C]55[/C][C]131[/C][C]126.6009[/C][C]113.7598[/C][C]141.9291[/C][C]0.2869[/C][C]0.346[/C][C]0.7132[/C][C]0.4949[/C][/ROW]
[ROW][C]56[/C][C]129.2[/C][C]125.2688[/C][C]111.8402[/C][C]141.4764[/C][C]0.3172[/C][C]0.2441[/C][C]0.4552[/C][C]0.4313[/C][/ROW]
[ROW][C]57[/C][C]131.1[/C][C]125.6368[/C][C]111.4042[/C][C]143.019[/C][C]0.2689[/C][C]0.3439[/C][C]0.5555[/C][C]0.4523[/C][/ROW]
[ROW][C]58[/C][C]132.9[/C][C]125.1349[/C][C]110.2987[/C][C]143.443[/C][C]0.2029[/C][C]0.2615[/C][C]0.3877[/C][C]0.4335[/C][/ROW]
[ROW][C]59[/C][C]135.2[/C][C]125.6131[/C][C]110.0344[/C][C]145.0465[/C][C]0.1668[/C][C]0.2312[/C][C]0.5567[/C][C]0.4564[/C][/ROW]
[ROW][C]60[/C][C]132.3[/C][C]124.7299[/C][C]108.7059[/C][C]144.8976[/C][C]0.231[/C][C]0.1544[/C][C]0.4241[/C][C]0.4241[/C][/ROW]
[/TABLE]
Source: https://freestatistics.org/blog/index.php?pk=33793&T=1

Globally Unique Identifier (entire table): ba.freestatistics.org/blog/index.php?pk=33793&T=1

As an alternative you can also use a QR Code:  

The GUIDs for individual cells are displayed in the table below:

Univariate ARIMA Extrapolation Forecast
timeY[t]F[t]95% LB95% UBp-value(H0: Y[t] = F[t])P(F[t]>Y[t-1])P(F[t]>Y[t-s])P(F[t]>Y[48])
36122.6-------
37123.7-------
38120.9-------
39124.2-------
40122.6-------
41125.7-------
42123.1-------
43122.2-------
44126.2-------
45124.4-------
46127.8-------
47124.2-------
48126.7-------
49126.1126.3796121.2794131.8320.460.45420.83230.4542
50128.2127.5826120.3589135.52580.43950.64280.95040.5862
51130.4126.5179117.8749136.22140.21650.3670.68020.4853
52130.2126.6188116.7109137.94430.26770.25640.75660.4944
53129.2125.6097114.7508138.21140.28830.23760.49440.4327
54129.7126.1886114.2875140.20420.31170.33680.66710.4715
55131126.6009113.7598141.92910.28690.3460.71320.4949
56129.2125.2688111.8402141.47640.31720.24410.45520.4313
57131.1125.6368111.4042143.0190.26890.34390.55550.4523
58132.9125.1349110.2987143.4430.20290.26150.38770.4335
59135.2125.6131110.0344145.04650.16680.23120.55670.4564
60132.3124.7299108.7059144.89760.2310.15440.42410.4241


Univariate ARIMA Extrapolation Forecast Performance
time% S.E.PEMAPESq.EMSERMSE
490.022-0.00222e-040.07820.00650.0807
500.03180.00484e-040.38120.03180.1782
510.03910.03070.002615.07061.25591.1207
520.04560.02830.002412.82531.06881.0338
530.05120.02860.002412.891.07421.0364
540.05670.02780.002312.331.02751.0137
550.06180.03470.002919.35161.61261.2699
560.0660.03140.002615.45461.28791.1349
570.07060.04350.003629.84682.48721.5771
580.07460.06210.005260.29615.02472.2416
590.07890.07630.006491.9097.65912.7675
600.08250.06070.005157.3074.77562.1853

\begin{tabular}{lllllllll}
\hline
Univariate ARIMA Extrapolation Forecast Performance \tabularnewline
time & % S.E. & PE & MAPE & Sq.E & MSE & RMSE \tabularnewline
49 & 0.022 & -0.0022 & 2e-04 & 0.0782 & 0.0065 & 0.0807 \tabularnewline
50 & 0.0318 & 0.0048 & 4e-04 & 0.3812 & 0.0318 & 0.1782 \tabularnewline
51 & 0.0391 & 0.0307 & 0.0026 & 15.0706 & 1.2559 & 1.1207 \tabularnewline
52 & 0.0456 & 0.0283 & 0.0024 & 12.8253 & 1.0688 & 1.0338 \tabularnewline
53 & 0.0512 & 0.0286 & 0.0024 & 12.89 & 1.0742 & 1.0364 \tabularnewline
54 & 0.0567 & 0.0278 & 0.0023 & 12.33 & 1.0275 & 1.0137 \tabularnewline
55 & 0.0618 & 0.0347 & 0.0029 & 19.3516 & 1.6126 & 1.2699 \tabularnewline
56 & 0.066 & 0.0314 & 0.0026 & 15.4546 & 1.2879 & 1.1349 \tabularnewline
57 & 0.0706 & 0.0435 & 0.0036 & 29.8468 & 2.4872 & 1.5771 \tabularnewline
58 & 0.0746 & 0.0621 & 0.0052 & 60.2961 & 5.0247 & 2.2416 \tabularnewline
59 & 0.0789 & 0.0763 & 0.0064 & 91.909 & 7.6591 & 2.7675 \tabularnewline
60 & 0.0825 & 0.0607 & 0.0051 & 57.307 & 4.7756 & 2.1853 \tabularnewline
\hline
\end{tabular}
%Source: https://freestatistics.org/blog/index.php?pk=33793&T=2

[TABLE]
[ROW][C]Univariate ARIMA Extrapolation Forecast Performance[/C][/ROW]
[ROW][C]time[/C][C]% S.E.[/C][C]PE[/C][C]MAPE[/C][C]Sq.E[/C][C]MSE[/C][C]RMSE[/C][/ROW]
[ROW][C]49[/C][C]0.022[/C][C]-0.0022[/C][C]2e-04[/C][C]0.0782[/C][C]0.0065[/C][C]0.0807[/C][/ROW]
[ROW][C]50[/C][C]0.0318[/C][C]0.0048[/C][C]4e-04[/C][C]0.3812[/C][C]0.0318[/C][C]0.1782[/C][/ROW]
[ROW][C]51[/C][C]0.0391[/C][C]0.0307[/C][C]0.0026[/C][C]15.0706[/C][C]1.2559[/C][C]1.1207[/C][/ROW]
[ROW][C]52[/C][C]0.0456[/C][C]0.0283[/C][C]0.0024[/C][C]12.8253[/C][C]1.0688[/C][C]1.0338[/C][/ROW]
[ROW][C]53[/C][C]0.0512[/C][C]0.0286[/C][C]0.0024[/C][C]12.89[/C][C]1.0742[/C][C]1.0364[/C][/ROW]
[ROW][C]54[/C][C]0.0567[/C][C]0.0278[/C][C]0.0023[/C][C]12.33[/C][C]1.0275[/C][C]1.0137[/C][/ROW]
[ROW][C]55[/C][C]0.0618[/C][C]0.0347[/C][C]0.0029[/C][C]19.3516[/C][C]1.6126[/C][C]1.2699[/C][/ROW]
[ROW][C]56[/C][C]0.066[/C][C]0.0314[/C][C]0.0026[/C][C]15.4546[/C][C]1.2879[/C][C]1.1349[/C][/ROW]
[ROW][C]57[/C][C]0.0706[/C][C]0.0435[/C][C]0.0036[/C][C]29.8468[/C][C]2.4872[/C][C]1.5771[/C][/ROW]
[ROW][C]58[/C][C]0.0746[/C][C]0.0621[/C][C]0.0052[/C][C]60.2961[/C][C]5.0247[/C][C]2.2416[/C][/ROW]
[ROW][C]59[/C][C]0.0789[/C][C]0.0763[/C][C]0.0064[/C][C]91.909[/C][C]7.6591[/C][C]2.7675[/C][/ROW]
[ROW][C]60[/C][C]0.0825[/C][C]0.0607[/C][C]0.0051[/C][C]57.307[/C][C]4.7756[/C][C]2.1853[/C][/ROW]
[/TABLE]
Source: https://freestatistics.org/blog/index.php?pk=33793&T=2

Globally Unique Identifier (entire table): ba.freestatistics.org/blog/index.php?pk=33793&T=2

As an alternative you can also use a QR Code:  

The GUIDs for individual cells are displayed in the table below:

Univariate ARIMA Extrapolation Forecast Performance
time% S.E.PEMAPESq.EMSERMSE
490.022-0.00222e-040.07820.00650.0807
500.03180.00484e-040.38120.03180.1782
510.03910.03070.002615.07061.25591.1207
520.04560.02830.002412.82531.06881.0338
530.05120.02860.002412.891.07421.0364
540.05670.02780.002312.331.02751.0137
550.06180.03470.002919.35161.61261.2699
560.0660.03140.002615.45461.28791.1349
570.07060.04350.003629.84682.48721.5771
580.07460.06210.005260.29615.02472.2416
590.07890.07630.006491.9097.65912.7675
600.08250.06070.005157.3074.77562.1853


Parameters (Session):
par1 = 12 ; par2 = -0.6 ; par3 = 1 ; par4 = 0 ; par5 = 12 ; par6 = 0 ; par7 = 0 ; par8 = 0 ; par9 = 1 ; par10 = FALSE ;
Parameters (R input):
par1 = 12 ; par2 = -0.6 ; par3 = 1 ; par4 = 0 ; par5 = 12 ; par6 = 0 ; par7 = 0 ; par8 = 0 ; par9 = 1 ; par10 = FALSE ;
R code (references can be found in the software module):
par1 <- as.numeric(par1) #cut off periods
par2 <- as.numeric(par2) #lambda
par3 <- as.numeric(par3) #degree of non-seasonal differencing
par4 <- as.numeric(par4) #degree of seasonal differencing
par5 <- as.numeric(par5) #seasonal period
par6 <- as.numeric(par6) #p
par7 <- as.numeric(par7) #q
par8 <- as.numeric(par8) #P
par9 <- as.numeric(par9) #Q
if (par10 == 'TRUE') par10 <- TRUE
if (par10 == 'FALSE') par10 <- FALSE
if (par2 == 0) x <- log(x)
if (par2 != 0) x <- x^par2
lx <- length(x)
first <- lx - 2*par1
nx <- lx - par1
nx1 <- nx + 1
fx <- lx - nx
if (fx < 1) {
fx <- par5
nx1 <- lx + fx - 1
first <- lx - 2*fx
}
first <- 1
if (fx < 3) fx <- round(lx/10,0)
(arima.out <- arima(x[1:nx], order=c(par6,par3,par7), seasonal=list(order=c(par8,par4,par9), period=par5), include.mean=par10, method='ML'))
(forecast <- predict(arima.out,fx))
(lb <- forecast$pred - 1.96 * forecast$se)
(ub <- forecast$pred + 1.96 * forecast$se)
if (par2 == 0) {
x <- exp(x)
forecast$pred <- exp(forecast$pred)
lb <- exp(lb)
ub <- exp(ub)
}
if (par2 != 0) {
x <- x^(1/par2)
forecast$pred <- forecast$pred^(1/par2)
lb <- lb^(1/par2)
ub <- ub^(1/par2)
}
if (par2 < 0) {
olb <- lb
lb <- ub
ub <- olb
}
(actandfor <- c(x[1:nx], forecast$pred))
(perc.se <- (ub-forecast$pred)/1.96/forecast$pred)
bitmap(file='test1.png')
opar <- par(mar=c(4,4,2,2),las=1)
ylim <- c( min(x[first:nx],lb), max(x[first:nx],ub))
plot(x,ylim=ylim,type='n',xlim=c(first,lx))
usr <- par('usr')
rect(usr[1],usr[3],nx+1,usr[4],border=NA,col='lemonchiffon')
rect(nx1,usr[3],usr[2],usr[4],border=NA,col='lavender')
abline(h= (-3:3)*2 , col ='gray', lty =3)
polygon( c(nx1:lx,lx:nx1), c(lb,rev(ub)), col = 'orange', lty=2,border=NA)
lines(nx1:lx, lb , lty=2)
lines(nx1:lx, ub , lty=2)
lines(x, lwd=2)
lines(nx1:lx, forecast$pred , lwd=2 , col ='white')
box()
par(opar)
dev.off()
prob.dec <- array(NA, dim=fx)
prob.sdec <- array(NA, dim=fx)
prob.ldec <- array(NA, dim=fx)
prob.pval <- array(NA, dim=fx)
perf.pe <- array(0, dim=fx)
perf.mape <- array(0, dim=fx)
perf.se <- array(0, dim=fx)
perf.mse <- array(0, dim=fx)
perf.rmse <- array(0, dim=fx)
for (i in 1:fx) {
locSD <- (ub[i] - forecast$pred[i]) / 1.96
perf.pe[i] = (x[nx+i] - forecast$pred[i]) / forecast$pred[i]
perf.mape[i] = perf.mape[i] + abs(perf.pe[i])
perf.se[i] = (x[nx+i] - forecast$pred[i])^2
perf.mse[i] = perf.mse[i] + perf.se[i]
prob.dec[i] = pnorm((x[nx+i-1] - forecast$pred[i]) / locSD)
prob.sdec[i] = pnorm((x[nx+i-par5] - forecast$pred[i]) / locSD)
prob.ldec[i] = pnorm((x[nx] - forecast$pred[i]) / locSD)
prob.pval[i] = pnorm(abs(x[nx+i] - forecast$pred[i]) / locSD)
}
perf.mape = perf.mape / fx
perf.mse = perf.mse / fx
perf.rmse = sqrt(perf.mse)
bitmap(file='test2.png')
plot(forecast$pred, pch=19, type='b',main='ARIMA Extrapolation Forecast', ylab='Forecast and 95% CI', xlab='time',ylim=c(min(lb),max(ub)))
dum <- forecast$pred
dum[1:12] <- x[(nx+1):lx]
lines(dum, lty=1)
lines(ub,lty=3)
lines(lb,lty=3)
dev.off()
load(file='createtable')
a<-table.start()
a<-table.row.start(a)
a<-table.element(a,'Univariate ARIMA Extrapolation Forecast',9,TRUE)
a<-table.row.end(a)
a<-table.row.start(a)
a<-table.element(a,'time',1,header=TRUE)
a<-table.element(a,'Y[t]',1,header=TRUE)
a<-table.element(a,'F[t]',1,header=TRUE)
a<-table.element(a,'95% LB',1,header=TRUE)
a<-table.element(a,'95% UB',1,header=TRUE)
a<-table.element(a,'p-value
(H0: Y[t] = F[t])',1,header=TRUE)
a<-table.element(a,'P(F[t]>Y[t-1])',1,header=TRUE)
a<-table.element(a,'P(F[t]>Y[t-s])',1,header=TRUE)
mylab <- paste('P(F[t]>Y[',nx,sep='')
mylab <- paste(mylab,'])',sep='')
a<-table.element(a,mylab,1,header=TRUE)
a<-table.row.end(a)
for (i in (nx-par5):nx) {
a<-table.row.start(a)
a<-table.element(a,i,header=TRUE)
a<-table.element(a,x[i])
a<-table.element(a,'-')
a<-table.row.end(a)
}
for (i in 1:fx) {
a<-table.row.start(a)
a<-table.element(a,nx+i,header=TRUE)
a<-table.element(a,round(x[nx+i],4))
a<-table.element(a,round(forecast$pred[i],4))
a<-table.element(a,round(lb[i],4))
a<-table.element(a,round(ub[i],4))
a<-table.element(a,round((1-prob.pval[i]),4))
a<-table.element(a,round((1-prob.dec[i]),4))
a<-table.element(a,round((1-prob.sdec[i]),4))
a<-table.element(a,round((1-prob.ldec[i]),4))
a<-table.row.end(a)
}
a<-table.end(a)
table.save(a,file='mytable.tab')
a<-table.start()
a<-table.row.start(a)
a<-table.element(a,'Univariate ARIMA Extrapolation Forecast Performance',7,TRUE)
a<-table.row.end(a)
a<-table.row.start(a)
a<-table.element(a,'time',1,header=TRUE)
a<-table.element(a,'% S.E.',1,header=TRUE)
a<-table.element(a,'PE',1,header=TRUE)
a<-table.element(a,'MAPE',1,header=TRUE)
a<-table.element(a,'Sq.E',1,header=TRUE)
a<-table.element(a,'MSE',1,header=TRUE)
a<-table.element(a,'RMSE',1,header=TRUE)
a<-table.row.end(a)
for (i in 1:fx) {
a<-table.row.start(a)
a<-table.element(a,nx+i,header=TRUE)
a<-table.element(a,round(perc.se[i],4))
a<-table.element(a,round(perf.pe[i],4))
a<-table.element(a,round(perf.mape[i],4))
a<-table.element(a,round(perf.se[i],4))
a<-table.element(a,round(perf.mse[i],4))
a<-table.element(a,round(perf.rmse[i],4))
a<-table.row.end(a)
}
a<-table.end(a)
table.save(a,file='mytable1.tab')