Free Statistics

of Irreproducible Research!

Author's title

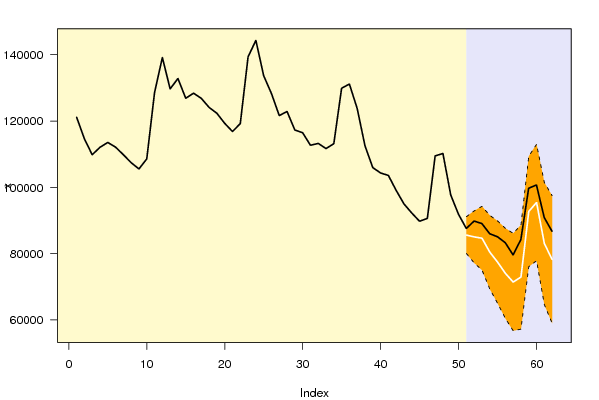
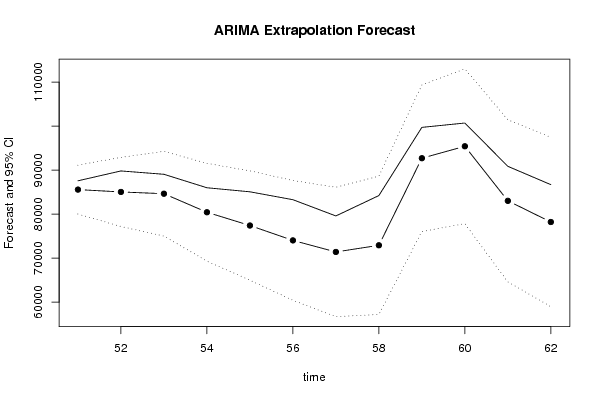
ARIMA Forecast Totaal # niet-werkende werkzoekende vrouwen in het Vlaams ge...

Author*The author of this computation has been verified*
R Software Modulerwasp_arimaforecasting.wasp
Title produced by softwareARIMA Forecasting
Date of computationMon, 15 Dec 2008 11:58:38 -0700
Cite this page as followsStatistical Computations at FreeStatistics.org, Office for Research Development and Education, URL https://freestatistics.org/blog/index.php?v=date/2008/Dec/15/t12293676223lehkp19lhrsu66.htm/, Retrieved Wed, 15 May 2024 07:49:48 +0000
Statistical Computations at FreeStatistics.org, Office for Research Development and Education, URL https://freestatistics.org/blog/index.php?pk=33785, Retrieved Wed, 15 May 2024 07:49:48 +0000
QR Codes:

Original text written by user:Testing/seasonal period: 12 Lambda: 1 d: 1 D: 1 SAR: 2 overige parameters: 0
IsPrivate?No (this computation is public)
User-defined keywordsARIMA Forecast Totaal niet-werkende werkzoekende vrouwen Vlaams gewest
Estimated Impact136
Family? (F = Feedback message, R = changed R code, M = changed R Module, P = changed Parameters, D = changed Data)
-       [ARIMA Forecasting] [ARIMA Forecast To...] [2008-12-15 18:58:38] [f4b2017b314c03698059f43b95818e67] [Current]
Feedback Forum

Post a new message
Dataseries X:
121148
114624
109822
112081
113534
112110
109826
107423
105540
108573
128591
139145
129700
132828
126868
128390
126830
124105
122323
119296
116822
119224
139357
144322
133676
128283
121640
122877
117284
116463
112685
113235
111692
113152
129889
131153
123770
112516
105940
104320
103582
99064
94989
92241
89752
90610
109456
110213
97694
91844
87572
89812
89050
85990
85070
83277
79586
84215
99708
100698
90861
86700


Summary of computational transaction
Raw Inputview raw input (R code)
Raw Outputview raw output of R engine
Computing time1 seconds
R Server'George Udny Yule' @ 72.249.76.132

\begin{tabular}{lllllllll}
\hline
Summary of computational transaction \tabularnewline
Raw Input & view raw input (R code)  \tabularnewline
Raw Output & view raw output of R engine  \tabularnewline
Computing time & 1 seconds \tabularnewline
R Server & 'George Udny Yule' @ 72.249.76.132 \tabularnewline
\hline
\end{tabular}
%Source: https://freestatistics.org/blog/index.php?pk=33785&T=0

[TABLE]
[ROW][C]Summary of computational transaction[/C][/ROW]
[ROW][C]Raw Input[/C][C]view raw input (R code) [/C][/ROW]
[ROW][C]Raw Output[/C][C]view raw output of R engine [/C][/ROW]
[ROW][C]Computing time[/C][C]1 seconds[/C][/ROW]
[ROW][C]R Server[/C][C]'George Udny Yule' @ 72.249.76.132[/C][/ROW]
[/TABLE]
Source: https://freestatistics.org/blog/index.php?pk=33785&T=0

Globally Unique Identifier (entire table): ba.freestatistics.org/blog/index.php?pk=33785&T=0

As an alternative you can also use a QR Code:  

The GUIDs for individual cells are displayed in the table below:

Summary of computational transaction
Raw Inputview raw input (R code)
Raw Outputview raw output of R engine
Computing time1 seconds
R Server'George Udny Yule' @ 72.249.76.132


Univariate ARIMA Extrapolation Forecast
timeY[t]F[t]95% LB95% UBp-value(H0: Y[t] = F[t])P(F[t]>Y[t-1])P(F[t]>Y[t-s])P(F[t]>Y[50])
38112516-------
39105940-------
40104320-------
41103582-------
4299064-------
4394989-------
4492241-------
4589752-------
4690610-------
47109456-------
48110213-------
4997694-------
5091844-------
518757285575.478680019.813291131.1440.24060.013500.0135
528981285038.782777181.885492895.680.11690.263700.0448
538905084640.215675017.520994262.91030.18450.14611e-040.0711
548599080427.03869315.707291538.36870.16320.06415e-040.022
558507077413.744564990.89989836.58990.11350.0880.00280.0114
568327774030.995160422.449787639.54040.09150.05590.00440.0052
577958671405.789856706.880886104.69870.13770.05670.00720.0032
588421572917.73557203.940488631.52960.07940.20280.01370.0091
599970892704.714576037.7184109371.71060.20510.8410.02440.5403
6010069895415.873777847.3172112984.43020.27780.3160.04940.6549
619086183022.108564596.051101448.1660.20220.030.05930.174
628670078212.111558966.722197457.50090.19370.09880.08250.0825

\begin{tabular}{lllllllll}
\hline
Univariate ARIMA Extrapolation Forecast \tabularnewline
time & Y[t] & F[t] & 95% LB & 95% UB & p-value(H0: Y[t] = F[t]) & P(F[t]>Y[t-1]) & P(F[t]>Y[t-s]) & P(F[t]>Y[50]) \tabularnewline
38 & 112516 & - & - & - & - & - & - & - \tabularnewline
39 & 105940 & - & - & - & - & - & - & - \tabularnewline
40 & 104320 & - & - & - & - & - & - & - \tabularnewline
41 & 103582 & - & - & - & - & - & - & - \tabularnewline
42 & 99064 & - & - & - & - & - & - & - \tabularnewline
43 & 94989 & - & - & - & - & - & - & - \tabularnewline
44 & 92241 & - & - & - & - & - & - & - \tabularnewline
45 & 89752 & - & - & - & - & - & - & - \tabularnewline
46 & 90610 & - & - & - & - & - & - & - \tabularnewline
47 & 109456 & - & - & - & - & - & - & - \tabularnewline
48 & 110213 & - & - & - & - & - & - & - \tabularnewline
49 & 97694 & - & - & - & - & - & - & - \tabularnewline
50 & 91844 & - & - & - & - & - & - & - \tabularnewline
51 & 87572 & 85575.4786 & 80019.8132 & 91131.144 & 0.2406 & 0.0135 & 0 & 0.0135 \tabularnewline
52 & 89812 & 85038.7827 & 77181.8854 & 92895.68 & 0.1169 & 0.2637 & 0 & 0.0448 \tabularnewline
53 & 89050 & 84640.2156 & 75017.5209 & 94262.9103 & 0.1845 & 0.1461 & 1e-04 & 0.0711 \tabularnewline
54 & 85990 & 80427.038 & 69315.7072 & 91538.3687 & 0.1632 & 0.0641 & 5e-04 & 0.022 \tabularnewline
55 & 85070 & 77413.7445 & 64990.899 & 89836.5899 & 0.1135 & 0.088 & 0.0028 & 0.0114 \tabularnewline
56 & 83277 & 74030.9951 & 60422.4497 & 87639.5404 & 0.0915 & 0.0559 & 0.0044 & 0.0052 \tabularnewline
57 & 79586 & 71405.7898 & 56706.8808 & 86104.6987 & 0.1377 & 0.0567 & 0.0072 & 0.0032 \tabularnewline
58 & 84215 & 72917.735 & 57203.9404 & 88631.5296 & 0.0794 & 0.2028 & 0.0137 & 0.0091 \tabularnewline
59 & 99708 & 92704.7145 & 76037.7184 & 109371.7106 & 0.2051 & 0.841 & 0.0244 & 0.5403 \tabularnewline
60 & 100698 & 95415.8737 & 77847.3172 & 112984.4302 & 0.2778 & 0.316 & 0.0494 & 0.6549 \tabularnewline
61 & 90861 & 83022.1085 & 64596.051 & 101448.166 & 0.2022 & 0.03 & 0.0593 & 0.174 \tabularnewline
62 & 86700 & 78212.1115 & 58966.7221 & 97457.5009 & 0.1937 & 0.0988 & 0.0825 & 0.0825 \tabularnewline
\hline
\end{tabular}
%Source: https://freestatistics.org/blog/index.php?pk=33785&T=1

[TABLE]
[ROW][C]Univariate ARIMA Extrapolation Forecast[/C][/ROW]
[ROW][C]time[/C][C]Y[t][/C][C]F[t][/C][C]95% LB[/C][C]95% UB[/C][C]p-value(H0: Y[t] = F[t])[/C][C]P(F[t]>Y[t-1])[/C][C]P(F[t]>Y[t-s])[/C][C]P(F[t]>Y[50])[/C][/ROW]
[ROW][C]38[/C][C]112516[/C][C]-[/C][C]-[/C][C]-[/C][C]-[/C][C]-[/C][C]-[/C][C]-[/C][/ROW]
[ROW][C]39[/C][C]105940[/C][C]-[/C][C]-[/C][C]-[/C][C]-[/C][C]-[/C][C]-[/C][C]-[/C][/ROW]
[ROW][C]40[/C][C]104320[/C][C]-[/C][C]-[/C][C]-[/C][C]-[/C][C]-[/C][C]-[/C][C]-[/C][/ROW]
[ROW][C]41[/C][C]103582[/C][C]-[/C][C]-[/C][C]-[/C][C]-[/C][C]-[/C][C]-[/C][C]-[/C][/ROW]
[ROW][C]42[/C][C]99064[/C][C]-[/C][C]-[/C][C]-[/C][C]-[/C][C]-[/C][C]-[/C][C]-[/C][/ROW]
[ROW][C]43[/C][C]94989[/C][C]-[/C][C]-[/C][C]-[/C][C]-[/C][C]-[/C][C]-[/C][C]-[/C][/ROW]
[ROW][C]44[/C][C]92241[/C][C]-[/C][C]-[/C][C]-[/C][C]-[/C][C]-[/C][C]-[/C][C]-[/C][/ROW]
[ROW][C]45[/C][C]89752[/C][C]-[/C][C]-[/C][C]-[/C][C]-[/C][C]-[/C][C]-[/C][C]-[/C][/ROW]
[ROW][C]46[/C][C]90610[/C][C]-[/C][C]-[/C][C]-[/C][C]-[/C][C]-[/C][C]-[/C][C]-[/C][/ROW]
[ROW][C]47[/C][C]109456[/C][C]-[/C][C]-[/C][C]-[/C][C]-[/C][C]-[/C][C]-[/C][C]-[/C][/ROW]
[ROW][C]48[/C][C]110213[/C][C]-[/C][C]-[/C][C]-[/C][C]-[/C][C]-[/C][C]-[/C][C]-[/C][/ROW]
[ROW][C]49[/C][C]97694[/C][C]-[/C][C]-[/C][C]-[/C][C]-[/C][C]-[/C][C]-[/C][C]-[/C][/ROW]
[ROW][C]50[/C][C]91844[/C][C]-[/C][C]-[/C][C]-[/C][C]-[/C][C]-[/C][C]-[/C][C]-[/C][/ROW]
[ROW][C]51[/C][C]87572[/C][C]85575.4786[/C][C]80019.8132[/C][C]91131.144[/C][C]0.2406[/C][C]0.0135[/C][C]0[/C][C]0.0135[/C][/ROW]
[ROW][C]52[/C][C]89812[/C][C]85038.7827[/C][C]77181.8854[/C][C]92895.68[/C][C]0.1169[/C][C]0.2637[/C][C]0[/C][C]0.0448[/C][/ROW]
[ROW][C]53[/C][C]89050[/C][C]84640.2156[/C][C]75017.5209[/C][C]94262.9103[/C][C]0.1845[/C][C]0.1461[/C][C]1e-04[/C][C]0.0711[/C][/ROW]
[ROW][C]54[/C][C]85990[/C][C]80427.038[/C][C]69315.7072[/C][C]91538.3687[/C][C]0.1632[/C][C]0.0641[/C][C]5e-04[/C][C]0.022[/C][/ROW]
[ROW][C]55[/C][C]85070[/C][C]77413.7445[/C][C]64990.899[/C][C]89836.5899[/C][C]0.1135[/C][C]0.088[/C][C]0.0028[/C][C]0.0114[/C][/ROW]
[ROW][C]56[/C][C]83277[/C][C]74030.9951[/C][C]60422.4497[/C][C]87639.5404[/C][C]0.0915[/C][C]0.0559[/C][C]0.0044[/C][C]0.0052[/C][/ROW]
[ROW][C]57[/C][C]79586[/C][C]71405.7898[/C][C]56706.8808[/C][C]86104.6987[/C][C]0.1377[/C][C]0.0567[/C][C]0.0072[/C][C]0.0032[/C][/ROW]
[ROW][C]58[/C][C]84215[/C][C]72917.735[/C][C]57203.9404[/C][C]88631.5296[/C][C]0.0794[/C][C]0.2028[/C][C]0.0137[/C][C]0.0091[/C][/ROW]
[ROW][C]59[/C][C]99708[/C][C]92704.7145[/C][C]76037.7184[/C][C]109371.7106[/C][C]0.2051[/C][C]0.841[/C][C]0.0244[/C][C]0.5403[/C][/ROW]
[ROW][C]60[/C][C]100698[/C][C]95415.8737[/C][C]77847.3172[/C][C]112984.4302[/C][C]0.2778[/C][C]0.316[/C][C]0.0494[/C][C]0.6549[/C][/ROW]
[ROW][C]61[/C][C]90861[/C][C]83022.1085[/C][C]64596.051[/C][C]101448.166[/C][C]0.2022[/C][C]0.03[/C][C]0.0593[/C][C]0.174[/C][/ROW]
[ROW][C]62[/C][C]86700[/C][C]78212.1115[/C][C]58966.7221[/C][C]97457.5009[/C][C]0.1937[/C][C]0.0988[/C][C]0.0825[/C][C]0.0825[/C][/ROW]
[/TABLE]
Source: https://freestatistics.org/blog/index.php?pk=33785&T=1

Globally Unique Identifier (entire table): ba.freestatistics.org/blog/index.php?pk=33785&T=1

As an alternative you can also use a QR Code:  

The GUIDs for individual cells are displayed in the table below:

Univariate ARIMA Extrapolation Forecast
timeY[t]F[t]95% LB95% UBp-value(H0: Y[t] = F[t])P(F[t]>Y[t-1])P(F[t]>Y[t-s])P(F[t]>Y[50])
38112516-------
39105940-------
40104320-------
41103582-------
4299064-------
4394989-------
4492241-------
4589752-------
4690610-------
47109456-------
48110213-------
4997694-------
5091844-------
518757285575.478680019.813291131.1440.24060.013500.0135
528981285038.782777181.885492895.680.11690.263700.0448
538905084640.215675017.520994262.91030.18450.14611e-040.0711
548599080427.03869315.707291538.36870.16320.06415e-040.022
558507077413.744564990.89989836.58990.11350.0880.00280.0114
568327774030.995160422.449787639.54040.09150.05590.00440.0052
577958671405.789856706.880886104.69870.13770.05670.00720.0032
588421572917.73557203.940488631.52960.07940.20280.01370.0091
599970892704.714576037.7184109371.71060.20510.8410.02440.5403
6010069895415.873777847.3172112984.43020.27780.3160.04940.6549
619086183022.108564596.051101448.1660.20220.030.05930.174
628670078212.111558966.722197457.50090.19370.09880.08250.0825


Univariate ARIMA Extrapolation Forecast Performance
time% S.E.PEMAPESq.EMSERMSE
510.03310.02330.00193986097.728332174.8107576.3461
520.04710.05610.004722783603.44661898633.62061377.9091
530.0580.05210.004319446198.57851620516.54821272.9951
540.07050.06920.005830946546.43062578878.86921605.8888
550.08190.09890.008258618249.02484884854.08542210.1706
560.09380.12490.010485488607.42077124050.61842669.0917
570.1050.11460.009566915839.49035576319.95752361.4233
580.10990.15490.0129127628196.870110635683.07253261.2395
590.09170.07550.006349046007.74087167.30832021.6744
600.09390.05540.004627900858.13932325071.51161524.8185
610.11320.09440.007961448219.86545120684.98882262.8931
620.12550.10850.00972044250.95626003687.57972450.2424

\begin{tabular}{lllllllll}
\hline
Univariate ARIMA Extrapolation Forecast Performance \tabularnewline
time & % S.E. & PE & MAPE & Sq.E & MSE & RMSE \tabularnewline
51 & 0.0331 & 0.0233 & 0.0019 & 3986097.728 & 332174.8107 & 576.3461 \tabularnewline
52 & 0.0471 & 0.0561 & 0.0047 & 22783603.4466 & 1898633.6206 & 1377.9091 \tabularnewline
53 & 0.058 & 0.0521 & 0.0043 & 19446198.5785 & 1620516.5482 & 1272.9951 \tabularnewline
54 & 0.0705 & 0.0692 & 0.0058 & 30946546.4306 & 2578878.8692 & 1605.8888 \tabularnewline
55 & 0.0819 & 0.0989 & 0.0082 & 58618249.0248 & 4884854.0854 & 2210.1706 \tabularnewline
56 & 0.0938 & 0.1249 & 0.0104 & 85488607.4207 & 7124050.6184 & 2669.0917 \tabularnewline
57 & 0.105 & 0.1146 & 0.0095 & 66915839.4903 & 5576319.9575 & 2361.4233 \tabularnewline
58 & 0.1099 & 0.1549 & 0.0129 & 127628196.8701 & 10635683.0725 & 3261.2395 \tabularnewline
59 & 0.0917 & 0.0755 & 0.0063 & 49046007.7 & 4087167.3083 & 2021.6744 \tabularnewline
60 & 0.0939 & 0.0554 & 0.0046 & 27900858.1393 & 2325071.5116 & 1524.8185 \tabularnewline
61 & 0.1132 & 0.0944 & 0.0079 & 61448219.8654 & 5120684.9888 & 2262.8931 \tabularnewline
62 & 0.1255 & 0.1085 & 0.009 & 72044250.9562 & 6003687.5797 & 2450.2424 \tabularnewline
\hline
\end{tabular}
%Source: https://freestatistics.org/blog/index.php?pk=33785&T=2

[TABLE]
[ROW][C]Univariate ARIMA Extrapolation Forecast Performance[/C][/ROW]
[ROW][C]time[/C][C]% S.E.[/C][C]PE[/C][C]MAPE[/C][C]Sq.E[/C][C]MSE[/C][C]RMSE[/C][/ROW]
[ROW][C]51[/C][C]0.0331[/C][C]0.0233[/C][C]0.0019[/C][C]3986097.728[/C][C]332174.8107[/C][C]576.3461[/C][/ROW]
[ROW][C]52[/C][C]0.0471[/C][C]0.0561[/C][C]0.0047[/C][C]22783603.4466[/C][C]1898633.6206[/C][C]1377.9091[/C][/ROW]
[ROW][C]53[/C][C]0.058[/C][C]0.0521[/C][C]0.0043[/C][C]19446198.5785[/C][C]1620516.5482[/C][C]1272.9951[/C][/ROW]
[ROW][C]54[/C][C]0.0705[/C][C]0.0692[/C][C]0.0058[/C][C]30946546.4306[/C][C]2578878.8692[/C][C]1605.8888[/C][/ROW]
[ROW][C]55[/C][C]0.0819[/C][C]0.0989[/C][C]0.0082[/C][C]58618249.0248[/C][C]4884854.0854[/C][C]2210.1706[/C][/ROW]
[ROW][C]56[/C][C]0.0938[/C][C]0.1249[/C][C]0.0104[/C][C]85488607.4207[/C][C]7124050.6184[/C][C]2669.0917[/C][/ROW]
[ROW][C]57[/C][C]0.105[/C][C]0.1146[/C][C]0.0095[/C][C]66915839.4903[/C][C]5576319.9575[/C][C]2361.4233[/C][/ROW]
[ROW][C]58[/C][C]0.1099[/C][C]0.1549[/C][C]0.0129[/C][C]127628196.8701[/C][C]10635683.0725[/C][C]3261.2395[/C][/ROW]
[ROW][C]59[/C][C]0.0917[/C][C]0.0755[/C][C]0.0063[/C][C]49046007.7[/C][C]4087167.3083[/C][C]2021.6744[/C][/ROW]
[ROW][C]60[/C][C]0.0939[/C][C]0.0554[/C][C]0.0046[/C][C]27900858.1393[/C][C]2325071.5116[/C][C]1524.8185[/C][/ROW]
[ROW][C]61[/C][C]0.1132[/C][C]0.0944[/C][C]0.0079[/C][C]61448219.8654[/C][C]5120684.9888[/C][C]2262.8931[/C][/ROW]
[ROW][C]62[/C][C]0.1255[/C][C]0.1085[/C][C]0.009[/C][C]72044250.9562[/C][C]6003687.5797[/C][C]2450.2424[/C][/ROW]
[/TABLE]
Source: https://freestatistics.org/blog/index.php?pk=33785&T=2

Globally Unique Identifier (entire table): ba.freestatistics.org/blog/index.php?pk=33785&T=2

As an alternative you can also use a QR Code:  

The GUIDs for individual cells are displayed in the table below:

Univariate ARIMA Extrapolation Forecast Performance
time% S.E.PEMAPESq.EMSERMSE
510.03310.02330.00193986097.728332174.8107576.3461
520.04710.05610.004722783603.44661898633.62061377.9091
530.0580.05210.004319446198.57851620516.54821272.9951
540.07050.06920.005830946546.43062578878.86921605.8888
550.08190.09890.008258618249.02484884854.08542210.1706
560.09380.12490.010485488607.42077124050.61842669.0917
570.1050.11460.009566915839.49035576319.95752361.4233
580.10990.15490.0129127628196.870110635683.07253261.2395
590.09170.07550.006349046007.74087167.30832021.6744
600.09390.05540.004627900858.13932325071.51161524.8185
610.11320.09440.007961448219.86545120684.98882262.8931
620.12550.10850.00972044250.95626003687.57972450.2424


Parameters (Session):
par1 = 12 ; par2 = 1 ; par3 = 1 ; par4 = 1 ; par5 = 12 ; par6 = 0 ; par7 = 0 ; par8 = 2 ; par9 = 0 ; par10 = FALSE ;
Parameters (R input):
par1 = 12 ; par2 = 1 ; par3 = 1 ; par4 = 1 ; par5 = 12 ; par6 = 0 ; par7 = 0 ; par8 = 2 ; par9 = 0 ; par10 = FALSE ;
R code (references can be found in the software module):
par1 <- as.numeric(par1) #cut off periods
par2 <- as.numeric(par2) #lambda
par3 <- as.numeric(par3) #degree of non-seasonal differencing
par4 <- as.numeric(par4) #degree of seasonal differencing
par5 <- as.numeric(par5) #seasonal period
par6 <- as.numeric(par6) #p
par7 <- as.numeric(par7) #q
par8 <- as.numeric(par8) #P
par9 <- as.numeric(par9) #Q
if (par10 == 'TRUE') par10 <- TRUE
if (par10 == 'FALSE') par10 <- FALSE
if (par2 == 0) x <- log(x)
if (par2 != 0) x <- x^par2
lx <- length(x)
first <- lx - 2*par1
nx <- lx - par1
nx1 <- nx + 1
fx <- lx - nx
if (fx < 1) {
fx <- par5
nx1 <- lx + fx - 1
first <- lx - 2*fx
}
first <- 1
if (fx < 3) fx <- round(lx/10,0)
(arima.out <- arima(x[1:nx], order=c(par6,par3,par7), seasonal=list(order=c(par8,par4,par9), period=par5), include.mean=par10, method='ML'))
(forecast <- predict(arima.out,fx))
(lb <- forecast$pred - 1.96 * forecast$se)
(ub <- forecast$pred + 1.96 * forecast$se)
if (par2 == 0) {
x <- exp(x)
forecast$pred <- exp(forecast$pred)
lb <- exp(lb)
ub <- exp(ub)
}
if (par2 != 0) {
x <- x^(1/par2)
forecast$pred <- forecast$pred^(1/par2)
lb <- lb^(1/par2)
ub <- ub^(1/par2)
}
if (par2 < 0) {
olb <- lb
lb <- ub
ub <- olb
}
(actandfor <- c(x[1:nx], forecast$pred))
(perc.se <- (ub-forecast$pred)/1.96/forecast$pred)
bitmap(file='test1.png')
opar <- par(mar=c(4,4,2,2),las=1)
ylim <- c( min(x[first:nx],lb), max(x[first:nx],ub))
plot(x,ylim=ylim,type='n',xlim=c(first,lx))
usr <- par('usr')
rect(usr[1],usr[3],nx+1,usr[4],border=NA,col='lemonchiffon')
rect(nx1,usr[3],usr[2],usr[4],border=NA,col='lavender')
abline(h= (-3:3)*2 , col ='gray', lty =3)
polygon( c(nx1:lx,lx:nx1), c(lb,rev(ub)), col = 'orange', lty=2,border=NA)
lines(nx1:lx, lb , lty=2)
lines(nx1:lx, ub , lty=2)
lines(x, lwd=2)
lines(nx1:lx, forecast$pred , lwd=2 , col ='white')
box()
par(opar)
dev.off()
prob.dec <- array(NA, dim=fx)
prob.sdec <- array(NA, dim=fx)
prob.ldec <- array(NA, dim=fx)
prob.pval <- array(NA, dim=fx)
perf.pe <- array(0, dim=fx)
perf.mape <- array(0, dim=fx)
perf.se <- array(0, dim=fx)
perf.mse <- array(0, dim=fx)
perf.rmse <- array(0, dim=fx)
for (i in 1:fx) {
locSD <- (ub[i] - forecast$pred[i]) / 1.96
perf.pe[i] = (x[nx+i] - forecast$pred[i]) / forecast$pred[i]
perf.mape[i] = perf.mape[i] + abs(perf.pe[i])
perf.se[i] = (x[nx+i] - forecast$pred[i])^2
perf.mse[i] = perf.mse[i] + perf.se[i]
prob.dec[i] = pnorm((x[nx+i-1] - forecast$pred[i]) / locSD)
prob.sdec[i] = pnorm((x[nx+i-par5] - forecast$pred[i]) / locSD)
prob.ldec[i] = pnorm((x[nx] - forecast$pred[i]) / locSD)
prob.pval[i] = pnorm(abs(x[nx+i] - forecast$pred[i]) / locSD)
}
perf.mape = perf.mape / fx
perf.mse = perf.mse / fx
perf.rmse = sqrt(perf.mse)
bitmap(file='test2.png')
plot(forecast$pred, pch=19, type='b',main='ARIMA Extrapolation Forecast', ylab='Forecast and 95% CI', xlab='time',ylim=c(min(lb),max(ub)))
dum <- forecast$pred
dum[1:12] <- x[(nx+1):lx]
lines(dum, lty=1)
lines(ub,lty=3)
lines(lb,lty=3)
dev.off()
load(file='createtable')
a<-table.start()
a<-table.row.start(a)
a<-table.element(a,'Univariate ARIMA Extrapolation Forecast',9,TRUE)
a<-table.row.end(a)
a<-table.row.start(a)
a<-table.element(a,'time',1,header=TRUE)
a<-table.element(a,'Y[t]',1,header=TRUE)
a<-table.element(a,'F[t]',1,header=TRUE)
a<-table.element(a,'95% LB',1,header=TRUE)
a<-table.element(a,'95% UB',1,header=TRUE)
a<-table.element(a,'p-value
(H0: Y[t] = F[t])',1,header=TRUE)
a<-table.element(a,'P(F[t]>Y[t-1])',1,header=TRUE)
a<-table.element(a,'P(F[t]>Y[t-s])',1,header=TRUE)
mylab <- paste('P(F[t]>Y[',nx,sep='')
mylab <- paste(mylab,'])',sep='')
a<-table.element(a,mylab,1,header=TRUE)
a<-table.row.end(a)
for (i in (nx-par5):nx) {
a<-table.row.start(a)
a<-table.element(a,i,header=TRUE)
a<-table.element(a,x[i])
a<-table.element(a,'-')
a<-table.row.end(a)
}
for (i in 1:fx) {
a<-table.row.start(a)
a<-table.element(a,nx+i,header=TRUE)
a<-table.element(a,round(x[nx+i],4))
a<-table.element(a,round(forecast$pred[i],4))
a<-table.element(a,round(lb[i],4))
a<-table.element(a,round(ub[i],4))
a<-table.element(a,round((1-prob.pval[i]),4))
a<-table.element(a,round((1-prob.dec[i]),4))
a<-table.element(a,round((1-prob.sdec[i]),4))
a<-table.element(a,round((1-prob.ldec[i]),4))
a<-table.row.end(a)
}
a<-table.end(a)
table.save(a,file='mytable.tab')
a<-table.start()
a<-table.row.start(a)
a<-table.element(a,'Univariate ARIMA Extrapolation Forecast Performance',7,TRUE)
a<-table.row.end(a)
a<-table.row.start(a)
a<-table.element(a,'time',1,header=TRUE)
a<-table.element(a,'% S.E.',1,header=TRUE)
a<-table.element(a,'PE',1,header=TRUE)
a<-table.element(a,'MAPE',1,header=TRUE)
a<-table.element(a,'Sq.E',1,header=TRUE)
a<-table.element(a,'MSE',1,header=TRUE)
a<-table.element(a,'RMSE',1,header=TRUE)
a<-table.row.end(a)
for (i in 1:fx) {
a<-table.row.start(a)
a<-table.element(a,nx+i,header=TRUE)
a<-table.element(a,round(perc.se[i],4))
a<-table.element(a,round(perf.pe[i],4))
a<-table.element(a,round(perf.mape[i],4))
a<-table.element(a,round(perf.se[i],4))
a<-table.element(a,round(perf.mse[i],4))
a<-table.element(a,round(perf.rmse[i],4))
a<-table.row.end(a)
}
a<-table.end(a)
table.save(a,file='mytable1.tab')