Free Statistics

of Irreproducible Research!

Author's title

(Partial) Autocorrelation Function Totaal # niet-werkende werkzoekende vrou...

Author*The author of this computation has been verified*
R Software Modulerwasp_autocorrelation.wasp
Title produced by software(Partial) Autocorrelation Function
Date of computationMon, 15 Dec 2008 11:35:31 -0700
Cite this page as followsStatistical Computations at FreeStatistics.org, Office for Research Development and Education, URL https://freestatistics.org/blog/index.php?v=date/2008/Dec/15/t1229366237lo1iw4f1f4m3inw.htm/, Retrieved Wed, 15 May 2024 23:22:19 +0000
Statistical Computations at FreeStatistics.org, Office for Research Development and Education, URL https://freestatistics.org/blog/index.php?pk=33777, Retrieved Wed, 15 May 2024 23:22:19 +0000
QR Codes:

Original text written by user:Lags: 60 Lambda: 1 d: 1 D:1 Seasonality: 12
IsPrivate?No (this computation is public)
User-defined keywords(Partial) Autocorrelation Function Totaal niet-werkende werkzoekende vrouwen Vlaams gewest
Estimated Impact194
Family? (F = Feedback message, R = changed R code, M = changed R Module, P = changed Parameters, D = changed Data)
-       [(Partial) Autocorrelation Function] [(Partial) Autocor...] [2008-12-15 18:35:31] [f4b2017b314c03698059f43b95818e67] [Current]
Feedback Forum

Post a new message
Dataseries X:
121148
114624
109822
112081
113534
112110
109826
107423
105540
108573
128591
139145
129700
132828
126868
128390
126830
124105
122323
119296
116822
119224
139357
144322
133676
128283
121640
122877
117284
116463
112685
113235
111692
113152
129889
131153
123770
112516
105940
104320
103582
99064
94989
92241
89752
90610
109456
110213
97694
91844
87572
89812
89050
85990
85070
83277
79586
84215
99708
100698
90861
86700


Summary of computational transaction
Raw Inputview raw input (R code)
Raw Outputview raw output of R engine
Computing time1 seconds
R Server'George Udny Yule' @ 72.249.76.132

\begin{tabular}{lllllllll}
\hline
Summary of computational transaction \tabularnewline
Raw Input & view raw input (R code)  \tabularnewline
Raw Output & view raw output of R engine  \tabularnewline
Computing time & 1 seconds \tabularnewline
R Server & 'George Udny Yule' @ 72.249.76.132 \tabularnewline
\hline
\end{tabular}
%Source: https://freestatistics.org/blog/index.php?pk=33777&T=0

[TABLE]
[ROW][C]Summary of computational transaction[/C][/ROW]
[ROW][C]Raw Input[/C][C]view raw input (R code) [/C][/ROW]
[ROW][C]Raw Output[/C][C]view raw output of R engine [/C][/ROW]
[ROW][C]Computing time[/C][C]1 seconds[/C][/ROW]
[ROW][C]R Server[/C][C]'George Udny Yule' @ 72.249.76.132[/C][/ROW]
[/TABLE]
Source: https://freestatistics.org/blog/index.php?pk=33777&T=0

Globally Unique Identifier (entire table): ba.freestatistics.org/blog/index.php?pk=33777&T=0

As an alternative you can also use a QR Code:  

The GUIDs for individual cells are displayed in the table below:

Summary of computational transaction
Raw Inputview raw input (R code)
Raw Outputview raw output of R engine
Computing time1 seconds
R Server'George Udny Yule' @ 72.249.76.132


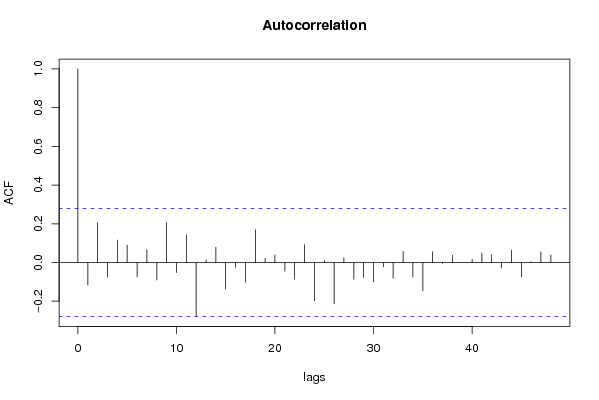
Autocorrelation Function
Time lag kACF(k)T-STATP-value
1-0.116475-0.81530.209415
20.2050671.43550.078753
3-0.075308-0.52720.300232
40.1155840.80910.211188
50.0895240.62670.266894
6-0.074653-0.52260.301814
70.065770.46040.323636
8-0.091043-0.63730.263448
90.2069461.44860.076906
10-0.052471-0.36730.35749
110.1432071.00240.160526
12-0.278246-1.94770.028595
130.0138540.0970.461569
140.0785080.54960.292561
15-0.136949-0.95860.171222
16-0.025349-0.17740.429947
17-0.10222-0.71550.238835
180.1695761.1870.120469
190.0214890.15040.440525
200.0384330.2690.394517
21-0.045093-0.31560.376804
22-0.085736-0.60010.275586
230.0921040.64470.261054
24-0.197245-1.38070.086816
250.0095380.06680.473519
26-0.213846-1.49690.070414
270.0248880.17420.431206
28-0.086958-0.60870.272766
29-0.077218-0.54050.295643
30-0.099812-0.69870.244027
31-0.022158-0.15510.438687
32-0.081299-0.56910.285947
330.0567940.39760.346341
34-0.0756-0.52920.299528
35-0.145506-1.01850.156711
360.0554260.3880.349855
37-0.005114-0.03580.485794
380.0371950.26040.397838
390.0015970.01120.495563
400.0155440.10880.456899
410.0479880.33590.369183
420.0409720.28680.387735
43-0.028067-0.19650.422529
440.0644020.45080.327057
45-0.074527-0.52170.30212
460.0031380.0220.491282
470.0547090.3830.351701
480.0386370.27050.393972
49NANANA
50NANANA
51NANANA
52NANANA
53NANANA
54NANANA
55NANANA
56NANANA
57NANANA
58NANANA
59NANANA
60NANANA

\begin{tabular}{lllllllll}
\hline
Autocorrelation Function \tabularnewline
Time lag k & ACF(k) & T-STAT & P-value \tabularnewline
1 & -0.116475 & -0.8153 & 0.209415 \tabularnewline
2 & 0.205067 & 1.4355 & 0.078753 \tabularnewline
3 & -0.075308 & -0.5272 & 0.300232 \tabularnewline
4 & 0.115584 & 0.8091 & 0.211188 \tabularnewline
5 & 0.089524 & 0.6267 & 0.266894 \tabularnewline
6 & -0.074653 & -0.5226 & 0.301814 \tabularnewline
7 & 0.06577 & 0.4604 & 0.323636 \tabularnewline
8 & -0.091043 & -0.6373 & 0.263448 \tabularnewline
9 & 0.206946 & 1.4486 & 0.076906 \tabularnewline
10 & -0.052471 & -0.3673 & 0.35749 \tabularnewline
11 & 0.143207 & 1.0024 & 0.160526 \tabularnewline
12 & -0.278246 & -1.9477 & 0.028595 \tabularnewline
13 & 0.013854 & 0.097 & 0.461569 \tabularnewline
14 & 0.078508 & 0.5496 & 0.292561 \tabularnewline
15 & -0.136949 & -0.9586 & 0.171222 \tabularnewline
16 & -0.025349 & -0.1774 & 0.429947 \tabularnewline
17 & -0.10222 & -0.7155 & 0.238835 \tabularnewline
18 & 0.169576 & 1.187 & 0.120469 \tabularnewline
19 & 0.021489 & 0.1504 & 0.440525 \tabularnewline
20 & 0.038433 & 0.269 & 0.394517 \tabularnewline
21 & -0.045093 & -0.3156 & 0.376804 \tabularnewline
22 & -0.085736 & -0.6001 & 0.275586 \tabularnewline
23 & 0.092104 & 0.6447 & 0.261054 \tabularnewline
24 & -0.197245 & -1.3807 & 0.086816 \tabularnewline
25 & 0.009538 & 0.0668 & 0.473519 \tabularnewline
26 & -0.213846 & -1.4969 & 0.070414 \tabularnewline
27 & 0.024888 & 0.1742 & 0.431206 \tabularnewline
28 & -0.086958 & -0.6087 & 0.272766 \tabularnewline
29 & -0.077218 & -0.5405 & 0.295643 \tabularnewline
30 & -0.099812 & -0.6987 & 0.244027 \tabularnewline
31 & -0.022158 & -0.1551 & 0.438687 \tabularnewline
32 & -0.081299 & -0.5691 & 0.285947 \tabularnewline
33 & 0.056794 & 0.3976 & 0.346341 \tabularnewline
34 & -0.0756 & -0.5292 & 0.299528 \tabularnewline
35 & -0.145506 & -1.0185 & 0.156711 \tabularnewline
36 & 0.055426 & 0.388 & 0.349855 \tabularnewline
37 & -0.005114 & -0.0358 & 0.485794 \tabularnewline
38 & 0.037195 & 0.2604 & 0.397838 \tabularnewline
39 & 0.001597 & 0.0112 & 0.495563 \tabularnewline
40 & 0.015544 & 0.1088 & 0.456899 \tabularnewline
41 & 0.047988 & 0.3359 & 0.369183 \tabularnewline
42 & 0.040972 & 0.2868 & 0.387735 \tabularnewline
43 & -0.028067 & -0.1965 & 0.422529 \tabularnewline
44 & 0.064402 & 0.4508 & 0.327057 \tabularnewline
45 & -0.074527 & -0.5217 & 0.30212 \tabularnewline
46 & 0.003138 & 0.022 & 0.491282 \tabularnewline
47 & 0.054709 & 0.383 & 0.351701 \tabularnewline
48 & 0.038637 & 0.2705 & 0.393972 \tabularnewline
49 & NA & NA & NA \tabularnewline
50 & NA & NA & NA \tabularnewline
51 & NA & NA & NA \tabularnewline
52 & NA & NA & NA \tabularnewline
53 & NA & NA & NA \tabularnewline
54 & NA & NA & NA \tabularnewline
55 & NA & NA & NA \tabularnewline
56 & NA & NA & NA \tabularnewline
57 & NA & NA & NA \tabularnewline
58 & NA & NA & NA \tabularnewline
59 & NA & NA & NA \tabularnewline
60 & NA & NA & NA \tabularnewline
\hline
\end{tabular}
%Source: https://freestatistics.org/blog/index.php?pk=33777&T=1

[TABLE]
[ROW][C]Autocorrelation Function[/C][/ROW]
[ROW][C]Time lag k[/C][C]ACF(k)[/C][C]T-STAT[/C][C]P-value[/C][/ROW]
[ROW][C]1[/C][C]-0.116475[/C][C]-0.8153[/C][C]0.209415[/C][/ROW]
[ROW][C]2[/C][C]0.205067[/C][C]1.4355[/C][C]0.078753[/C][/ROW]
[ROW][C]3[/C][C]-0.075308[/C][C]-0.5272[/C][C]0.300232[/C][/ROW]
[ROW][C]4[/C][C]0.115584[/C][C]0.8091[/C][C]0.211188[/C][/ROW]
[ROW][C]5[/C][C]0.089524[/C][C]0.6267[/C][C]0.266894[/C][/ROW]
[ROW][C]6[/C][C]-0.074653[/C][C]-0.5226[/C][C]0.301814[/C][/ROW]
[ROW][C]7[/C][C]0.06577[/C][C]0.4604[/C][C]0.323636[/C][/ROW]
[ROW][C]8[/C][C]-0.091043[/C][C]-0.6373[/C][C]0.263448[/C][/ROW]
[ROW][C]9[/C][C]0.206946[/C][C]1.4486[/C][C]0.076906[/C][/ROW]
[ROW][C]10[/C][C]-0.052471[/C][C]-0.3673[/C][C]0.35749[/C][/ROW]
[ROW][C]11[/C][C]0.143207[/C][C]1.0024[/C][C]0.160526[/C][/ROW]
[ROW][C]12[/C][C]-0.278246[/C][C]-1.9477[/C][C]0.028595[/C][/ROW]
[ROW][C]13[/C][C]0.013854[/C][C]0.097[/C][C]0.461569[/C][/ROW]
[ROW][C]14[/C][C]0.078508[/C][C]0.5496[/C][C]0.292561[/C][/ROW]
[ROW][C]15[/C][C]-0.136949[/C][C]-0.9586[/C][C]0.171222[/C][/ROW]
[ROW][C]16[/C][C]-0.025349[/C][C]-0.1774[/C][C]0.429947[/C][/ROW]
[ROW][C]17[/C][C]-0.10222[/C][C]-0.7155[/C][C]0.238835[/C][/ROW]
[ROW][C]18[/C][C]0.169576[/C][C]1.187[/C][C]0.120469[/C][/ROW]
[ROW][C]19[/C][C]0.021489[/C][C]0.1504[/C][C]0.440525[/C][/ROW]
[ROW][C]20[/C][C]0.038433[/C][C]0.269[/C][C]0.394517[/C][/ROW]
[ROW][C]21[/C][C]-0.045093[/C][C]-0.3156[/C][C]0.376804[/C][/ROW]
[ROW][C]22[/C][C]-0.085736[/C][C]-0.6001[/C][C]0.275586[/C][/ROW]
[ROW][C]23[/C][C]0.092104[/C][C]0.6447[/C][C]0.261054[/C][/ROW]
[ROW][C]24[/C][C]-0.197245[/C][C]-1.3807[/C][C]0.086816[/C][/ROW]
[ROW][C]25[/C][C]0.009538[/C][C]0.0668[/C][C]0.473519[/C][/ROW]
[ROW][C]26[/C][C]-0.213846[/C][C]-1.4969[/C][C]0.070414[/C][/ROW]
[ROW][C]27[/C][C]0.024888[/C][C]0.1742[/C][C]0.431206[/C][/ROW]
[ROW][C]28[/C][C]-0.086958[/C][C]-0.6087[/C][C]0.272766[/C][/ROW]
[ROW][C]29[/C][C]-0.077218[/C][C]-0.5405[/C][C]0.295643[/C][/ROW]
[ROW][C]30[/C][C]-0.099812[/C][C]-0.6987[/C][C]0.244027[/C][/ROW]
[ROW][C]31[/C][C]-0.022158[/C][C]-0.1551[/C][C]0.438687[/C][/ROW]
[ROW][C]32[/C][C]-0.081299[/C][C]-0.5691[/C][C]0.285947[/C][/ROW]
[ROW][C]33[/C][C]0.056794[/C][C]0.3976[/C][C]0.346341[/C][/ROW]
[ROW][C]34[/C][C]-0.0756[/C][C]-0.5292[/C][C]0.299528[/C][/ROW]
[ROW][C]35[/C][C]-0.145506[/C][C]-1.0185[/C][C]0.156711[/C][/ROW]
[ROW][C]36[/C][C]0.055426[/C][C]0.388[/C][C]0.349855[/C][/ROW]
[ROW][C]37[/C][C]-0.005114[/C][C]-0.0358[/C][C]0.485794[/C][/ROW]
[ROW][C]38[/C][C]0.037195[/C][C]0.2604[/C][C]0.397838[/C][/ROW]
[ROW][C]39[/C][C]0.001597[/C][C]0.0112[/C][C]0.495563[/C][/ROW]
[ROW][C]40[/C][C]0.015544[/C][C]0.1088[/C][C]0.456899[/C][/ROW]
[ROW][C]41[/C][C]0.047988[/C][C]0.3359[/C][C]0.369183[/C][/ROW]
[ROW][C]42[/C][C]0.040972[/C][C]0.2868[/C][C]0.387735[/C][/ROW]
[ROW][C]43[/C][C]-0.028067[/C][C]-0.1965[/C][C]0.422529[/C][/ROW]
[ROW][C]44[/C][C]0.064402[/C][C]0.4508[/C][C]0.327057[/C][/ROW]
[ROW][C]45[/C][C]-0.074527[/C][C]-0.5217[/C][C]0.30212[/C][/ROW]
[ROW][C]46[/C][C]0.003138[/C][C]0.022[/C][C]0.491282[/C][/ROW]
[ROW][C]47[/C][C]0.054709[/C][C]0.383[/C][C]0.351701[/C][/ROW]
[ROW][C]48[/C][C]0.038637[/C][C]0.2705[/C][C]0.393972[/C][/ROW]
[ROW][C]49[/C][C]NA[/C][C]NA[/C][C]NA[/C][/ROW]
[ROW][C]50[/C][C]NA[/C][C]NA[/C][C]NA[/C][/ROW]
[ROW][C]51[/C][C]NA[/C][C]NA[/C][C]NA[/C][/ROW]
[ROW][C]52[/C][C]NA[/C][C]NA[/C][C]NA[/C][/ROW]
[ROW][C]53[/C][C]NA[/C][C]NA[/C][C]NA[/C][/ROW]
[ROW][C]54[/C][C]NA[/C][C]NA[/C][C]NA[/C][/ROW]
[ROW][C]55[/C][C]NA[/C][C]NA[/C][C]NA[/C][/ROW]
[ROW][C]56[/C][C]NA[/C][C]NA[/C][C]NA[/C][/ROW]
[ROW][C]57[/C][C]NA[/C][C]NA[/C][C]NA[/C][/ROW]
[ROW][C]58[/C][C]NA[/C][C]NA[/C][C]NA[/C][/ROW]
[ROW][C]59[/C][C]NA[/C][C]NA[/C][C]NA[/C][/ROW]
[ROW][C]60[/C][C]NA[/C][C]NA[/C][C]NA[/C][/ROW]
[/TABLE]
Source: https://freestatistics.org/blog/index.php?pk=33777&T=1

Globally Unique Identifier (entire table): ba.freestatistics.org/blog/index.php?pk=33777&T=1

As an alternative you can also use a QR Code:  

The GUIDs for individual cells are displayed in the table below:

Autocorrelation Function
Time lag kACF(k)T-STATP-value
1-0.116475-0.81530.209415
20.2050671.43550.078753
3-0.075308-0.52720.300232
40.1155840.80910.211188
50.0895240.62670.266894
6-0.074653-0.52260.301814
70.065770.46040.323636
8-0.091043-0.63730.263448
90.2069461.44860.076906
10-0.052471-0.36730.35749
110.1432071.00240.160526
12-0.278246-1.94770.028595
130.0138540.0970.461569
140.0785080.54960.292561
15-0.136949-0.95860.171222
16-0.025349-0.17740.429947
17-0.10222-0.71550.238835
180.1695761.1870.120469
190.0214890.15040.440525
200.0384330.2690.394517
21-0.045093-0.31560.376804
22-0.085736-0.60010.275586
230.0921040.64470.261054
24-0.197245-1.38070.086816
250.0095380.06680.473519
26-0.213846-1.49690.070414
270.0248880.17420.431206
28-0.086958-0.60870.272766
29-0.077218-0.54050.295643
30-0.099812-0.69870.244027
31-0.022158-0.15510.438687
32-0.081299-0.56910.285947
330.0567940.39760.346341
34-0.0756-0.52920.299528
35-0.145506-1.01850.156711
360.0554260.3880.349855
37-0.005114-0.03580.485794
380.0371950.26040.397838
390.0015970.01120.495563
400.0155440.10880.456899
410.0479880.33590.369183
420.0409720.28680.387735
43-0.028067-0.19650.422529
440.0644020.45080.327057
45-0.074527-0.52170.30212
460.0031380.0220.491282
470.0547090.3830.351701
480.0386370.27050.393972
49NANANA
50NANANA
51NANANA
52NANANA
53NANANA
54NANANA
55NANANA
56NANANA
57NANANA
58NANANA
59NANANA
60NANANA


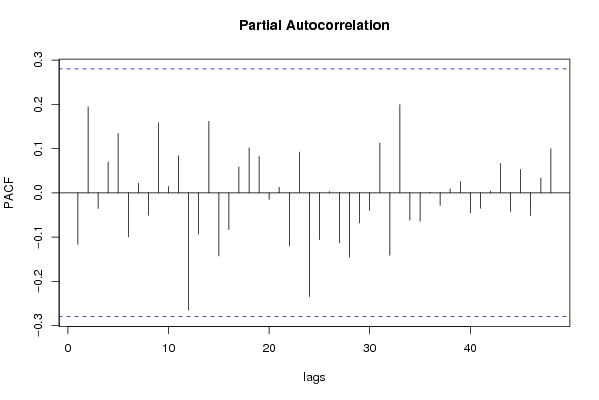
Partial Autocorrelation Function
Time lag kPACF(k)T-STATP-value
1-0.116475-0.81530.209415
20.1941351.35890.090194
3-0.035236-0.24670.403104
40.0693970.48580.314644
50.1343320.94030.175833
6-0.099446-0.69610.24482
70.0215380.15080.44039
8-0.050649-0.35450.362227
90.1582281.10760.136721
100.0144640.10120.459884
110.0838010.58660.28008
12-0.265151-1.85610.034732
13-0.093627-0.65540.257642
140.1615211.13060.131853
15-0.142789-0.99950.161226
16-0.083154-0.58210.28159
170.058530.40970.341902
180.1016080.71130.240148
190.0819830.57390.284336
20-0.014974-0.10480.458473
210.0124770.08730.465379
22-0.119712-0.8380.203053
230.0921950.64540.260851
24-0.234705-1.64290.0534
25-0.105667-0.73970.231514
260.002920.02040.491888
27-0.113037-0.79130.216303
28-0.145701-1.01990.15639
29-0.068085-0.47660.317884
30-0.04-0.280.390327
310.1124630.78720.217466
32-0.141417-0.98990.163538
330.199311.39520.084629
34-0.061559-0.43090.334212
35-0.064217-0.44950.32752
360.0014260.010.496039
37-0.028642-0.20050.420962
380.0091390.0640.474627
390.0257150.180.428945
40-0.045473-0.31830.375802
41-0.034844-0.24390.404159
420.0040780.02850.48867
430.0664640.46520.321908
44-0.042519-0.29760.383622
450.0525780.3680.357213
46-0.051372-0.35960.360344
470.0334570.23420.407902
480.0996930.69790.244284
49NANANA
50NANANA
51NANANA
52NANANA
53NANANA
54NANANA
55NANANA
56NANANA
57NANANA
58NANANA
59NANANA
60NANANA

\begin{tabular}{lllllllll}
\hline
Partial Autocorrelation Function \tabularnewline
Time lag k & PACF(k) & T-STAT & P-value \tabularnewline
1 & -0.116475 & -0.8153 & 0.209415 \tabularnewline
2 & 0.194135 & 1.3589 & 0.090194 \tabularnewline
3 & -0.035236 & -0.2467 & 0.403104 \tabularnewline
4 & 0.069397 & 0.4858 & 0.314644 \tabularnewline
5 & 0.134332 & 0.9403 & 0.175833 \tabularnewline
6 & -0.099446 & -0.6961 & 0.24482 \tabularnewline
7 & 0.021538 & 0.1508 & 0.44039 \tabularnewline
8 & -0.050649 & -0.3545 & 0.362227 \tabularnewline
9 & 0.158228 & 1.1076 & 0.136721 \tabularnewline
10 & 0.014464 & 0.1012 & 0.459884 \tabularnewline
11 & 0.083801 & 0.5866 & 0.28008 \tabularnewline
12 & -0.265151 & -1.8561 & 0.034732 \tabularnewline
13 & -0.093627 & -0.6554 & 0.257642 \tabularnewline
14 & 0.161521 & 1.1306 & 0.131853 \tabularnewline
15 & -0.142789 & -0.9995 & 0.161226 \tabularnewline
16 & -0.083154 & -0.5821 & 0.28159 \tabularnewline
17 & 0.05853 & 0.4097 & 0.341902 \tabularnewline
18 & 0.101608 & 0.7113 & 0.240148 \tabularnewline
19 & 0.081983 & 0.5739 & 0.284336 \tabularnewline
20 & -0.014974 & -0.1048 & 0.458473 \tabularnewline
21 & 0.012477 & 0.0873 & 0.465379 \tabularnewline
22 & -0.119712 & -0.838 & 0.203053 \tabularnewline
23 & 0.092195 & 0.6454 & 0.260851 \tabularnewline
24 & -0.234705 & -1.6429 & 0.0534 \tabularnewline
25 & -0.105667 & -0.7397 & 0.231514 \tabularnewline
26 & 0.00292 & 0.0204 & 0.491888 \tabularnewline
27 & -0.113037 & -0.7913 & 0.216303 \tabularnewline
28 & -0.145701 & -1.0199 & 0.15639 \tabularnewline
29 & -0.068085 & -0.4766 & 0.317884 \tabularnewline
30 & -0.04 & -0.28 & 0.390327 \tabularnewline
31 & 0.112463 & 0.7872 & 0.217466 \tabularnewline
32 & -0.141417 & -0.9899 & 0.163538 \tabularnewline
33 & 0.19931 & 1.3952 & 0.084629 \tabularnewline
34 & -0.061559 & -0.4309 & 0.334212 \tabularnewline
35 & -0.064217 & -0.4495 & 0.32752 \tabularnewline
36 & 0.001426 & 0.01 & 0.496039 \tabularnewline
37 & -0.028642 & -0.2005 & 0.420962 \tabularnewline
38 & 0.009139 & 0.064 & 0.474627 \tabularnewline
39 & 0.025715 & 0.18 & 0.428945 \tabularnewline
40 & -0.045473 & -0.3183 & 0.375802 \tabularnewline
41 & -0.034844 & -0.2439 & 0.404159 \tabularnewline
42 & 0.004078 & 0.0285 & 0.48867 \tabularnewline
43 & 0.066464 & 0.4652 & 0.321908 \tabularnewline
44 & -0.042519 & -0.2976 & 0.383622 \tabularnewline
45 & 0.052578 & 0.368 & 0.357213 \tabularnewline
46 & -0.051372 & -0.3596 & 0.360344 \tabularnewline
47 & 0.033457 & 0.2342 & 0.407902 \tabularnewline
48 & 0.099693 & 0.6979 & 0.244284 \tabularnewline
49 & NA & NA & NA \tabularnewline
50 & NA & NA & NA \tabularnewline
51 & NA & NA & NA \tabularnewline
52 & NA & NA & NA \tabularnewline
53 & NA & NA & NA \tabularnewline
54 & NA & NA & NA \tabularnewline
55 & NA & NA & NA \tabularnewline
56 & NA & NA & NA \tabularnewline
57 & NA & NA & NA \tabularnewline
58 & NA & NA & NA \tabularnewline
59 & NA & NA & NA \tabularnewline
60 & NA & NA & NA \tabularnewline
\hline
\end{tabular}
%Source: https://freestatistics.org/blog/index.php?pk=33777&T=2

[TABLE]
[ROW][C]Partial Autocorrelation Function[/C][/ROW]
[ROW][C]Time lag k[/C][C]PACF(k)[/C][C]T-STAT[/C][C]P-value[/C][/ROW]
[ROW][C]1[/C][C]-0.116475[/C][C]-0.8153[/C][C]0.209415[/C][/ROW]
[ROW][C]2[/C][C]0.194135[/C][C]1.3589[/C][C]0.090194[/C][/ROW]
[ROW][C]3[/C][C]-0.035236[/C][C]-0.2467[/C][C]0.403104[/C][/ROW]
[ROW][C]4[/C][C]0.069397[/C][C]0.4858[/C][C]0.314644[/C][/ROW]
[ROW][C]5[/C][C]0.134332[/C][C]0.9403[/C][C]0.175833[/C][/ROW]
[ROW][C]6[/C][C]-0.099446[/C][C]-0.6961[/C][C]0.24482[/C][/ROW]
[ROW][C]7[/C][C]0.021538[/C][C]0.1508[/C][C]0.44039[/C][/ROW]
[ROW][C]8[/C][C]-0.050649[/C][C]-0.3545[/C][C]0.362227[/C][/ROW]
[ROW][C]9[/C][C]0.158228[/C][C]1.1076[/C][C]0.136721[/C][/ROW]
[ROW][C]10[/C][C]0.014464[/C][C]0.1012[/C][C]0.459884[/C][/ROW]
[ROW][C]11[/C][C]0.083801[/C][C]0.5866[/C][C]0.28008[/C][/ROW]
[ROW][C]12[/C][C]-0.265151[/C][C]-1.8561[/C][C]0.034732[/C][/ROW]
[ROW][C]13[/C][C]-0.093627[/C][C]-0.6554[/C][C]0.257642[/C][/ROW]
[ROW][C]14[/C][C]0.161521[/C][C]1.1306[/C][C]0.131853[/C][/ROW]
[ROW][C]15[/C][C]-0.142789[/C][C]-0.9995[/C][C]0.161226[/C][/ROW]
[ROW][C]16[/C][C]-0.083154[/C][C]-0.5821[/C][C]0.28159[/C][/ROW]
[ROW][C]17[/C][C]0.05853[/C][C]0.4097[/C][C]0.341902[/C][/ROW]
[ROW][C]18[/C][C]0.101608[/C][C]0.7113[/C][C]0.240148[/C][/ROW]
[ROW][C]19[/C][C]0.081983[/C][C]0.5739[/C][C]0.284336[/C][/ROW]
[ROW][C]20[/C][C]-0.014974[/C][C]-0.1048[/C][C]0.458473[/C][/ROW]
[ROW][C]21[/C][C]0.012477[/C][C]0.0873[/C][C]0.465379[/C][/ROW]
[ROW][C]22[/C][C]-0.119712[/C][C]-0.838[/C][C]0.203053[/C][/ROW]
[ROW][C]23[/C][C]0.092195[/C][C]0.6454[/C][C]0.260851[/C][/ROW]
[ROW][C]24[/C][C]-0.234705[/C][C]-1.6429[/C][C]0.0534[/C][/ROW]
[ROW][C]25[/C][C]-0.105667[/C][C]-0.7397[/C][C]0.231514[/C][/ROW]
[ROW][C]26[/C][C]0.00292[/C][C]0.0204[/C][C]0.491888[/C][/ROW]
[ROW][C]27[/C][C]-0.113037[/C][C]-0.7913[/C][C]0.216303[/C][/ROW]
[ROW][C]28[/C][C]-0.145701[/C][C]-1.0199[/C][C]0.15639[/C][/ROW]
[ROW][C]29[/C][C]-0.068085[/C][C]-0.4766[/C][C]0.317884[/C][/ROW]
[ROW][C]30[/C][C]-0.04[/C][C]-0.28[/C][C]0.390327[/C][/ROW]
[ROW][C]31[/C][C]0.112463[/C][C]0.7872[/C][C]0.217466[/C][/ROW]
[ROW][C]32[/C][C]-0.141417[/C][C]-0.9899[/C][C]0.163538[/C][/ROW]
[ROW][C]33[/C][C]0.19931[/C][C]1.3952[/C][C]0.084629[/C][/ROW]
[ROW][C]34[/C][C]-0.061559[/C][C]-0.4309[/C][C]0.334212[/C][/ROW]
[ROW][C]35[/C][C]-0.064217[/C][C]-0.4495[/C][C]0.32752[/C][/ROW]
[ROW][C]36[/C][C]0.001426[/C][C]0.01[/C][C]0.496039[/C][/ROW]
[ROW][C]37[/C][C]-0.028642[/C][C]-0.2005[/C][C]0.420962[/C][/ROW]
[ROW][C]38[/C][C]0.009139[/C][C]0.064[/C][C]0.474627[/C][/ROW]
[ROW][C]39[/C][C]0.025715[/C][C]0.18[/C][C]0.428945[/C][/ROW]
[ROW][C]40[/C][C]-0.045473[/C][C]-0.3183[/C][C]0.375802[/C][/ROW]
[ROW][C]41[/C][C]-0.034844[/C][C]-0.2439[/C][C]0.404159[/C][/ROW]
[ROW][C]42[/C][C]0.004078[/C][C]0.0285[/C][C]0.48867[/C][/ROW]
[ROW][C]43[/C][C]0.066464[/C][C]0.4652[/C][C]0.321908[/C][/ROW]
[ROW][C]44[/C][C]-0.042519[/C][C]-0.2976[/C][C]0.383622[/C][/ROW]
[ROW][C]45[/C][C]0.052578[/C][C]0.368[/C][C]0.357213[/C][/ROW]
[ROW][C]46[/C][C]-0.051372[/C][C]-0.3596[/C][C]0.360344[/C][/ROW]
[ROW][C]47[/C][C]0.033457[/C][C]0.2342[/C][C]0.407902[/C][/ROW]
[ROW][C]48[/C][C]0.099693[/C][C]0.6979[/C][C]0.244284[/C][/ROW]
[ROW][C]49[/C][C]NA[/C][C]NA[/C][C]NA[/C][/ROW]
[ROW][C]50[/C][C]NA[/C][C]NA[/C][C]NA[/C][/ROW]
[ROW][C]51[/C][C]NA[/C][C]NA[/C][C]NA[/C][/ROW]
[ROW][C]52[/C][C]NA[/C][C]NA[/C][C]NA[/C][/ROW]
[ROW][C]53[/C][C]NA[/C][C]NA[/C][C]NA[/C][/ROW]
[ROW][C]54[/C][C]NA[/C][C]NA[/C][C]NA[/C][/ROW]
[ROW][C]55[/C][C]NA[/C][C]NA[/C][C]NA[/C][/ROW]
[ROW][C]56[/C][C]NA[/C][C]NA[/C][C]NA[/C][/ROW]
[ROW][C]57[/C][C]NA[/C][C]NA[/C][C]NA[/C][/ROW]
[ROW][C]58[/C][C]NA[/C][C]NA[/C][C]NA[/C][/ROW]
[ROW][C]59[/C][C]NA[/C][C]NA[/C][C]NA[/C][/ROW]
[ROW][C]60[/C][C]NA[/C][C]NA[/C][C]NA[/C][/ROW]
[/TABLE]
Source: https://freestatistics.org/blog/index.php?pk=33777&T=2

Globally Unique Identifier (entire table): ba.freestatistics.org/blog/index.php?pk=33777&T=2

As an alternative you can also use a QR Code:  

The GUIDs for individual cells are displayed in the table below:

Partial Autocorrelation Function
Time lag kPACF(k)T-STATP-value
1-0.116475-0.81530.209415
20.1941351.35890.090194
3-0.035236-0.24670.403104
40.0693970.48580.314644
50.1343320.94030.175833
6-0.099446-0.69610.24482
70.0215380.15080.44039
8-0.050649-0.35450.362227
90.1582281.10760.136721
100.0144640.10120.459884
110.0838010.58660.28008
12-0.265151-1.85610.034732
13-0.093627-0.65540.257642
140.1615211.13060.131853
15-0.142789-0.99950.161226
16-0.083154-0.58210.28159
170.058530.40970.341902
180.1016080.71130.240148
190.0819830.57390.284336
20-0.014974-0.10480.458473
210.0124770.08730.465379
22-0.119712-0.8380.203053
230.0921950.64540.260851
24-0.234705-1.64290.0534
25-0.105667-0.73970.231514
260.002920.02040.491888
27-0.113037-0.79130.216303
28-0.145701-1.01990.15639
29-0.068085-0.47660.317884
30-0.04-0.280.390327
310.1124630.78720.217466
32-0.141417-0.98990.163538
330.199311.39520.084629
34-0.061559-0.43090.334212
35-0.064217-0.44950.32752
360.0014260.010.496039
37-0.028642-0.20050.420962
380.0091390.0640.474627
390.0257150.180.428945
40-0.045473-0.31830.375802
41-0.034844-0.24390.404159
420.0040780.02850.48867
430.0664640.46520.321908
44-0.042519-0.29760.383622
450.0525780.3680.357213
46-0.051372-0.35960.360344
470.0334570.23420.407902
480.0996930.69790.244284
49NANANA
50NANANA
51NANANA
52NANANA
53NANANA
54NANANA
55NANANA
56NANANA
57NANANA
58NANANA
59NANANA
60NANANA


Parameters (Session):
par1 = 60 ; par2 = 1 ; par3 = 1 ; par4 = 1 ; par5 = 12 ;
Parameters (R input):
par1 = 60 ; par2 = 1 ; par3 = 1 ; par4 = 1 ; par5 = 12 ;
R code (references can be found in the software module):
if (par1 == 'Default') {
par1 = 10*log10(length(x))
} else {
par1 <- as.numeric(par1)
}
par2 <- as.numeric(par2)
par3 <- as.numeric(par3)
par4 <- as.numeric(par4)
par5 <- as.numeric(par5)
if (par2 == 0) {
x <- log(x)
} else {
x <- (x ^ par2 - 1) / par2
}
if (par3 > 0) x <- diff(x,lag=1,difference=par3)
if (par4 > 0) x <- diff(x,lag=par5,difference=par4)
bitmap(file='pic1.png')
racf <- acf(x,par1,main='Autocorrelation',xlab='lags',ylab='ACF')
dev.off()
bitmap(file='pic2.png')
rpacf <- pacf(x,par1,main='Partial Autocorrelation',xlab='lags',ylab='PACF')
dev.off()
(myacf <- c(racf$acf))
(mypacf <- c(rpacf$acf))
lengthx <- length(x)
sqrtn <- sqrt(lengthx)
load(file='createtable')
a<-table.start()
a<-table.row.start(a)
a<-table.element(a,'Autocorrelation Function',4,TRUE)
a<-table.row.end(a)
a<-table.row.start(a)
a<-table.element(a,'Time lag k',header=TRUE)
a<-table.element(a,hyperlink('basics.htm','ACF(k)','click here for more information about the Autocorrelation Function'),header=TRUE)
a<-table.element(a,'T-STAT',header=TRUE)
a<-table.element(a,'P-value',header=TRUE)
a<-table.row.end(a)
for (i in 2:(par1+1)) {
a<-table.row.start(a)
a<-table.element(a,i-1,header=TRUE)
a<-table.element(a,round(myacf[i],6))
mytstat <- myacf[i]*sqrtn
a<-table.element(a,round(mytstat,4))
a<-table.element(a,round(1-pt(abs(mytstat),lengthx),6))
a<-table.row.end(a)
}
a<-table.end(a)
table.save(a,file='mytable.tab')
a<-table.start()
a<-table.row.start(a)
a<-table.element(a,'Partial Autocorrelation Function',4,TRUE)
a<-table.row.end(a)
a<-table.row.start(a)
a<-table.element(a,'Time lag k',header=TRUE)
a<-table.element(a,hyperlink('basics.htm','PACF(k)','click here for more information about the Partial Autocorrelation Function'),header=TRUE)
a<-table.element(a,'T-STAT',header=TRUE)
a<-table.element(a,'P-value',header=TRUE)
a<-table.row.end(a)
for (i in 1:par1) {
a<-table.row.start(a)
a<-table.element(a,i,header=TRUE)
a<-table.element(a,round(mypacf[i],6))
mytstat <- mypacf[i]*sqrtn
a<-table.element(a,round(mytstat,4))
a<-table.element(a,round(1-pt(abs(mytstat),lengthx),6))
a<-table.row.end(a)
}
a<-table.end(a)
table.save(a,file='mytable1.tab')