Free Statistics

of Irreproducible Research!

Author's title

Author*The author of this computation has been verified*
R Software Modulerwasp_arimabackwardselection.wasp
Title produced by softwareARIMA Backward Selection
Date of computationMon, 15 Dec 2008 11:33:03 -0700
Cite this page as followsStatistical Computations at FreeStatistics.org, Office for Research Development and Education, URL https://freestatistics.org/blog/index.php?v=date/2008/Dec/15/t1229366064xutbc3ummmpm97t.htm/, Retrieved Thu, 16 May 2024 02:08:05 +0000
Statistical Computations at FreeStatistics.org, Office for Research Development and Education, URL https://freestatistics.org/blog/index.php?pk=33776, Retrieved Thu, 16 May 2024 02:08:05 +0000
QR Codes:

Original text written by user:
IsPrivate?No (this computation is public)
User-defined keywords
Estimated Impact182
Family? (F = Feedback message, R = changed R code, M = changed R Module, P = changed Parameters, D = changed Data)
F     [Law of Averages] [Random Walk Simul...] [2008-11-25 17:50:19] [b98453cac15ba1066b407e146608df68]
F       [Law of Averages] [Non Stationary Ti...] [2008-11-30 21:33:42] [82d201ca7b4e7cd2c6f885d29b5b6937]
F RMPD    [(Partial) Autocorrelation Function] [(P) ACF] [2008-12-08 21:03:21] [82d201ca7b4e7cd2c6f885d29b5b6937]
- RMP         [ARIMA Backward Selection] [step 5] [2008-12-15 18:33:03] [284c7cdb9fcda2adcbb08e211682c8d6] [Current]
Feedback Forum

Post a new message
Dataseries X:
11703.7
16283.6
16726.5
14968.9
14861
14583.3
15305.8
17903.9
16379.4
15420.3
17870.5
15912.8
13866.5
17823.2
17872
17420.4
16704.4
15991.2
16583.6
19123.5
17838.7
17209.4
18586.5
16258.1
15141.6
19202.1
17746.5
19090.1
18040.3
17515.5
17751.8
21072.4
17170
19439.5
19795.4
17574.9
16165.4
19464.6
19932.1
19961.2
17343.4
18924.2
18574.1
21350.6
18594.6
19823.1
20844.4
19640.2
17735.4
19813.6
22160
20664.3
17877.4
21211.2
21423.1
21688.7
23243.2
21490.2
22925.8
23184.8
18562.2


Summary of computational transaction
Raw Inputview raw input (R code)
Raw Outputview raw output of R engine
Computing time9 seconds
R Server'Gwilym Jenkins' @ 72.249.127.135

\begin{tabular}{lllllllll}
\hline
Summary of computational transaction \tabularnewline
Raw Input & view raw input (R code)  \tabularnewline
Raw Output & view raw output of R engine  \tabularnewline
Computing time & 9 seconds \tabularnewline
R Server & 'Gwilym Jenkins' @ 72.249.127.135 \tabularnewline
\hline
\end{tabular}
%Source: https://freestatistics.org/blog/index.php?pk=33776&T=0

[TABLE]
[ROW][C]Summary of computational transaction[/C][/ROW]
[ROW][C]Raw Input[/C][C]view raw input (R code) [/C][/ROW]
[ROW][C]Raw Output[/C][C]view raw output of R engine [/C][/ROW]
[ROW][C]Computing time[/C][C]9 seconds[/C][/ROW]
[ROW][C]R Server[/C][C]'Gwilym Jenkins' @ 72.249.127.135[/C][/ROW]
[/TABLE]
Source: https://freestatistics.org/blog/index.php?pk=33776&T=0

Globally Unique Identifier (entire table): ba.freestatistics.org/blog/index.php?pk=33776&T=0

As an alternative you can also use a QR Code:  

The GUIDs for individual cells are displayed in the table below:

Summary of computational transaction
Raw Inputview raw input (R code)
Raw Outputview raw output of R engine
Computing time9 seconds
R Server'Gwilym Jenkins' @ 72.249.127.135


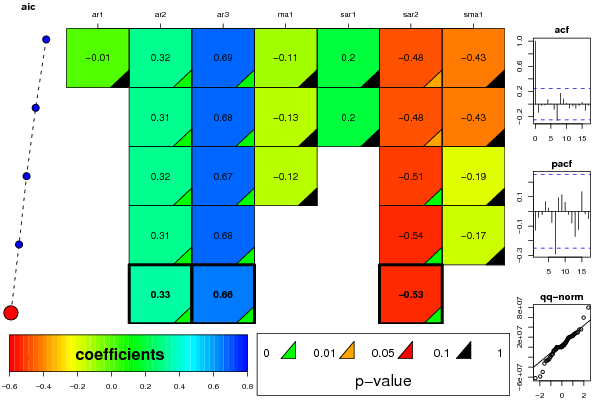
ARIMA Parameter Estimation and Backward Selection
Iterationar1ar2ar3ma1sar1sar2sma1
Estimates ( 1 )-0.01160.31880.6862-0.11380.2022-0.4792-0.4312
(p-val)(0.9406 )(0.0077 )(0 )(0.6122 )(0.6179 )(0.0139 )(0.4462 )
Estimates ( 2 )00.31470.6789-0.12550.2033-0.477-0.4312
(p-val)(NA )(0.0027 )(0 )(0.4335 )(0.6145 )(0.0137 )(0.4378 )
Estimates ( 3 )00.3170.674-0.1240-0.5077-0.191
(p-val)(NA )(0.0026 )(0 )(0.4367 )(NA )(0.0023 )(0.4366 )
Estimates ( 4 )00.30870.679400-0.5431-0.1652
(p-val)(NA )(0.002 )(0 )(NA )(NA )(5e-04 )(0.5039 )
Estimates ( 5 )00.32610.657100-0.52660
(p-val)(NA )(8e-04 )(0 )(NA )(NA )(9e-04 )(NA )
Estimates ( 6 )NANANANANANANA
(p-val)(NA )(NA )(NA )(NA )(NA )(NA )(NA )
Estimates ( 7 )NANANANANANANA
(p-val)(NA )(NA )(NA )(NA )(NA )(NA )(NA )
Estimates ( 8 )NANANANANANANA
(p-val)(NA )(NA )(NA )(NA )(NA )(NA )(NA )
Estimates ( 9 )NANANANANANANA
(p-val)(NA )(NA )(NA )(NA )(NA )(NA )(NA )
Estimates ( 10 )NANANANANANANA
(p-val)(NA )(NA )(NA )(NA )(NA )(NA )(NA )
Estimates ( 11 )NANANANANANANA
(p-val)(NA )(NA )(NA )(NA )(NA )(NA )(NA )
Estimates ( 12 )NANANANANANANA
(p-val)(NA )(NA )(NA )(NA )(NA )(NA )(NA )
Estimates ( 13 )NANANANANANANA
(p-val)(NA )(NA )(NA )(NA )(NA )(NA )(NA )

\begin{tabular}{lllllllll}
\hline
ARIMA Parameter Estimation and Backward Selection \tabularnewline
Iteration & ar1 & ar2 & ar3 & ma1 & sar1 & sar2 & sma1 \tabularnewline
Estimates ( 1 ) & -0.0116 & 0.3188 & 0.6862 & -0.1138 & 0.2022 & -0.4792 & -0.4312 \tabularnewline
(p-val) & (0.9406 ) & (0.0077 ) & (0 ) & (0.6122 ) & (0.6179 ) & (0.0139 ) & (0.4462 ) \tabularnewline
Estimates ( 2 ) & 0 & 0.3147 & 0.6789 & -0.1255 & 0.2033 & -0.477 & -0.4312 \tabularnewline
(p-val) & (NA ) & (0.0027 ) & (0 ) & (0.4335 ) & (0.6145 ) & (0.0137 ) & (0.4378 ) \tabularnewline
Estimates ( 3 ) & 0 & 0.317 & 0.674 & -0.124 & 0 & -0.5077 & -0.191 \tabularnewline
(p-val) & (NA ) & (0.0026 ) & (0 ) & (0.4367 ) & (NA ) & (0.0023 ) & (0.4366 ) \tabularnewline
Estimates ( 4 ) & 0 & 0.3087 & 0.6794 & 0 & 0 & -0.5431 & -0.1652 \tabularnewline
(p-val) & (NA ) & (0.002 ) & (0 ) & (NA ) & (NA ) & (5e-04 ) & (0.5039 ) \tabularnewline
Estimates ( 5 ) & 0 & 0.3261 & 0.6571 & 0 & 0 & -0.5266 & 0 \tabularnewline
(p-val) & (NA ) & (8e-04 ) & (0 ) & (NA ) & (NA ) & (9e-04 ) & (NA ) \tabularnewline
Estimates ( 6 ) & NA & NA & NA & NA & NA & NA & NA \tabularnewline
(p-val) & (NA ) & (NA ) & (NA ) & (NA ) & (NA ) & (NA ) & (NA ) \tabularnewline
Estimates ( 7 ) & NA & NA & NA & NA & NA & NA & NA \tabularnewline
(p-val) & (NA ) & (NA ) & (NA ) & (NA ) & (NA ) & (NA ) & (NA ) \tabularnewline
Estimates ( 8 ) & NA & NA & NA & NA & NA & NA & NA \tabularnewline
(p-val) & (NA ) & (NA ) & (NA ) & (NA ) & (NA ) & (NA ) & (NA ) \tabularnewline
Estimates ( 9 ) & NA & NA & NA & NA & NA & NA & NA \tabularnewline
(p-val) & (NA ) & (NA ) & (NA ) & (NA ) & (NA ) & (NA ) & (NA ) \tabularnewline
Estimates ( 10 ) & NA & NA & NA & NA & NA & NA & NA \tabularnewline
(p-val) & (NA ) & (NA ) & (NA ) & (NA ) & (NA ) & (NA ) & (NA ) \tabularnewline
Estimates ( 11 ) & NA & NA & NA & NA & NA & NA & NA \tabularnewline
(p-val) & (NA ) & (NA ) & (NA ) & (NA ) & (NA ) & (NA ) & (NA ) \tabularnewline
Estimates ( 12 ) & NA & NA & NA & NA & NA & NA & NA \tabularnewline
(p-val) & (NA ) & (NA ) & (NA ) & (NA ) & (NA ) & (NA ) & (NA ) \tabularnewline
Estimates ( 13 ) & NA & NA & NA & NA & NA & NA & NA \tabularnewline
(p-val) & (NA ) & (NA ) & (NA ) & (NA ) & (NA ) & (NA ) & (NA ) \tabularnewline
\hline
\end{tabular}
%Source: https://freestatistics.org/blog/index.php?pk=33776&T=1

[TABLE]
[ROW][C]ARIMA Parameter Estimation and Backward Selection[/C][/ROW]
[ROW][C]Iteration[/C][C]ar1[/C][C]ar2[/C][C]ar3[/C][C]ma1[/C][C]sar1[/C][C]sar2[/C][C]sma1[/C][/ROW]
[ROW][C]Estimates ( 1 )[/C][C]-0.0116[/C][C]0.3188[/C][C]0.6862[/C][C]-0.1138[/C][C]0.2022[/C][C]-0.4792[/C][C]-0.4312[/C][/ROW]
[ROW][C](p-val)[/C][C](0.9406 )[/C][C](0.0077 )[/C][C](0 )[/C][C](0.6122 )[/C][C](0.6179 )[/C][C](0.0139 )[/C][C](0.4462 )[/C][/ROW]
[ROW][C]Estimates ( 2 )[/C][C]0[/C][C]0.3147[/C][C]0.6789[/C][C]-0.1255[/C][C]0.2033[/C][C]-0.477[/C][C]-0.4312[/C][/ROW]
[ROW][C](p-val)[/C][C](NA )[/C][C](0.0027 )[/C][C](0 )[/C][C](0.4335 )[/C][C](0.6145 )[/C][C](0.0137 )[/C][C](0.4378 )[/C][/ROW]
[ROW][C]Estimates ( 3 )[/C][C]0[/C][C]0.317[/C][C]0.674[/C][C]-0.124[/C][C]0[/C][C]-0.5077[/C][C]-0.191[/C][/ROW]
[ROW][C](p-val)[/C][C](NA )[/C][C](0.0026 )[/C][C](0 )[/C][C](0.4367 )[/C][C](NA )[/C][C](0.0023 )[/C][C](0.4366 )[/C][/ROW]
[ROW][C]Estimates ( 4 )[/C][C]0[/C][C]0.3087[/C][C]0.6794[/C][C]0[/C][C]0[/C][C]-0.5431[/C][C]-0.1652[/C][/ROW]
[ROW][C](p-val)[/C][C](NA )[/C][C](0.002 )[/C][C](0 )[/C][C](NA )[/C][C](NA )[/C][C](5e-04 )[/C][C](0.5039 )[/C][/ROW]
[ROW][C]Estimates ( 5 )[/C][C]0[/C][C]0.3261[/C][C]0.6571[/C][C]0[/C][C]0[/C][C]-0.5266[/C][C]0[/C][/ROW]
[ROW][C](p-val)[/C][C](NA )[/C][C](8e-04 )[/C][C](0 )[/C][C](NA )[/C][C](NA )[/C][C](9e-04 )[/C][C](NA )[/C][/ROW]
[ROW][C]Estimates ( 6 )[/C][C]NA[/C][C]NA[/C][C]NA[/C][C]NA[/C][C]NA[/C][C]NA[/C][C]NA[/C][/ROW]
[ROW][C](p-val)[/C][C](NA )[/C][C](NA )[/C][C](NA )[/C][C](NA )[/C][C](NA )[/C][C](NA )[/C][C](NA )[/C][/ROW]
[ROW][C]Estimates ( 7 )[/C][C]NA[/C][C]NA[/C][C]NA[/C][C]NA[/C][C]NA[/C][C]NA[/C][C]NA[/C][/ROW]
[ROW][C](p-val)[/C][C](NA )[/C][C](NA )[/C][C](NA )[/C][C](NA )[/C][C](NA )[/C][C](NA )[/C][C](NA )[/C][/ROW]
[ROW][C]Estimates ( 8 )[/C][C]NA[/C][C]NA[/C][C]NA[/C][C]NA[/C][C]NA[/C][C]NA[/C][C]NA[/C][/ROW]
[ROW][C](p-val)[/C][C](NA )[/C][C](NA )[/C][C](NA )[/C][C](NA )[/C][C](NA )[/C][C](NA )[/C][C](NA )[/C][/ROW]
[ROW][C]Estimates ( 9 )[/C][C]NA[/C][C]NA[/C][C]NA[/C][C]NA[/C][C]NA[/C][C]NA[/C][C]NA[/C][/ROW]
[ROW][C](p-val)[/C][C](NA )[/C][C](NA )[/C][C](NA )[/C][C](NA )[/C][C](NA )[/C][C](NA )[/C][C](NA )[/C][/ROW]
[ROW][C]Estimates ( 10 )[/C][C]NA[/C][C]NA[/C][C]NA[/C][C]NA[/C][C]NA[/C][C]NA[/C][C]NA[/C][/ROW]
[ROW][C](p-val)[/C][C](NA )[/C][C](NA )[/C][C](NA )[/C][C](NA )[/C][C](NA )[/C][C](NA )[/C][C](NA )[/C][/ROW]
[ROW][C]Estimates ( 11 )[/C][C]NA[/C][C]NA[/C][C]NA[/C][C]NA[/C][C]NA[/C][C]NA[/C][C]NA[/C][/ROW]
[ROW][C](p-val)[/C][C](NA )[/C][C](NA )[/C][C](NA )[/C][C](NA )[/C][C](NA )[/C][C](NA )[/C][C](NA )[/C][/ROW]
[ROW][C]Estimates ( 12 )[/C][C]NA[/C][C]NA[/C][C]NA[/C][C]NA[/C][C]NA[/C][C]NA[/C][C]NA[/C][/ROW]
[ROW][C](p-val)[/C][C](NA )[/C][C](NA )[/C][C](NA )[/C][C](NA )[/C][C](NA )[/C][C](NA )[/C][C](NA )[/C][/ROW]
[ROW][C]Estimates ( 13 )[/C][C]NA[/C][C]NA[/C][C]NA[/C][C]NA[/C][C]NA[/C][C]NA[/C][C]NA[/C][/ROW]
[ROW][C](p-val)[/C][C](NA )[/C][C](NA )[/C][C](NA )[/C][C](NA )[/C][C](NA )[/C][C](NA )[/C][C](NA )[/C][/ROW]
[/TABLE]
Source: https://freestatistics.org/blog/index.php?pk=33776&T=1

Globally Unique Identifier (entire table): ba.freestatistics.org/blog/index.php?pk=33776&T=1

As an alternative you can also use a QR Code:  

The GUIDs for individual cells are displayed in the table below:

ARIMA Parameter Estimation and Backward Selection
Iterationar1ar2ar3ma1sar1sar2sma1
Estimates ( 1 )-0.01160.31880.6862-0.11380.2022-0.4792-0.4312
(p-val)(0.9406 )(0.0077 )(0 )(0.6122 )(0.6179 )(0.0139 )(0.4462 )
Estimates ( 2 )00.31470.6789-0.12550.2033-0.477-0.4312
(p-val)(NA )(0.0027 )(0 )(0.4335 )(0.6145 )(0.0137 )(0.4378 )
Estimates ( 3 )00.3170.674-0.1240-0.5077-0.191
(p-val)(NA )(0.0026 )(0 )(0.4367 )(NA )(0.0023 )(0.4366 )
Estimates ( 4 )00.30870.679400-0.5431-0.1652
(p-val)(NA )(0.002 )(0 )(NA )(NA )(5e-04 )(0.5039 )
Estimates ( 5 )00.32610.657100-0.52660
(p-val)(NA )(8e-04 )(0 )(NA )(NA )(9e-04 )(NA )
Estimates ( 6 )NANANANANANANA
(p-val)(NA )(NA )(NA )(NA )(NA )(NA )(NA )
Estimates ( 7 )NANANANANANANA
(p-val)(NA )(NA )(NA )(NA )(NA )(NA )(NA )
Estimates ( 8 )NANANANANANANA
(p-val)(NA )(NA )(NA )(NA )(NA )(NA )(NA )
Estimates ( 9 )NANANANANANANA
(p-val)(NA )(NA )(NA )(NA )(NA )(NA )(NA )
Estimates ( 10 )NANANANANANANA
(p-val)(NA )(NA )(NA )(NA )(NA )(NA )(NA )
Estimates ( 11 )NANANANANANANA
(p-val)(NA )(NA )(NA )(NA )(NA )(NA )(NA )
Estimates ( 12 )NANANANANANANA
(p-val)(NA )(NA )(NA )(NA )(NA )(NA )(NA )
Estimates ( 13 )NANANANANANANA
(p-val)(NA )(NA )(NA )(NA )(NA )(NA )(NA )


Estimated ARIMA Residuals
Value
253202.500811755
20804862.8733172
7306342.72334608
-4167307.48362015
22674805.6994816
10229057.5190389
-5344883.91506294
-24350182.3909752
-4659746.15421237
8110607.95063431
15368675.2573655
-14663652.6925097
-32717068.9319699
-7455604.76769044
26687451.3535887
-18833012.7281097
19293459.9825221
13694951.2151846
29559985.1876862
-13577413.4280348
28250319.2209009
-58782518.6448497
29565940.9090299
2442054.80576927
23021816.9370904
-27469212.226868
-25434621.7086005
35414546.3495542
25714064.546446
-49479230.6016683
-15496698.7858873
-4210544.07385796
11986087.6896280
3500471.40302307
4233179.41185561
7702815.74800505
19433978.1912307
19978303.3281300
-26936412.7674723
17855045.3652024
3305431.24331839
-20474827.8787670
35870464.5292126
79555034.954043
-7740309.22778651
59238262.1813345
4121539.03814139
22648660.5824174
20733680.6730711
-62131132.9395974

\begin{tabular}{lllllllll}
\hline
Estimated ARIMA Residuals \tabularnewline
Value \tabularnewline
253202.500811755 \tabularnewline
20804862.8733172 \tabularnewline
7306342.72334608 \tabularnewline
-4167307.48362015 \tabularnewline
22674805.6994816 \tabularnewline
10229057.5190389 \tabularnewline
-5344883.91506294 \tabularnewline
-24350182.3909752 \tabularnewline
-4659746.15421237 \tabularnewline
8110607.95063431 \tabularnewline
15368675.2573655 \tabularnewline
-14663652.6925097 \tabularnewline
-32717068.9319699 \tabularnewline
-7455604.76769044 \tabularnewline
26687451.3535887 \tabularnewline
-18833012.7281097 \tabularnewline
19293459.9825221 \tabularnewline
13694951.2151846 \tabularnewline
29559985.1876862 \tabularnewline
-13577413.4280348 \tabularnewline
28250319.2209009 \tabularnewline
-58782518.6448497 \tabularnewline
29565940.9090299 \tabularnewline
2442054.80576927 \tabularnewline
23021816.9370904 \tabularnewline
-27469212.226868 \tabularnewline
-25434621.7086005 \tabularnewline
35414546.3495542 \tabularnewline
25714064.546446 \tabularnewline
-49479230.6016683 \tabularnewline
-15496698.7858873 \tabularnewline
-4210544.07385796 \tabularnewline
11986087.6896280 \tabularnewline
3500471.40302307 \tabularnewline
4233179.41185561 \tabularnewline
7702815.74800505 \tabularnewline
19433978.1912307 \tabularnewline
19978303.3281300 \tabularnewline
-26936412.7674723 \tabularnewline
17855045.3652024 \tabularnewline
3305431.24331839 \tabularnewline
-20474827.8787670 \tabularnewline
35870464.5292126 \tabularnewline
79555034.954043 \tabularnewline
-7740309.22778651 \tabularnewline
59238262.1813345 \tabularnewline
4121539.03814139 \tabularnewline
22648660.5824174 \tabularnewline
20733680.6730711 \tabularnewline
-62131132.9395974 \tabularnewline
\hline
\end{tabular}
%Source: https://freestatistics.org/blog/index.php?pk=33776&T=2

[TABLE]
[ROW][C]Estimated ARIMA Residuals[/C][/ROW]
[ROW][C]Value[/C][/ROW]
[ROW][C]253202.500811755[/C][/ROW]
[ROW][C]20804862.8733172[/C][/ROW]
[ROW][C]7306342.72334608[/C][/ROW]
[ROW][C]-4167307.48362015[/C][/ROW]
[ROW][C]22674805.6994816[/C][/ROW]
[ROW][C]10229057.5190389[/C][/ROW]
[ROW][C]-5344883.91506294[/C][/ROW]
[ROW][C]-24350182.3909752[/C][/ROW]
[ROW][C]-4659746.15421237[/C][/ROW]
[ROW][C]8110607.95063431[/C][/ROW]
[ROW][C]15368675.2573655[/C][/ROW]
[ROW][C]-14663652.6925097[/C][/ROW]
[ROW][C]-32717068.9319699[/C][/ROW]
[ROW][C]-7455604.76769044[/C][/ROW]
[ROW][C]26687451.3535887[/C][/ROW]
[ROW][C]-18833012.7281097[/C][/ROW]
[ROW][C]19293459.9825221[/C][/ROW]
[ROW][C]13694951.2151846[/C][/ROW]
[ROW][C]29559985.1876862[/C][/ROW]
[ROW][C]-13577413.4280348[/C][/ROW]
[ROW][C]28250319.2209009[/C][/ROW]
[ROW][C]-58782518.6448497[/C][/ROW]
[ROW][C]29565940.9090299[/C][/ROW]
[ROW][C]2442054.80576927[/C][/ROW]
[ROW][C]23021816.9370904[/C][/ROW]
[ROW][C]-27469212.226868[/C][/ROW]
[ROW][C]-25434621.7086005[/C][/ROW]
[ROW][C]35414546.3495542[/C][/ROW]
[ROW][C]25714064.546446[/C][/ROW]
[ROW][C]-49479230.6016683[/C][/ROW]
[ROW][C]-15496698.7858873[/C][/ROW]
[ROW][C]-4210544.07385796[/C][/ROW]
[ROW][C]11986087.6896280[/C][/ROW]
[ROW][C]3500471.40302307[/C][/ROW]
[ROW][C]4233179.41185561[/C][/ROW]
[ROW][C]7702815.74800505[/C][/ROW]
[ROW][C]19433978.1912307[/C][/ROW]
[ROW][C]19978303.3281300[/C][/ROW]
[ROW][C]-26936412.7674723[/C][/ROW]
[ROW][C]17855045.3652024[/C][/ROW]
[ROW][C]3305431.24331839[/C][/ROW]
[ROW][C]-20474827.8787670[/C][/ROW]
[ROW][C]35870464.5292126[/C][/ROW]
[ROW][C]79555034.954043[/C][/ROW]
[ROW][C]-7740309.22778651[/C][/ROW]
[ROW][C]59238262.1813345[/C][/ROW]
[ROW][C]4121539.03814139[/C][/ROW]
[ROW][C]22648660.5824174[/C][/ROW]
[ROW][C]20733680.6730711[/C][/ROW]
[ROW][C]-62131132.9395974[/C][/ROW]
[/TABLE]
Source: https://freestatistics.org/blog/index.php?pk=33776&T=2

Globally Unique Identifier (entire table): ba.freestatistics.org/blog/index.php?pk=33776&T=2

As an alternative you can also use a QR Code:  

The GUIDs for individual cells are displayed in the table below:

Estimated ARIMA Residuals
Value
253202.500811755
20804862.8733172
7306342.72334608
-4167307.48362015
22674805.6994816
10229057.5190389
-5344883.91506294
-24350182.3909752
-4659746.15421237
8110607.95063431
15368675.2573655
-14663652.6925097
-32717068.9319699
-7455604.76769044
26687451.3535887
-18833012.7281097
19293459.9825221
13694951.2151846
29559985.1876862
-13577413.4280348
28250319.2209009
-58782518.6448497
29565940.9090299
2442054.80576927
23021816.9370904
-27469212.226868
-25434621.7086005
35414546.3495542
25714064.546446
-49479230.6016683
-15496698.7858873
-4210544.07385796
11986087.6896280
3500471.40302307
4233179.41185561
7702815.74800505
19433978.1912307
19978303.3281300
-26936412.7674723
17855045.3652024
3305431.24331839
-20474827.8787670
35870464.5292126
79555034.954043
-7740309.22778651
59238262.1813345
4121539.03814139
22648660.5824174
20733680.6730711
-62131132.9395974


Parameters (Session):
par1 = FALSE ; par2 = 2.0 ; par3 = 0 ; par4 = 1 ; par5 = 12 ; par6 = 3 ; par7 = 1 ; par8 = 2 ; par9 = 1 ;
Parameters (R input):
par1 = FALSE ; par2 = 2.0 ; par3 = 0 ; par4 = 1 ; par5 = 12 ; par6 = 3 ; par7 = 1 ; par8 = 2 ; par9 = 1 ;
R code (references can be found in the software module):
library(lattice)
if (par1 == 'TRUE') par1 <- TRUE
if (par1 == 'FALSE') par1 <- FALSE
par2 <- as.numeric(par2) #Box-Cox lambda transformation parameter
par3 <- as.numeric(par3) #degree of non-seasonal differencing
par4 <- as.numeric(par4) #degree of seasonal differencing
par5 <- as.numeric(par5) #seasonal period
par6 <- as.numeric(par6) #degree (p) of the non-seasonal AR(p) polynomial
par7 <- as.numeric(par7) #degree (q) of the non-seasonal MA(q) polynomial
par8 <- as.numeric(par8) #degree (P) of the seasonal AR(P) polynomial
par9 <- as.numeric(par9) #degree (Q) of the seasonal MA(Q) polynomial
armaGR <- function(arima.out, names, n){
try1 <- arima.out$coef
try2 <- sqrt(diag(arima.out$var.coef))
try.data.frame <- data.frame(matrix(NA,ncol=4,nrow=length(names)))
dimnames(try.data.frame) <- list(names,c('coef','std','tstat','pv'))
try.data.frame[,1] <- try1
for(i in 1:length(try2)) try.data.frame[which(rownames(try.data.frame)==names(try2)[i]),2] <- try2[i]
try.data.frame[,3] <- try.data.frame[,1] / try.data.frame[,2]
try.data.frame[,4] <- round((1-pt(abs(try.data.frame[,3]),df=n-(length(try2)+1)))*2,5)
vector <- rep(NA,length(names))
vector[is.na(try.data.frame[,4])] <- 0
maxi <- which.max(try.data.frame[,4])
continue <- max(try.data.frame[,4],na.rm=TRUE) > .05
vector[maxi] <- 0
list(summary=try.data.frame,next.vector=vector,continue=continue)
}
arimaSelect <- function(series, order=c(13,0,0), seasonal=list(order=c(2,0,0),period=12), include.mean=F){
nrc <- order[1]+order[3]+seasonal$order[1]+seasonal$order[3]
coeff <- matrix(NA, nrow=nrc*2, ncol=nrc)
pval <- matrix(NA, nrow=nrc*2, ncol=nrc)
mylist <- rep(list(NULL), nrc)
names <- NULL
if(order[1] > 0) names <- paste('ar',1:order[1],sep='')
if(order[3] > 0) names <- c( names , paste('ma',1:order[3],sep='') )
if(seasonal$order[1] > 0) names <- c(names, paste('sar',1:seasonal$order[1],sep=''))
if(seasonal$order[3] > 0) names <- c(names, paste('sma',1:seasonal$order[3],sep=''))
arima.out <- arima(series, order=order, seasonal=seasonal, include.mean=include.mean, method='ML')
mylist[[1]] <- arima.out
last.arma <- armaGR(arima.out, names, length(series))
mystop <- FALSE
i <- 1
coeff[i,] <- last.arma[[1]][,1]
pval [i,] <- last.arma[[1]][,4]
i <- 2
aic <- arima.out$aic
while(!mystop){
mylist[[i]] <- arima.out
arima.out <- arima(series, order=order, seasonal=seasonal, include.mean=include.mean, method='ML', fixed=last.arma$next.vector)
aic <- c(aic, arima.out$aic)
last.arma <- armaGR(arima.out, names, length(series))
mystop <- !last.arma$continue
coeff[i,] <- last.arma[[1]][,1]
pval [i,] <- last.arma[[1]][,4]
i <- i+1
}
list(coeff, pval, mylist, aic=aic)
}
arimaSelectplot <- function(arimaSelect.out,noms,choix){
noms <- names(arimaSelect.out[[3]][[1]]$coef)
coeff <- arimaSelect.out[[1]]
k <- min(which(is.na(coeff[,1])))-1
coeff <- coeff[1:k,]
pval <- arimaSelect.out[[2]][1:k,]
aic <- arimaSelect.out$aic[1:k]
coeff[coeff==0] <- NA
n <- ncol(coeff)
if(missing(choix)) choix <- k
layout(matrix(c(1,1,1,2,
3,3,3,2,
3,3,3,4,
5,6,7,7),nr=4),
widths=c(10,35,45,15),
heights=c(30,30,15,15))
couleurs <- rainbow(75)[1:50]#(50)
ticks <- pretty(coeff)
par(mar=c(1,1,3,1))
plot(aic,k:1-.5,type='o',pch=21,bg='blue',cex=2,axes=F,lty=2,xpd=NA)
points(aic[choix],k-choix+.5,pch=21,cex=4,bg=2,xpd=NA)
title('aic',line=2)
par(mar=c(3,0,0,0))
plot(0,axes=F,xlab='',ylab='',xlim=range(ticks),ylim=c(.1,1))
rect(xleft = min(ticks) + (0:49)/50*(max(ticks)-min(ticks)),
xright = min(ticks) + (1:50)/50*(max(ticks)-min(ticks)),
ytop = rep(1,50),
ybottom= rep(0,50),col=couleurs,border=NA)
axis(1,ticks)
rect(xleft=min(ticks),xright=max(ticks),ytop=1,ybottom=0)
text(mean(coeff,na.rm=T),.5,'coefficients',cex=2,font=2)
par(mar=c(1,1,3,1))
image(1:n,1:k,t(coeff[k:1,]),axes=F,col=couleurs,zlim=range(ticks))
for(i in 1:n) for(j in 1:k) if(!is.na(coeff[j,i])) {
if(pval[j,i]<.01) symb = 'green'
else if( (pval[j,i]<.05) & (pval[j,i]>=.01)) symb = 'orange'
else if( (pval[j,i]<.1) & (pval[j,i]>=.05)) symb = 'red'
else symb = 'black'
polygon(c(i+.5 ,i+.2 ,i+.5 ,i+.5),
c(k-j+0.5,k-j+0.5,k-j+0.8,k-j+0.5),
col=symb)
if(j==choix) {
rect(xleft=i-.5,
xright=i+.5,
ybottom=k-j+1.5,
ytop=k-j+.5,
lwd=4)
text(i,
k-j+1,
round(coeff[j,i],2),
cex=1.2,
font=2)
}
else{
rect(xleft=i-.5,xright=i+.5,ybottom=k-j+1.5,ytop=k-j+.5)
text(i,k-j+1,round(coeff[j,i],2),cex=1.2,font=1)
}
}
axis(3,1:n,noms)
par(mar=c(0.5,0,0,0.5))
plot(0,axes=F,xlab='',ylab='',type='n',xlim=c(0,8),ylim=c(-.2,.8))
cols <- c('green','orange','red','black')
niv <- c('0','0.01','0.05','0.1')
for(i in 0:3){
polygon(c(1+2*i ,1+2*i ,1+2*i-.5 ,1+2*i),
c(.4 ,.7 , .4 , .4),
col=cols[i+1])
text(2*i,0.5,niv[i+1],cex=1.5)
}
text(8,.5,1,cex=1.5)
text(4,0,'p-value',cex=2)
box()
residus <- arimaSelect.out[[3]][[choix]]$res
par(mar=c(1,2,4,1))
acf(residus,main='')
title('acf',line=.5)
par(mar=c(1,2,4,1))
pacf(residus,main='')
title('pacf',line=.5)
par(mar=c(2,2,4,1))
qqnorm(residus,main='')
title('qq-norm',line=.5)
qqline(residus)
residus
}
if (par2 == 0) x <- log(x)
if (par2 != 0) x <- x^par2
(selection <- arimaSelect(x, order=c(par6,par3,par7), seasonal=list(order=c(par8,par4,par9), period=par5)))
bitmap(file='test1.png')
resid <- arimaSelectplot(selection)
dev.off()
resid
bitmap(file='test2.png')
acf(resid,length(resid)/2, main='Residual Autocorrelation Function')
dev.off()
bitmap(file='test3.png')
pacf(resid,length(resid)/2, main='Residual Partial Autocorrelation Function')
dev.off()
bitmap(file='test4.png')
cpgram(resid, main='Residual Cumulative Periodogram')
dev.off()
bitmap(file='test5.png')
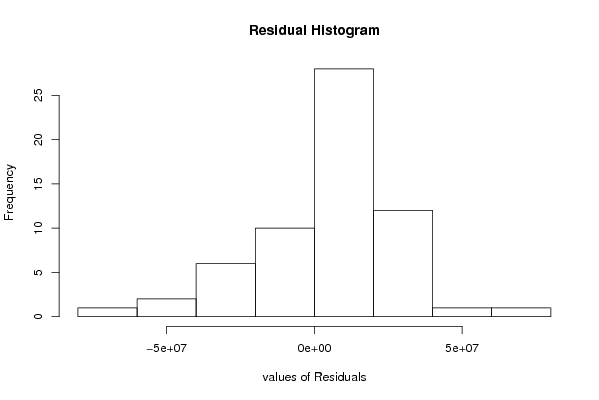
hist(resid, main='Residual Histogram', xlab='values of Residuals')
dev.off()
bitmap(file='test6.png')
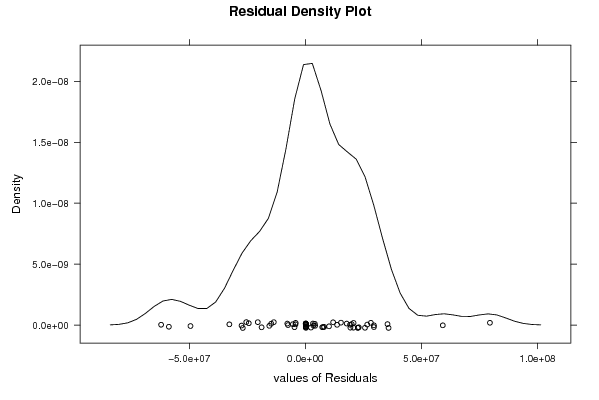
densityplot(~resid,col='black',main='Residual Density Plot', xlab='values of Residuals')
dev.off()
bitmap(file='test7.png')
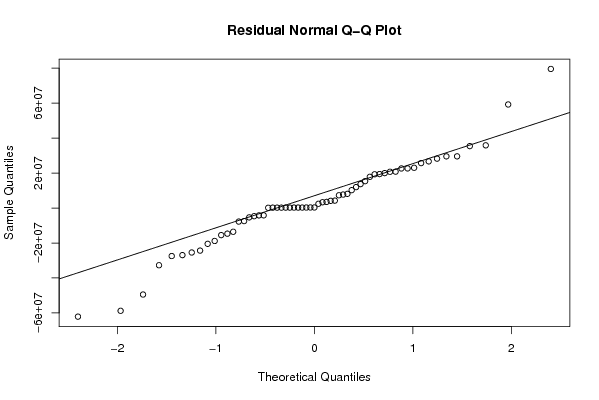
qqnorm(resid, main='Residual Normal Q-Q Plot')
qqline(resid)
dev.off()
ncols <- length(selection[[1]][1,])
nrows <- length(selection[[2]][,1])-1
load(file='createtable')
a<-table.start()
a<-table.row.start(a)
a<-table.element(a,'ARIMA Parameter Estimation and Backward Selection', ncols+1,TRUE)
a<-table.row.end(a)
a<-table.row.start(a)
a<-table.element(a,'Iteration', header=TRUE)
for (i in 1:ncols) {
a<-table.element(a,names(selection[[3]][[1]]$coef)[i],header=TRUE)
}
a<-table.row.end(a)
for (j in 1:nrows) {
a<-table.row.start(a)
mydum <- 'Estimates ('
mydum <- paste(mydum,j)
mydum <- paste(mydum,')')
a<-table.element(a,mydum, header=TRUE)
for (i in 1:ncols) {
a<-table.element(a,round(selection[[1]][j,i],4))
}
a<-table.row.end(a)
a<-table.row.start(a)
a<-table.element(a,'(p-val)', header=TRUE)
for (i in 1:ncols) {
mydum <- '('
mydum <- paste(mydum,round(selection[[2]][j,i],4),sep='')
mydum <- paste(mydum,')')
a<-table.element(a,mydum)
}
a<-table.row.end(a)
}
a<-table.end(a)
table.save(a,file='mytable.tab')
a<-table.start()
a<-table.row.start(a)
a<-table.element(a,'Estimated ARIMA Residuals', 1,TRUE)
a<-table.row.end(a)
a<-table.row.start(a)
a<-table.element(a,'Value', 1,TRUE)
a<-table.row.end(a)
for (i in (par4*par5+par3):length(resid)) {
a<-table.row.start(a)
a<-table.element(a,resid[i])
a<-table.row.end(a)
}
a<-table.end(a)
table.save(a,file='mytable1.tab')