Free Statistics

of Irreproducible Research!

Author's title

Author*The author of this computation has been verified*
R Software Modulerwasp_multipleregression.wasp
Title produced by softwareMultiple Regression
Date of computationMon, 15 Dec 2008 11:29:28 -0700
Cite this page as followsStatistical Computations at FreeStatistics.org, Office for Research Development and Education, URL https://freestatistics.org/blog/index.php?v=date/2008/Dec/15/t1229365906kltc46rog13uv57.htm/, Retrieved Thu, 16 May 2024 00:33:41 +0000
Statistical Computations at FreeStatistics.org, Office for Research Development and Education, URL https://freestatistics.org/blog/index.php?pk=33775, Retrieved Thu, 16 May 2024 00:33:41 +0000
QR Codes:

Original text written by user:
IsPrivate?No (this computation is public)
User-defined keywords
Estimated Impact222
Family? (F = Feedback message, R = changed R code, M = changed R Module, P = changed Parameters, D = changed Data)
-       [Multiple Regression] [dummy seasonal du...] [2008-12-15 18:29:28] [3fc0b50a130253095e963177b0139835] [Current]
-  M D    [Multiple Regression] [seizoensdummies b...] [2010-12-16 12:26:31] [ff7c1e95cf99a1dae07ec89975494dde]
Feedback Forum

Post a new message
Dataseries X:
101.02	0
100.67	0
100.47	0
100.38	0
100.33	0
100.34	0
100.37	0
100.39	0
100.21	0
100.21	0
100.22	0
100.28	0
100.25	0
100.25	0
100.21	0
100.16	0
100.18	0
100.1	1
99.96	1
99.88	1
99.88	1
99.86	1
99.84	1
99.8	1
99.82	1
99.81	1
99.92	1
100.03	1
99.99	1
100.02	1
100.01	1
100.13	1
100.33	1
100.13	1
99.96	1
100.05	1
99.83	1
99.8	1
100.01	1
100.1	1
100.13	1
100.16	1
100.41	1
101.34	1
101.65	1
101.85	1
102.07	1
102.12	1
102.14	1
102.21	1
102.28	1
102.19	1
102.33	1
102.54	1
102.44	1
102.78	1
102.9	1
103.08	1
102.77	1
102.65	1
102.71	1
103.29	1
102.86	1
103.45	1
103.72	1
103.65	1
103.83	1
104.45	1
105.14	1
105.07	1
105.31	1
105.19	1
105.3	1
105.02	1
105.17	1
105.28	1
105.45	1
105.38	1
105.8	1
105.96	1
105.08	1
105.11	1
105.61	1
105.5	1


Summary of computational transaction
Raw Inputview raw input (R code)
Raw Outputview raw output of R engine
Computing time6 seconds
R Server'Sir Ronald Aylmer Fisher' @ 193.190.124.24

\begin{tabular}{lllllllll}
\hline
Summary of computational transaction \tabularnewline
Raw Input & view raw input (R code)  \tabularnewline
Raw Output & view raw output of R engine  \tabularnewline
Computing time & 6 seconds \tabularnewline
R Server & 'Sir Ronald Aylmer Fisher' @ 193.190.124.24 \tabularnewline
\hline
\end{tabular}
%Source: https://freestatistics.org/blog/index.php?pk=33775&T=0

[TABLE]
[ROW][C]Summary of computational transaction[/C][/ROW]
[ROW][C]Raw Input[/C][C]view raw input (R code) [/C][/ROW]
[ROW][C]Raw Output[/C][C]view raw output of R engine [/C][/ROW]
[ROW][C]Computing time[/C][C]6 seconds[/C][/ROW]
[ROW][C]R Server[/C][C]'Sir Ronald Aylmer Fisher' @ 193.190.124.24[/C][/ROW]
[/TABLE]
Source: https://freestatistics.org/blog/index.php?pk=33775&T=0

Globally Unique Identifier (entire table): ba.freestatistics.org/blog/index.php?pk=33775&T=0

As an alternative you can also use a QR Code:  

The GUIDs for individual cells are displayed in the table below:

Summary of computational transaction
Raw Inputview raw input (R code)
Raw Outputview raw output of R engine
Computing time6 seconds
R Server'Sir Ronald Aylmer Fisher' @ 193.190.124.24


Multiple Linear Regression - Estimated Regression Equation
Suiker[t] = + 100.608354037267 + 1.88858695652174Dummy[t] -0.375916149068327M1[t] -0.378773291925467M2[t] -0.397344720496895M3[t] -0.301630434782611M4[t] -0.224487577639753M5[t] -0.485714285714286M6[t] -0.395714285714287M7[t] -0.094285714285716M8[t] -0.057142857142858M9[t] -0.0400000000000042M10[t] + 0.0271428571428547M11[t] + e[t]

\begin{tabular}{lllllllll}
\hline
Multiple Linear Regression - Estimated Regression Equation \tabularnewline
Suiker[t] =  +  100.608354037267 +  1.88858695652174Dummy[t] -0.375916149068327M1[t] -0.378773291925467M2[t] -0.397344720496895M3[t] -0.301630434782611M4[t] -0.224487577639753M5[t] -0.485714285714286M6[t] -0.395714285714287M7[t] -0.094285714285716M8[t] -0.057142857142858M9[t] -0.0400000000000042M10[t] +  0.0271428571428547M11[t]  + e[t] \tabularnewline
\hline
\end{tabular}
%Source: https://freestatistics.org/blog/index.php?pk=33775&T=1

[TABLE]
[ROW][C]Multiple Linear Regression - Estimated Regression Equation[/C][/ROW]
[ROW][C]Suiker[t] =  +  100.608354037267 +  1.88858695652174Dummy[t] -0.375916149068327M1[t] -0.378773291925467M2[t] -0.397344720496895M3[t] -0.301630434782611M4[t] -0.224487577639753M5[t] -0.485714285714286M6[t] -0.395714285714287M7[t] -0.094285714285716M8[t] -0.057142857142858M9[t] -0.0400000000000042M10[t] +  0.0271428571428547M11[t]  + e[t][/C][/ROW]
[/TABLE]
Source: https://freestatistics.org/blog/index.php?pk=33775&T=1

Globally Unique Identifier (entire table): ba.freestatistics.org/blog/index.php?pk=33775&T=1

As an alternative you can also use a QR Code:  

The GUIDs for individual cells are displayed in the table below:

Multiple Linear Regression - Estimated Regression Equation
Suiker[t] = + 100.608354037267 + 1.88858695652174Dummy[t] -0.375916149068327M1[t] -0.378773291925467M2[t] -0.397344720496895M3[t] -0.301630434782611M4[t] -0.224487577639753M5[t] -0.485714285714286M6[t] -0.395714285714287M7[t] -0.094285714285716M8[t] -0.057142857142858M9[t] -0.0400000000000042M10[t] + 0.0271428571428547M11[t] + e[t]


Multiple Linear Regression - Ordinary Least Squares
VariableParameterS.D.T-STATH0: parameter = 02-tail p-value1-tail p-value
(Intercept)100.6083540372670.919321109.437700
Dummy1.888586956521740.5688013.32030.0014220.000711
M1-0.3759161490683271.105218-0.34010.7347640.367382
M2-0.3787732919254671.105218-0.34270.7328270.366413
M3-0.3973447204968951.105218-0.35950.7202750.360138
M4-0.3016304347826111.105218-0.27290.7857110.392855
M5-0.2244875776397531.105218-0.20310.8396250.419813
M6-0.4857142857142861.102227-0.44070.6607930.330397
M7-0.3957142857142871.102227-0.3590.7206510.360325
M8-0.0942857142857161.102227-0.08550.9320720.466036
M9-0.0571428571428581.102227-0.05180.9587990.4794
M10-0.04000000000000421.102227-0.03630.9711530.485576
M110.02714285714285471.1022270.02460.9804230.490211

\begin{tabular}{lllllllll}
\hline
Multiple Linear Regression - Ordinary Least Squares \tabularnewline
Variable & Parameter & S.D. & T-STATH0: parameter = 0 & 2-tail p-value & 1-tail p-value \tabularnewline
(Intercept) & 100.608354037267 & 0.919321 & 109.4377 & 0 & 0 \tabularnewline
Dummy & 1.88858695652174 & 0.568801 & 3.3203 & 0.001422 & 0.000711 \tabularnewline
M1 & -0.375916149068327 & 1.105218 & -0.3401 & 0.734764 & 0.367382 \tabularnewline
M2 & -0.378773291925467 & 1.105218 & -0.3427 & 0.732827 & 0.366413 \tabularnewline
M3 & -0.397344720496895 & 1.105218 & -0.3595 & 0.720275 & 0.360138 \tabularnewline
M4 & -0.301630434782611 & 1.105218 & -0.2729 & 0.785711 & 0.392855 \tabularnewline
M5 & -0.224487577639753 & 1.105218 & -0.2031 & 0.839625 & 0.419813 \tabularnewline
M6 & -0.485714285714286 & 1.102227 & -0.4407 & 0.660793 & 0.330397 \tabularnewline
M7 & -0.395714285714287 & 1.102227 & -0.359 & 0.720651 & 0.360325 \tabularnewline
M8 & -0.094285714285716 & 1.102227 & -0.0855 & 0.932072 & 0.466036 \tabularnewline
M9 & -0.057142857142858 & 1.102227 & -0.0518 & 0.958799 & 0.4794 \tabularnewline
M10 & -0.0400000000000042 & 1.102227 & -0.0363 & 0.971153 & 0.485576 \tabularnewline
M11 & 0.0271428571428547 & 1.102227 & 0.0246 & 0.980423 & 0.490211 \tabularnewline
\hline
\end{tabular}
%Source: https://freestatistics.org/blog/index.php?pk=33775&T=2

[TABLE]
[ROW][C]Multiple Linear Regression - Ordinary Least Squares[/C][/ROW]
[ROW][C]Variable[/C][C]Parameter[/C][C]S.D.[/C][C]T-STATH0: parameter = 0[/C][C]2-tail p-value[/C][C]1-tail p-value[/C][/ROW]
[ROW][C](Intercept)[/C][C]100.608354037267[/C][C]0.919321[/C][C]109.4377[/C][C]0[/C][C]0[/C][/ROW]
[ROW][C]Dummy[/C][C]1.88858695652174[/C][C]0.568801[/C][C]3.3203[/C][C]0.001422[/C][C]0.000711[/C][/ROW]
[ROW][C]M1[/C][C]-0.375916149068327[/C][C]1.105218[/C][C]-0.3401[/C][C]0.734764[/C][C]0.367382[/C][/ROW]
[ROW][C]M2[/C][C]-0.378773291925467[/C][C]1.105218[/C][C]-0.3427[/C][C]0.732827[/C][C]0.366413[/C][/ROW]
[ROW][C]M3[/C][C]-0.397344720496895[/C][C]1.105218[/C][C]-0.3595[/C][C]0.720275[/C][C]0.360138[/C][/ROW]
[ROW][C]M4[/C][C]-0.301630434782611[/C][C]1.105218[/C][C]-0.2729[/C][C]0.785711[/C][C]0.392855[/C][/ROW]
[ROW][C]M5[/C][C]-0.224487577639753[/C][C]1.105218[/C][C]-0.2031[/C][C]0.839625[/C][C]0.419813[/C][/ROW]
[ROW][C]M6[/C][C]-0.485714285714286[/C][C]1.102227[/C][C]-0.4407[/C][C]0.660793[/C][C]0.330397[/C][/ROW]
[ROW][C]M7[/C][C]-0.395714285714287[/C][C]1.102227[/C][C]-0.359[/C][C]0.720651[/C][C]0.360325[/C][/ROW]
[ROW][C]M8[/C][C]-0.094285714285716[/C][C]1.102227[/C][C]-0.0855[/C][C]0.932072[/C][C]0.466036[/C][/ROW]
[ROW][C]M9[/C][C]-0.057142857142858[/C][C]1.102227[/C][C]-0.0518[/C][C]0.958799[/C][C]0.4794[/C][/ROW]
[ROW][C]M10[/C][C]-0.0400000000000042[/C][C]1.102227[/C][C]-0.0363[/C][C]0.971153[/C][C]0.485576[/C][/ROW]
[ROW][C]M11[/C][C]0.0271428571428547[/C][C]1.102227[/C][C]0.0246[/C][C]0.980423[/C][C]0.490211[/C][/ROW]
[/TABLE]
Source: https://freestatistics.org/blog/index.php?pk=33775&T=2

Globally Unique Identifier (entire table): ba.freestatistics.org/blog/index.php?pk=33775&T=2

As an alternative you can also use a QR Code:  

The GUIDs for individual cells are displayed in the table below:

Multiple Linear Regression - Ordinary Least Squares
VariableParameterS.D.T-STATH0: parameter = 02-tail p-value1-tail p-value
(Intercept)100.6083540372670.919321109.437700
Dummy1.888586956521740.5688013.32030.0014220.000711
M1-0.3759161490683271.105218-0.34010.7347640.367382
M2-0.3787732919254671.105218-0.34270.7328270.366413
M3-0.3973447204968951.105218-0.35950.7202750.360138
M4-0.3016304347826111.105218-0.27290.7857110.392855
M5-0.2244875776397531.105218-0.20310.8396250.419813
M6-0.4857142857142861.102227-0.44070.6607930.330397
M7-0.3957142857142871.102227-0.3590.7206510.360325
M8-0.0942857142857161.102227-0.08550.9320720.466036
M9-0.0571428571428581.102227-0.05180.9587990.4794
M10-0.04000000000000421.102227-0.03630.9711530.485576
M110.02714285714285471.1022270.02460.9804230.490211


Multiple Linear Regression - Regression Statistics
Multiple R0.386516860213904
R-squared0.149395283229615
Adjusted R-squared0.00563110574729608
F-TEST (value)1.03916904646144
F-TEST (DF numerator)12
F-TEST (DF denominator)71
p-value0.423929093603734
Multiple Linear Regression - Residual Statistics
Residual Standard Deviation2.06207823139742
Sum Squared Residuals301.903830900621

\begin{tabular}{lllllllll}
\hline
Multiple Linear Regression - Regression Statistics \tabularnewline
Multiple R & 0.386516860213904 \tabularnewline
R-squared & 0.149395283229615 \tabularnewline
Adjusted R-squared & 0.00563110574729608 \tabularnewline
F-TEST (value) & 1.03916904646144 \tabularnewline
F-TEST (DF numerator) & 12 \tabularnewline
F-TEST (DF denominator) & 71 \tabularnewline
p-value & 0.423929093603734 \tabularnewline
Multiple Linear Regression - Residual Statistics \tabularnewline
Residual Standard Deviation & 2.06207823139742 \tabularnewline
Sum Squared Residuals & 301.903830900621 \tabularnewline
\hline
\end{tabular}
%Source: https://freestatistics.org/blog/index.php?pk=33775&T=3

[TABLE]
[ROW][C]Multiple Linear Regression - Regression Statistics[/C][/ROW]
[ROW][C]Multiple R[/C][C]0.386516860213904[/C][/ROW]
[ROW][C]R-squared[/C][C]0.149395283229615[/C][/ROW]
[ROW][C]Adjusted R-squared[/C][C]0.00563110574729608[/C][/ROW]
[ROW][C]F-TEST (value)[/C][C]1.03916904646144[/C][/ROW]
[ROW][C]F-TEST (DF numerator)[/C][C]12[/C][/ROW]
[ROW][C]F-TEST (DF denominator)[/C][C]71[/C][/ROW]
[ROW][C]p-value[/C][C]0.423929093603734[/C][/ROW]
[ROW][C]Multiple Linear Regression - Residual Statistics[/C][/ROW]
[ROW][C]Residual Standard Deviation[/C][C]2.06207823139742[/C][/ROW]
[ROW][C]Sum Squared Residuals[/C][C]301.903830900621[/C][/ROW]
[/TABLE]
Source: https://freestatistics.org/blog/index.php?pk=33775&T=3

Globally Unique Identifier (entire table): ba.freestatistics.org/blog/index.php?pk=33775&T=3

As an alternative you can also use a QR Code:  

The GUIDs for individual cells are displayed in the table below:

Multiple Linear Regression - Regression Statistics
Multiple R0.386516860213904
R-squared0.149395283229615
Adjusted R-squared0.00563110574729608
F-TEST (value)1.03916904646144
F-TEST (DF numerator)12
F-TEST (DF denominator)71
p-value0.423929093603734
Multiple Linear Regression - Residual Statistics
Residual Standard Deviation2.06207823139742
Sum Squared Residuals301.903830900621


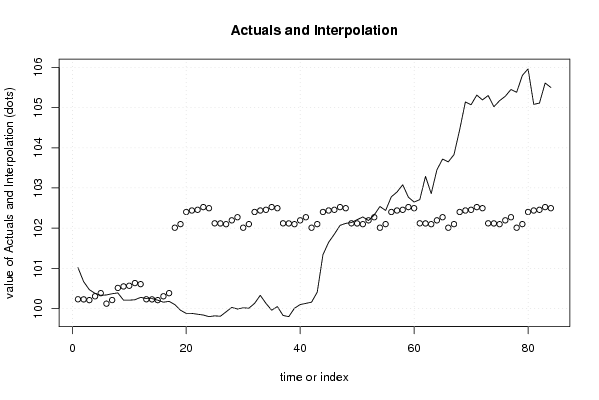
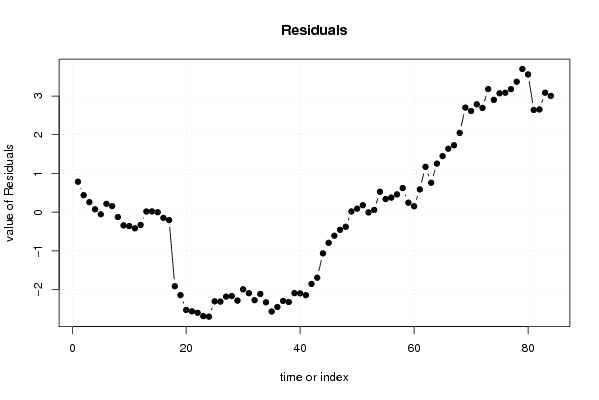
Multiple Linear Regression - Actuals, Interpolation, and Residuals
Time or IndexActualsInterpolationForecastResidualsPrediction Error
1101.02100.2324378881990.78756211180124
2100.67100.2295807453420.440419254658389
3100.47100.2110093167700.258990683229812
4100.38100.3067236024840.0732763975155254
5100.33100.383866459627-0.0538664596273305
6100.34100.1226397515530.217360248447209
7100.37100.2126397515530.157360248447210
8100.39100.514068322981-0.124068322981365
9100.21100.551211180124-0.34121118012423
10100.21100.568354037267-0.358354037267083
11100.22100.63549689441-0.415496894409937
12100.28100.608354037267-0.32835403726708
13100.25100.2324378881990.0175621118012452
14100.25100.2295807453420.0204192546583849
15100.21100.211009316770-0.00100931677019287
16100.16100.306723602484-0.146723602484474
17100.18100.383866459627-0.203866459627322
18100.1102.011226708075-1.91122670807454
1999.96102.101226708075-2.14122670807454
2099.88102.402655279503-2.52265527950311
2199.88102.439798136646-2.55979813664597
2299.86102.456940993789-2.59694099378882
2399.84102.524083850932-2.68408385093167
2499.8102.496940993789-2.69694099378882
2599.82102.121024844720-2.3010248447205
2699.81102.118167701863-2.30816770186335
2799.92102.099596273292-2.17959627329192
28100.03102.195310559006-2.16531055900621
2999.99102.272453416149-2.28245341614907
30100.02102.011226708075-1.99122670807454
31100.01102.101226708075-2.09122670807453
32100.13102.402655279503-2.27265527950311
33100.33102.439798136646-2.10979813664596
34100.13102.456940993789-2.32694099378882
3599.96102.524083850932-2.56408385093168
36100.05102.496940993789-2.44694099378882
3799.83102.121024844720-2.29102484472050
3899.8102.118167701863-2.31816770186336
39100.01102.099596273292-2.08959627329192
40100.1102.195310559006-2.09531055900622
41100.13102.272453416149-2.14245341614907
42100.16102.011226708075-1.85122670807454
43100.41102.101226708075-1.69122670807454
44101.34102.402655279503-1.06265527950310
45101.65102.439798136646-0.789798136645957
46101.85102.456940993789-0.606940993788822
47102.07102.524083850932-0.454083850931682
48102.12102.496940993789-0.376940993788816
49102.14102.1210248447200.0189751552795068
50102.21102.1181677018630.0918322981366395
51102.28102.0995962732920.180403726708076
52102.19102.195310559006-0.00531055900621216
53102.33102.2724534161490.0575465838509306
54102.54102.0112267080750.528773291925472
55102.44102.1012267080750.338773291925465
56102.78102.4026552795030.377344720496897
57102.9102.4397981366460.460201863354043
58103.08102.4569409937890.623059006211182
59102.77102.5240838509320.245916149068321
60102.65102.4969409937890.153059006211185
61102.71102.1210248447200.5889751552795
62103.29102.1181677018631.17183229813665
63102.86102.0995962732920.760403726708074
64103.45102.1953105590061.25468944099379
65103.72102.2724534161491.44754658385093
66103.65102.0112267080751.63877329192547
67103.83102.1012267080751.72877329192547
68104.45102.4026552795032.0473447204969
69105.14102.4397981366462.70020186335404
70105.07102.4569409937892.61305900621118
71105.31102.5240838509322.78591614906833
72105.19102.4969409937892.69305900621118
73105.3102.1210248447203.17897515527950
74105.02102.1181677018632.90183229813664
75105.17102.0995962732923.07040372670808
76105.28102.1953105590063.08468944099379
77105.45102.2724534161493.17754658385094
78105.38102.0112267080753.36877329192546
79105.8102.1012267080753.69877329192546
80105.96102.4026552795033.55734472049689
81105.08102.4397981366462.64020186335404
82105.11102.4569409937892.65305900621118
83105.61102.5240838509323.08591614906832
84105.5102.4969409937893.00305900621118

\begin{tabular}{lllllllll}
\hline
Multiple Linear Regression - Actuals, Interpolation, and Residuals \tabularnewline
Time or Index & Actuals & InterpolationForecast & ResidualsPrediction Error \tabularnewline
1 & 101.02 & 100.232437888199 & 0.78756211180124 \tabularnewline
2 & 100.67 & 100.229580745342 & 0.440419254658389 \tabularnewline
3 & 100.47 & 100.211009316770 & 0.258990683229812 \tabularnewline
4 & 100.38 & 100.306723602484 & 0.0732763975155254 \tabularnewline
5 & 100.33 & 100.383866459627 & -0.0538664596273305 \tabularnewline
6 & 100.34 & 100.122639751553 & 0.217360248447209 \tabularnewline
7 & 100.37 & 100.212639751553 & 0.157360248447210 \tabularnewline
8 & 100.39 & 100.514068322981 & -0.124068322981365 \tabularnewline
9 & 100.21 & 100.551211180124 & -0.34121118012423 \tabularnewline
10 & 100.21 & 100.568354037267 & -0.358354037267083 \tabularnewline
11 & 100.22 & 100.63549689441 & -0.415496894409937 \tabularnewline
12 & 100.28 & 100.608354037267 & -0.32835403726708 \tabularnewline
13 & 100.25 & 100.232437888199 & 0.0175621118012452 \tabularnewline
14 & 100.25 & 100.229580745342 & 0.0204192546583849 \tabularnewline
15 & 100.21 & 100.211009316770 & -0.00100931677019287 \tabularnewline
16 & 100.16 & 100.306723602484 & -0.146723602484474 \tabularnewline
17 & 100.18 & 100.383866459627 & -0.203866459627322 \tabularnewline
18 & 100.1 & 102.011226708075 & -1.91122670807454 \tabularnewline
19 & 99.96 & 102.101226708075 & -2.14122670807454 \tabularnewline
20 & 99.88 & 102.402655279503 & -2.52265527950311 \tabularnewline
21 & 99.88 & 102.439798136646 & -2.55979813664597 \tabularnewline
22 & 99.86 & 102.456940993789 & -2.59694099378882 \tabularnewline
23 & 99.84 & 102.524083850932 & -2.68408385093167 \tabularnewline
24 & 99.8 & 102.496940993789 & -2.69694099378882 \tabularnewline
25 & 99.82 & 102.121024844720 & -2.3010248447205 \tabularnewline
26 & 99.81 & 102.118167701863 & -2.30816770186335 \tabularnewline
27 & 99.92 & 102.099596273292 & -2.17959627329192 \tabularnewline
28 & 100.03 & 102.195310559006 & -2.16531055900621 \tabularnewline
29 & 99.99 & 102.272453416149 & -2.28245341614907 \tabularnewline
30 & 100.02 & 102.011226708075 & -1.99122670807454 \tabularnewline
31 & 100.01 & 102.101226708075 & -2.09122670807453 \tabularnewline
32 & 100.13 & 102.402655279503 & -2.27265527950311 \tabularnewline
33 & 100.33 & 102.439798136646 & -2.10979813664596 \tabularnewline
34 & 100.13 & 102.456940993789 & -2.32694099378882 \tabularnewline
35 & 99.96 & 102.524083850932 & -2.56408385093168 \tabularnewline
36 & 100.05 & 102.496940993789 & -2.44694099378882 \tabularnewline
37 & 99.83 & 102.121024844720 & -2.29102484472050 \tabularnewline
38 & 99.8 & 102.118167701863 & -2.31816770186336 \tabularnewline
39 & 100.01 & 102.099596273292 & -2.08959627329192 \tabularnewline
40 & 100.1 & 102.195310559006 & -2.09531055900622 \tabularnewline
41 & 100.13 & 102.272453416149 & -2.14245341614907 \tabularnewline
42 & 100.16 & 102.011226708075 & -1.85122670807454 \tabularnewline
43 & 100.41 & 102.101226708075 & -1.69122670807454 \tabularnewline
44 & 101.34 & 102.402655279503 & -1.06265527950310 \tabularnewline
45 & 101.65 & 102.439798136646 & -0.789798136645957 \tabularnewline
46 & 101.85 & 102.456940993789 & -0.606940993788822 \tabularnewline
47 & 102.07 & 102.524083850932 & -0.454083850931682 \tabularnewline
48 & 102.12 & 102.496940993789 & -0.376940993788816 \tabularnewline
49 & 102.14 & 102.121024844720 & 0.0189751552795068 \tabularnewline
50 & 102.21 & 102.118167701863 & 0.0918322981366395 \tabularnewline
51 & 102.28 & 102.099596273292 & 0.180403726708076 \tabularnewline
52 & 102.19 & 102.195310559006 & -0.00531055900621216 \tabularnewline
53 & 102.33 & 102.272453416149 & 0.0575465838509306 \tabularnewline
54 & 102.54 & 102.011226708075 & 0.528773291925472 \tabularnewline
55 & 102.44 & 102.101226708075 & 0.338773291925465 \tabularnewline
56 & 102.78 & 102.402655279503 & 0.377344720496897 \tabularnewline
57 & 102.9 & 102.439798136646 & 0.460201863354043 \tabularnewline
58 & 103.08 & 102.456940993789 & 0.623059006211182 \tabularnewline
59 & 102.77 & 102.524083850932 & 0.245916149068321 \tabularnewline
60 & 102.65 & 102.496940993789 & 0.153059006211185 \tabularnewline
61 & 102.71 & 102.121024844720 & 0.5889751552795 \tabularnewline
62 & 103.29 & 102.118167701863 & 1.17183229813665 \tabularnewline
63 & 102.86 & 102.099596273292 & 0.760403726708074 \tabularnewline
64 & 103.45 & 102.195310559006 & 1.25468944099379 \tabularnewline
65 & 103.72 & 102.272453416149 & 1.44754658385093 \tabularnewline
66 & 103.65 & 102.011226708075 & 1.63877329192547 \tabularnewline
67 & 103.83 & 102.101226708075 & 1.72877329192547 \tabularnewline
68 & 104.45 & 102.402655279503 & 2.0473447204969 \tabularnewline
69 & 105.14 & 102.439798136646 & 2.70020186335404 \tabularnewline
70 & 105.07 & 102.456940993789 & 2.61305900621118 \tabularnewline
71 & 105.31 & 102.524083850932 & 2.78591614906833 \tabularnewline
72 & 105.19 & 102.496940993789 & 2.69305900621118 \tabularnewline
73 & 105.3 & 102.121024844720 & 3.17897515527950 \tabularnewline
74 & 105.02 & 102.118167701863 & 2.90183229813664 \tabularnewline
75 & 105.17 & 102.099596273292 & 3.07040372670808 \tabularnewline
76 & 105.28 & 102.195310559006 & 3.08468944099379 \tabularnewline
77 & 105.45 & 102.272453416149 & 3.17754658385094 \tabularnewline
78 & 105.38 & 102.011226708075 & 3.36877329192546 \tabularnewline
79 & 105.8 & 102.101226708075 & 3.69877329192546 \tabularnewline
80 & 105.96 & 102.402655279503 & 3.55734472049689 \tabularnewline
81 & 105.08 & 102.439798136646 & 2.64020186335404 \tabularnewline
82 & 105.11 & 102.456940993789 & 2.65305900621118 \tabularnewline
83 & 105.61 & 102.524083850932 & 3.08591614906832 \tabularnewline
84 & 105.5 & 102.496940993789 & 3.00305900621118 \tabularnewline
\hline
\end{tabular}
%Source: https://freestatistics.org/blog/index.php?pk=33775&T=4

[TABLE]
[ROW][C]Multiple Linear Regression - Actuals, Interpolation, and Residuals[/C][/ROW]
[ROW][C]Time or Index[/C][C]Actuals[/C][C]InterpolationForecast[/C][C]ResidualsPrediction Error[/C][/ROW]
[ROW][C]1[/C][C]101.02[/C][C]100.232437888199[/C][C]0.78756211180124[/C][/ROW]
[ROW][C]2[/C][C]100.67[/C][C]100.229580745342[/C][C]0.440419254658389[/C][/ROW]
[ROW][C]3[/C][C]100.47[/C][C]100.211009316770[/C][C]0.258990683229812[/C][/ROW]
[ROW][C]4[/C][C]100.38[/C][C]100.306723602484[/C][C]0.0732763975155254[/C][/ROW]
[ROW][C]5[/C][C]100.33[/C][C]100.383866459627[/C][C]-0.0538664596273305[/C][/ROW]
[ROW][C]6[/C][C]100.34[/C][C]100.122639751553[/C][C]0.217360248447209[/C][/ROW]
[ROW][C]7[/C][C]100.37[/C][C]100.212639751553[/C][C]0.157360248447210[/C][/ROW]
[ROW][C]8[/C][C]100.39[/C][C]100.514068322981[/C][C]-0.124068322981365[/C][/ROW]
[ROW][C]9[/C][C]100.21[/C][C]100.551211180124[/C][C]-0.34121118012423[/C][/ROW]
[ROW][C]10[/C][C]100.21[/C][C]100.568354037267[/C][C]-0.358354037267083[/C][/ROW]
[ROW][C]11[/C][C]100.22[/C][C]100.63549689441[/C][C]-0.415496894409937[/C][/ROW]
[ROW][C]12[/C][C]100.28[/C][C]100.608354037267[/C][C]-0.32835403726708[/C][/ROW]
[ROW][C]13[/C][C]100.25[/C][C]100.232437888199[/C][C]0.0175621118012452[/C][/ROW]
[ROW][C]14[/C][C]100.25[/C][C]100.229580745342[/C][C]0.0204192546583849[/C][/ROW]
[ROW][C]15[/C][C]100.21[/C][C]100.211009316770[/C][C]-0.00100931677019287[/C][/ROW]
[ROW][C]16[/C][C]100.16[/C][C]100.306723602484[/C][C]-0.146723602484474[/C][/ROW]
[ROW][C]17[/C][C]100.18[/C][C]100.383866459627[/C][C]-0.203866459627322[/C][/ROW]
[ROW][C]18[/C][C]100.1[/C][C]102.011226708075[/C][C]-1.91122670807454[/C][/ROW]
[ROW][C]19[/C][C]99.96[/C][C]102.101226708075[/C][C]-2.14122670807454[/C][/ROW]
[ROW][C]20[/C][C]99.88[/C][C]102.402655279503[/C][C]-2.52265527950311[/C][/ROW]
[ROW][C]21[/C][C]99.88[/C][C]102.439798136646[/C][C]-2.55979813664597[/C][/ROW]
[ROW][C]22[/C][C]99.86[/C][C]102.456940993789[/C][C]-2.59694099378882[/C][/ROW]
[ROW][C]23[/C][C]99.84[/C][C]102.524083850932[/C][C]-2.68408385093167[/C][/ROW]
[ROW][C]24[/C][C]99.8[/C][C]102.496940993789[/C][C]-2.69694099378882[/C][/ROW]
[ROW][C]25[/C][C]99.82[/C][C]102.121024844720[/C][C]-2.3010248447205[/C][/ROW]
[ROW][C]26[/C][C]99.81[/C][C]102.118167701863[/C][C]-2.30816770186335[/C][/ROW]
[ROW][C]27[/C][C]99.92[/C][C]102.099596273292[/C][C]-2.17959627329192[/C][/ROW]
[ROW][C]28[/C][C]100.03[/C][C]102.195310559006[/C][C]-2.16531055900621[/C][/ROW]
[ROW][C]29[/C][C]99.99[/C][C]102.272453416149[/C][C]-2.28245341614907[/C][/ROW]
[ROW][C]30[/C][C]100.02[/C][C]102.011226708075[/C][C]-1.99122670807454[/C][/ROW]
[ROW][C]31[/C][C]100.01[/C][C]102.101226708075[/C][C]-2.09122670807453[/C][/ROW]
[ROW][C]32[/C][C]100.13[/C][C]102.402655279503[/C][C]-2.27265527950311[/C][/ROW]
[ROW][C]33[/C][C]100.33[/C][C]102.439798136646[/C][C]-2.10979813664596[/C][/ROW]
[ROW][C]34[/C][C]100.13[/C][C]102.456940993789[/C][C]-2.32694099378882[/C][/ROW]
[ROW][C]35[/C][C]99.96[/C][C]102.524083850932[/C][C]-2.56408385093168[/C][/ROW]
[ROW][C]36[/C][C]100.05[/C][C]102.496940993789[/C][C]-2.44694099378882[/C][/ROW]
[ROW][C]37[/C][C]99.83[/C][C]102.121024844720[/C][C]-2.29102484472050[/C][/ROW]
[ROW][C]38[/C][C]99.8[/C][C]102.118167701863[/C][C]-2.31816770186336[/C][/ROW]
[ROW][C]39[/C][C]100.01[/C][C]102.099596273292[/C][C]-2.08959627329192[/C][/ROW]
[ROW][C]40[/C][C]100.1[/C][C]102.195310559006[/C][C]-2.09531055900622[/C][/ROW]
[ROW][C]41[/C][C]100.13[/C][C]102.272453416149[/C][C]-2.14245341614907[/C][/ROW]
[ROW][C]42[/C][C]100.16[/C][C]102.011226708075[/C][C]-1.85122670807454[/C][/ROW]
[ROW][C]43[/C][C]100.41[/C][C]102.101226708075[/C][C]-1.69122670807454[/C][/ROW]
[ROW][C]44[/C][C]101.34[/C][C]102.402655279503[/C][C]-1.06265527950310[/C][/ROW]
[ROW][C]45[/C][C]101.65[/C][C]102.439798136646[/C][C]-0.789798136645957[/C][/ROW]
[ROW][C]46[/C][C]101.85[/C][C]102.456940993789[/C][C]-0.606940993788822[/C][/ROW]
[ROW][C]47[/C][C]102.07[/C][C]102.524083850932[/C][C]-0.454083850931682[/C][/ROW]
[ROW][C]48[/C][C]102.12[/C][C]102.496940993789[/C][C]-0.376940993788816[/C][/ROW]
[ROW][C]49[/C][C]102.14[/C][C]102.121024844720[/C][C]0.0189751552795068[/C][/ROW]
[ROW][C]50[/C][C]102.21[/C][C]102.118167701863[/C][C]0.0918322981366395[/C][/ROW]
[ROW][C]51[/C][C]102.28[/C][C]102.099596273292[/C][C]0.180403726708076[/C][/ROW]
[ROW][C]52[/C][C]102.19[/C][C]102.195310559006[/C][C]-0.00531055900621216[/C][/ROW]
[ROW][C]53[/C][C]102.33[/C][C]102.272453416149[/C][C]0.0575465838509306[/C][/ROW]
[ROW][C]54[/C][C]102.54[/C][C]102.011226708075[/C][C]0.528773291925472[/C][/ROW]
[ROW][C]55[/C][C]102.44[/C][C]102.101226708075[/C][C]0.338773291925465[/C][/ROW]
[ROW][C]56[/C][C]102.78[/C][C]102.402655279503[/C][C]0.377344720496897[/C][/ROW]
[ROW][C]57[/C][C]102.9[/C][C]102.439798136646[/C][C]0.460201863354043[/C][/ROW]
[ROW][C]58[/C][C]103.08[/C][C]102.456940993789[/C][C]0.623059006211182[/C][/ROW]
[ROW][C]59[/C][C]102.77[/C][C]102.524083850932[/C][C]0.245916149068321[/C][/ROW]
[ROW][C]60[/C][C]102.65[/C][C]102.496940993789[/C][C]0.153059006211185[/C][/ROW]
[ROW][C]61[/C][C]102.71[/C][C]102.121024844720[/C][C]0.5889751552795[/C][/ROW]
[ROW][C]62[/C][C]103.29[/C][C]102.118167701863[/C][C]1.17183229813665[/C][/ROW]
[ROW][C]63[/C][C]102.86[/C][C]102.099596273292[/C][C]0.760403726708074[/C][/ROW]
[ROW][C]64[/C][C]103.45[/C][C]102.195310559006[/C][C]1.25468944099379[/C][/ROW]
[ROW][C]65[/C][C]103.72[/C][C]102.272453416149[/C][C]1.44754658385093[/C][/ROW]
[ROW][C]66[/C][C]103.65[/C][C]102.011226708075[/C][C]1.63877329192547[/C][/ROW]
[ROW][C]67[/C][C]103.83[/C][C]102.101226708075[/C][C]1.72877329192547[/C][/ROW]
[ROW][C]68[/C][C]104.45[/C][C]102.402655279503[/C][C]2.0473447204969[/C][/ROW]
[ROW][C]69[/C][C]105.14[/C][C]102.439798136646[/C][C]2.70020186335404[/C][/ROW]
[ROW][C]70[/C][C]105.07[/C][C]102.456940993789[/C][C]2.61305900621118[/C][/ROW]
[ROW][C]71[/C][C]105.31[/C][C]102.524083850932[/C][C]2.78591614906833[/C][/ROW]
[ROW][C]72[/C][C]105.19[/C][C]102.496940993789[/C][C]2.69305900621118[/C][/ROW]
[ROW][C]73[/C][C]105.3[/C][C]102.121024844720[/C][C]3.17897515527950[/C][/ROW]
[ROW][C]74[/C][C]105.02[/C][C]102.118167701863[/C][C]2.90183229813664[/C][/ROW]
[ROW][C]75[/C][C]105.17[/C][C]102.099596273292[/C][C]3.07040372670808[/C][/ROW]
[ROW][C]76[/C][C]105.28[/C][C]102.195310559006[/C][C]3.08468944099379[/C][/ROW]
[ROW][C]77[/C][C]105.45[/C][C]102.272453416149[/C][C]3.17754658385094[/C][/ROW]
[ROW][C]78[/C][C]105.38[/C][C]102.011226708075[/C][C]3.36877329192546[/C][/ROW]
[ROW][C]79[/C][C]105.8[/C][C]102.101226708075[/C][C]3.69877329192546[/C][/ROW]
[ROW][C]80[/C][C]105.96[/C][C]102.402655279503[/C][C]3.55734472049689[/C][/ROW]
[ROW][C]81[/C][C]105.08[/C][C]102.439798136646[/C][C]2.64020186335404[/C][/ROW]
[ROW][C]82[/C][C]105.11[/C][C]102.456940993789[/C][C]2.65305900621118[/C][/ROW]
[ROW][C]83[/C][C]105.61[/C][C]102.524083850932[/C][C]3.08591614906832[/C][/ROW]
[ROW][C]84[/C][C]105.5[/C][C]102.496940993789[/C][C]3.00305900621118[/C][/ROW]
[/TABLE]
Source: https://freestatistics.org/blog/index.php?pk=33775&T=4

Globally Unique Identifier (entire table): ba.freestatistics.org/blog/index.php?pk=33775&T=4

As an alternative you can also use a QR Code:  

The GUIDs for individual cells are displayed in the table below:

Multiple Linear Regression - Actuals, Interpolation, and Residuals
Time or IndexActualsInterpolationForecastResidualsPrediction Error
1101.02100.2324378881990.78756211180124
2100.67100.2295807453420.440419254658389
3100.47100.2110093167700.258990683229812
4100.38100.3067236024840.0732763975155254
5100.33100.383866459627-0.0538664596273305
6100.34100.1226397515530.217360248447209
7100.37100.2126397515530.157360248447210
8100.39100.514068322981-0.124068322981365
9100.21100.551211180124-0.34121118012423
10100.21100.568354037267-0.358354037267083
11100.22100.63549689441-0.415496894409937
12100.28100.608354037267-0.32835403726708
13100.25100.2324378881990.0175621118012452
14100.25100.2295807453420.0204192546583849
15100.21100.211009316770-0.00100931677019287
16100.16100.306723602484-0.146723602484474
17100.18100.383866459627-0.203866459627322
18100.1102.011226708075-1.91122670807454
1999.96102.101226708075-2.14122670807454
2099.88102.402655279503-2.52265527950311
2199.88102.439798136646-2.55979813664597
2299.86102.456940993789-2.59694099378882
2399.84102.524083850932-2.68408385093167
2499.8102.496940993789-2.69694099378882
2599.82102.121024844720-2.3010248447205
2699.81102.118167701863-2.30816770186335
2799.92102.099596273292-2.17959627329192
28100.03102.195310559006-2.16531055900621
2999.99102.272453416149-2.28245341614907
30100.02102.011226708075-1.99122670807454
31100.01102.101226708075-2.09122670807453
32100.13102.402655279503-2.27265527950311
33100.33102.439798136646-2.10979813664596
34100.13102.456940993789-2.32694099378882
3599.96102.524083850932-2.56408385093168
36100.05102.496940993789-2.44694099378882
3799.83102.121024844720-2.29102484472050
3899.8102.118167701863-2.31816770186336
39100.01102.099596273292-2.08959627329192
40100.1102.195310559006-2.09531055900622
41100.13102.272453416149-2.14245341614907
42100.16102.011226708075-1.85122670807454
43100.41102.101226708075-1.69122670807454
44101.34102.402655279503-1.06265527950310
45101.65102.439798136646-0.789798136645957
46101.85102.456940993789-0.606940993788822
47102.07102.524083850932-0.454083850931682
48102.12102.496940993789-0.376940993788816
49102.14102.1210248447200.0189751552795068
50102.21102.1181677018630.0918322981366395
51102.28102.0995962732920.180403726708076
52102.19102.195310559006-0.00531055900621216
53102.33102.2724534161490.0575465838509306
54102.54102.0112267080750.528773291925472
55102.44102.1012267080750.338773291925465
56102.78102.4026552795030.377344720496897
57102.9102.4397981366460.460201863354043
58103.08102.4569409937890.623059006211182
59102.77102.5240838509320.245916149068321
60102.65102.4969409937890.153059006211185
61102.71102.1210248447200.5889751552795
62103.29102.1181677018631.17183229813665
63102.86102.0995962732920.760403726708074
64103.45102.1953105590061.25468944099379
65103.72102.2724534161491.44754658385093
66103.65102.0112267080751.63877329192547
67103.83102.1012267080751.72877329192547
68104.45102.4026552795032.0473447204969
69105.14102.4397981366462.70020186335404
70105.07102.4569409937892.61305900621118
71105.31102.5240838509322.78591614906833
72105.19102.4969409937892.69305900621118
73105.3102.1210248447203.17897515527950
74105.02102.1181677018632.90183229813664
75105.17102.0995962732923.07040372670808
76105.28102.1953105590063.08468944099379
77105.45102.2724534161493.17754658385094
78105.38102.0112267080753.36877329192546
79105.8102.1012267080753.69877329192546
80105.96102.4026552795033.55734472049689
81105.08102.4397981366462.64020186335404
82105.11102.4569409937892.65305900621118
83105.61102.5240838509323.08591614906832
84105.5102.4969409937893.00305900621118


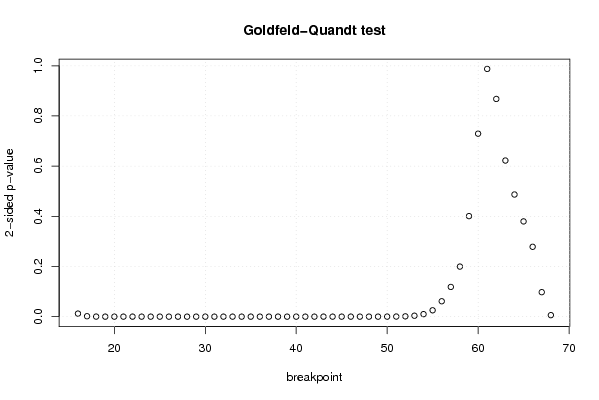
Goldfeld-Quandt test for Heteroskedasticity
p-valuesAlternative Hypothesis
breakpoint indexgreater2-sidedless
160.006073369858257710.01214673971651540.993926630141742
170.0008402221991335330.001680444398267070.999159777800867
180.0001041325677051470.0002082651354102950.999895867432295
191.26654166229175e-052.53308332458351e-050.999987334583377
201.56166698075822e-063.12333396151645e-060.99999843833302
211.74593420198650e-073.49186840397301e-070.99999982540658
221.88535028623126e-083.77070057246251e-080.999999981146497
232.00985251341664e-094.01970502683328e-090.999999997990147
242.23930211638380e-104.47860423276761e-100.99999999977607
256.87829496969717e-111.37565899393943e-100.999999999931217
269.16440083811127e-121.83288016762225e-110.999999999990836
279.74142818817262e-131.94828563763452e-120.999999999999026
281.48103815054379e-132.96207630108759e-130.999999999999852
292.04876796536312e-144.09753593072625e-140.99999999999998
302.24363956995947e-154.48727913991893e-150.999999999999998
312.64072137605473e-165.28144275210947e-161
325.0087616319517e-171.00175232639034e-161
335.05509968002994e-171.01101993600599e-161
341.60610882935221e-173.21221765870442e-171
353.72125714147942e-187.44251428295884e-181
361.09277940449768e-182.18555880899537e-181
374.53360548298327e-199.06721096596654e-191
381.50059937679000e-193.00119875358001e-191
393.76622360725320e-207.53244721450641e-201
401.41111228206874e-202.82222456413749e-201
418.27291189943653e-211.65458237988731e-201
424.54569132588485e-219.0913826517697e-211
431.31630687039876e-202.63261374079753e-201
442.75925241125943e-165.51850482251886e-161
456.39042594885341e-131.27808518977068e-120.99999999999936
463.01241398047231e-106.02482796094462e-100.999999999698759
474.8491020854336e-089.6982041708672e-080.99999995150898
481.40661129056626e-062.81322258113252e-060.99999859338871
499.65055820512167e-061.93011164102433e-050.999990349441795
505.62989147498452e-050.0001125978294996900.99994370108525
510.000204925279588510.000409850559177020.999795074720412
520.000616715617479910.001233431234959820.99938328438252
530.001859763561870410.003719527123740820.99814023643813
540.004995128833031160.009990257666062310.995004871166969
550.01269240908424150.02538481816848310.987307590915758
560.03070303939055140.06140607878110280.969296960609449
570.05919221676911390.1183844335382280.940807783230886
580.099758853833610.199517707667220.90024114616639
590.2003552902685920.4007105805371850.799644709731408
600.3646505358950580.7293010717901170.635349464104942
610.5063644555957120.9872710888085760.493635544404288
620.5661350162205890.8677299675588220.433864983779411
630.6888802516700150.6222394966599690.311119748329985
640.756591516093740.4868169678125190.243408483906259
650.8101689861996160.3796620276007690.189831013800385
660.8607789894529880.2784420210940250.139221010547012
670.95122017388170.09755965223660150.0487798261183008
680.9970543993872780.005891201225444590.00294560061272230

\begin{tabular}{lllllllll}
\hline
Goldfeld-Quandt test for Heteroskedasticity \tabularnewline
p-values & Alternative Hypothesis \tabularnewline
breakpoint index & greater & 2-sided & less \tabularnewline
16 & 0.00607336985825771 & 0.0121467397165154 & 0.993926630141742 \tabularnewline
17 & 0.000840222199133533 & 0.00168044439826707 & 0.999159777800867 \tabularnewline
18 & 0.000104132567705147 & 0.000208265135410295 & 0.999895867432295 \tabularnewline
19 & 1.26654166229175e-05 & 2.53308332458351e-05 & 0.999987334583377 \tabularnewline
20 & 1.56166698075822e-06 & 3.12333396151645e-06 & 0.99999843833302 \tabularnewline
21 & 1.74593420198650e-07 & 3.49186840397301e-07 & 0.99999982540658 \tabularnewline
22 & 1.88535028623126e-08 & 3.77070057246251e-08 & 0.999999981146497 \tabularnewline
23 & 2.00985251341664e-09 & 4.01970502683328e-09 & 0.999999997990147 \tabularnewline
24 & 2.23930211638380e-10 & 4.47860423276761e-10 & 0.99999999977607 \tabularnewline
25 & 6.87829496969717e-11 & 1.37565899393943e-10 & 0.999999999931217 \tabularnewline
26 & 9.16440083811127e-12 & 1.83288016762225e-11 & 0.999999999990836 \tabularnewline
27 & 9.74142818817262e-13 & 1.94828563763452e-12 & 0.999999999999026 \tabularnewline
28 & 1.48103815054379e-13 & 2.96207630108759e-13 & 0.999999999999852 \tabularnewline
29 & 2.04876796536312e-14 & 4.09753593072625e-14 & 0.99999999999998 \tabularnewline
30 & 2.24363956995947e-15 & 4.48727913991893e-15 & 0.999999999999998 \tabularnewline
31 & 2.64072137605473e-16 & 5.28144275210947e-16 & 1 \tabularnewline
32 & 5.0087616319517e-17 & 1.00175232639034e-16 & 1 \tabularnewline
33 & 5.05509968002994e-17 & 1.01101993600599e-16 & 1 \tabularnewline
34 & 1.60610882935221e-17 & 3.21221765870442e-17 & 1 \tabularnewline
35 & 3.72125714147942e-18 & 7.44251428295884e-18 & 1 \tabularnewline
36 & 1.09277940449768e-18 & 2.18555880899537e-18 & 1 \tabularnewline
37 & 4.53360548298327e-19 & 9.06721096596654e-19 & 1 \tabularnewline
38 & 1.50059937679000e-19 & 3.00119875358001e-19 & 1 \tabularnewline
39 & 3.76622360725320e-20 & 7.53244721450641e-20 & 1 \tabularnewline
40 & 1.41111228206874e-20 & 2.82222456413749e-20 & 1 \tabularnewline
41 & 8.27291189943653e-21 & 1.65458237988731e-20 & 1 \tabularnewline
42 & 4.54569132588485e-21 & 9.0913826517697e-21 & 1 \tabularnewline
43 & 1.31630687039876e-20 & 2.63261374079753e-20 & 1 \tabularnewline
44 & 2.75925241125943e-16 & 5.51850482251886e-16 & 1 \tabularnewline
45 & 6.39042594885341e-13 & 1.27808518977068e-12 & 0.99999999999936 \tabularnewline
46 & 3.01241398047231e-10 & 6.02482796094462e-10 & 0.999999999698759 \tabularnewline
47 & 4.8491020854336e-08 & 9.6982041708672e-08 & 0.99999995150898 \tabularnewline
48 & 1.40661129056626e-06 & 2.81322258113252e-06 & 0.99999859338871 \tabularnewline
49 & 9.65055820512167e-06 & 1.93011164102433e-05 & 0.999990349441795 \tabularnewline
50 & 5.62989147498452e-05 & 0.000112597829499690 & 0.99994370108525 \tabularnewline
51 & 0.00020492527958851 & 0.00040985055917702 & 0.999795074720412 \tabularnewline
52 & 0.00061671561747991 & 0.00123343123495982 & 0.99938328438252 \tabularnewline
53 & 0.00185976356187041 & 0.00371952712374082 & 0.99814023643813 \tabularnewline
54 & 0.00499512883303116 & 0.00999025766606231 & 0.995004871166969 \tabularnewline
55 & 0.0126924090842415 & 0.0253848181684831 & 0.987307590915758 \tabularnewline
56 & 0.0307030393905514 & 0.0614060787811028 & 0.969296960609449 \tabularnewline
57 & 0.0591922167691139 & 0.118384433538228 & 0.940807783230886 \tabularnewline
58 & 0.09975885383361 & 0.19951770766722 & 0.90024114616639 \tabularnewline
59 & 0.200355290268592 & 0.400710580537185 & 0.799644709731408 \tabularnewline
60 & 0.364650535895058 & 0.729301071790117 & 0.635349464104942 \tabularnewline
61 & 0.506364455595712 & 0.987271088808576 & 0.493635544404288 \tabularnewline
62 & 0.566135016220589 & 0.867729967558822 & 0.433864983779411 \tabularnewline
63 & 0.688880251670015 & 0.622239496659969 & 0.311119748329985 \tabularnewline
64 & 0.75659151609374 & 0.486816967812519 & 0.243408483906259 \tabularnewline
65 & 0.810168986199616 & 0.379662027600769 & 0.189831013800385 \tabularnewline
66 & 0.860778989452988 & 0.278442021094025 & 0.139221010547012 \tabularnewline
67 & 0.9512201738817 & 0.0975596522366015 & 0.0487798261183008 \tabularnewline
68 & 0.997054399387278 & 0.00589120122544459 & 0.00294560061272230 \tabularnewline
\hline
\end{tabular}
%Source: https://freestatistics.org/blog/index.php?pk=33775&T=5

[TABLE]
[ROW][C]Goldfeld-Quandt test for Heteroskedasticity[/C][/ROW]
[ROW][C]p-values[/C][C]Alternative Hypothesis[/C][/ROW]
[ROW][C]breakpoint index[/C][C]greater[/C][C]2-sided[/C][C]less[/C][/ROW]
[ROW][C]16[/C][C]0.00607336985825771[/C][C]0.0121467397165154[/C][C]0.993926630141742[/C][/ROW]
[ROW][C]17[/C][C]0.000840222199133533[/C][C]0.00168044439826707[/C][C]0.999159777800867[/C][/ROW]
[ROW][C]18[/C][C]0.000104132567705147[/C][C]0.000208265135410295[/C][C]0.999895867432295[/C][/ROW]
[ROW][C]19[/C][C]1.26654166229175e-05[/C][C]2.53308332458351e-05[/C][C]0.999987334583377[/C][/ROW]
[ROW][C]20[/C][C]1.56166698075822e-06[/C][C]3.12333396151645e-06[/C][C]0.99999843833302[/C][/ROW]
[ROW][C]21[/C][C]1.74593420198650e-07[/C][C]3.49186840397301e-07[/C][C]0.99999982540658[/C][/ROW]
[ROW][C]22[/C][C]1.88535028623126e-08[/C][C]3.77070057246251e-08[/C][C]0.999999981146497[/C][/ROW]
[ROW][C]23[/C][C]2.00985251341664e-09[/C][C]4.01970502683328e-09[/C][C]0.999999997990147[/C][/ROW]
[ROW][C]24[/C][C]2.23930211638380e-10[/C][C]4.47860423276761e-10[/C][C]0.99999999977607[/C][/ROW]
[ROW][C]25[/C][C]6.87829496969717e-11[/C][C]1.37565899393943e-10[/C][C]0.999999999931217[/C][/ROW]
[ROW][C]26[/C][C]9.16440083811127e-12[/C][C]1.83288016762225e-11[/C][C]0.999999999990836[/C][/ROW]
[ROW][C]27[/C][C]9.74142818817262e-13[/C][C]1.94828563763452e-12[/C][C]0.999999999999026[/C][/ROW]
[ROW][C]28[/C][C]1.48103815054379e-13[/C][C]2.96207630108759e-13[/C][C]0.999999999999852[/C][/ROW]
[ROW][C]29[/C][C]2.04876796536312e-14[/C][C]4.09753593072625e-14[/C][C]0.99999999999998[/C][/ROW]
[ROW][C]30[/C][C]2.24363956995947e-15[/C][C]4.48727913991893e-15[/C][C]0.999999999999998[/C][/ROW]
[ROW][C]31[/C][C]2.64072137605473e-16[/C][C]5.28144275210947e-16[/C][C]1[/C][/ROW]
[ROW][C]32[/C][C]5.0087616319517e-17[/C][C]1.00175232639034e-16[/C][C]1[/C][/ROW]
[ROW][C]33[/C][C]5.05509968002994e-17[/C][C]1.01101993600599e-16[/C][C]1[/C][/ROW]
[ROW][C]34[/C][C]1.60610882935221e-17[/C][C]3.21221765870442e-17[/C][C]1[/C][/ROW]
[ROW][C]35[/C][C]3.72125714147942e-18[/C][C]7.44251428295884e-18[/C][C]1[/C][/ROW]
[ROW][C]36[/C][C]1.09277940449768e-18[/C][C]2.18555880899537e-18[/C][C]1[/C][/ROW]
[ROW][C]37[/C][C]4.53360548298327e-19[/C][C]9.06721096596654e-19[/C][C]1[/C][/ROW]
[ROW][C]38[/C][C]1.50059937679000e-19[/C][C]3.00119875358001e-19[/C][C]1[/C][/ROW]
[ROW][C]39[/C][C]3.76622360725320e-20[/C][C]7.53244721450641e-20[/C][C]1[/C][/ROW]
[ROW][C]40[/C][C]1.41111228206874e-20[/C][C]2.82222456413749e-20[/C][C]1[/C][/ROW]
[ROW][C]41[/C][C]8.27291189943653e-21[/C][C]1.65458237988731e-20[/C][C]1[/C][/ROW]
[ROW][C]42[/C][C]4.54569132588485e-21[/C][C]9.0913826517697e-21[/C][C]1[/C][/ROW]
[ROW][C]43[/C][C]1.31630687039876e-20[/C][C]2.63261374079753e-20[/C][C]1[/C][/ROW]
[ROW][C]44[/C][C]2.75925241125943e-16[/C][C]5.51850482251886e-16[/C][C]1[/C][/ROW]
[ROW][C]45[/C][C]6.39042594885341e-13[/C][C]1.27808518977068e-12[/C][C]0.99999999999936[/C][/ROW]
[ROW][C]46[/C][C]3.01241398047231e-10[/C][C]6.02482796094462e-10[/C][C]0.999999999698759[/C][/ROW]
[ROW][C]47[/C][C]4.8491020854336e-08[/C][C]9.6982041708672e-08[/C][C]0.99999995150898[/C][/ROW]
[ROW][C]48[/C][C]1.40661129056626e-06[/C][C]2.81322258113252e-06[/C][C]0.99999859338871[/C][/ROW]
[ROW][C]49[/C][C]9.65055820512167e-06[/C][C]1.93011164102433e-05[/C][C]0.999990349441795[/C][/ROW]
[ROW][C]50[/C][C]5.62989147498452e-05[/C][C]0.000112597829499690[/C][C]0.99994370108525[/C][/ROW]
[ROW][C]51[/C][C]0.00020492527958851[/C][C]0.00040985055917702[/C][C]0.999795074720412[/C][/ROW]
[ROW][C]52[/C][C]0.00061671561747991[/C][C]0.00123343123495982[/C][C]0.99938328438252[/C][/ROW]
[ROW][C]53[/C][C]0.00185976356187041[/C][C]0.00371952712374082[/C][C]0.99814023643813[/C][/ROW]
[ROW][C]54[/C][C]0.00499512883303116[/C][C]0.00999025766606231[/C][C]0.995004871166969[/C][/ROW]
[ROW][C]55[/C][C]0.0126924090842415[/C][C]0.0253848181684831[/C][C]0.987307590915758[/C][/ROW]
[ROW][C]56[/C][C]0.0307030393905514[/C][C]0.0614060787811028[/C][C]0.969296960609449[/C][/ROW]
[ROW][C]57[/C][C]0.0591922167691139[/C][C]0.118384433538228[/C][C]0.940807783230886[/C][/ROW]
[ROW][C]58[/C][C]0.09975885383361[/C][C]0.19951770766722[/C][C]0.90024114616639[/C][/ROW]
[ROW][C]59[/C][C]0.200355290268592[/C][C]0.400710580537185[/C][C]0.799644709731408[/C][/ROW]
[ROW][C]60[/C][C]0.364650535895058[/C][C]0.729301071790117[/C][C]0.635349464104942[/C][/ROW]
[ROW][C]61[/C][C]0.506364455595712[/C][C]0.987271088808576[/C][C]0.493635544404288[/C][/ROW]
[ROW][C]62[/C][C]0.566135016220589[/C][C]0.867729967558822[/C][C]0.433864983779411[/C][/ROW]
[ROW][C]63[/C][C]0.688880251670015[/C][C]0.622239496659969[/C][C]0.311119748329985[/C][/ROW]
[ROW][C]64[/C][C]0.75659151609374[/C][C]0.486816967812519[/C][C]0.243408483906259[/C][/ROW]
[ROW][C]65[/C][C]0.810168986199616[/C][C]0.379662027600769[/C][C]0.189831013800385[/C][/ROW]
[ROW][C]66[/C][C]0.860778989452988[/C][C]0.278442021094025[/C][C]0.139221010547012[/C][/ROW]
[ROW][C]67[/C][C]0.9512201738817[/C][C]0.0975596522366015[/C][C]0.0487798261183008[/C][/ROW]
[ROW][C]68[/C][C]0.997054399387278[/C][C]0.00589120122544459[/C][C]0.00294560061272230[/C][/ROW]
[/TABLE]
Source: https://freestatistics.org/blog/index.php?pk=33775&T=5

Globally Unique Identifier (entire table): ba.freestatistics.org/blog/index.php?pk=33775&T=5

As an alternative you can also use a QR Code:  

The GUIDs for individual cells are displayed in the table below:

Goldfeld-Quandt test for Heteroskedasticity
p-valuesAlternative Hypothesis
breakpoint indexgreater2-sidedless
160.006073369858257710.01214673971651540.993926630141742
170.0008402221991335330.001680444398267070.999159777800867
180.0001041325677051470.0002082651354102950.999895867432295
191.26654166229175e-052.53308332458351e-050.999987334583377
201.56166698075822e-063.12333396151645e-060.99999843833302
211.74593420198650e-073.49186840397301e-070.99999982540658
221.88535028623126e-083.77070057246251e-080.999999981146497
232.00985251341664e-094.01970502683328e-090.999999997990147
242.23930211638380e-104.47860423276761e-100.99999999977607
256.87829496969717e-111.37565899393943e-100.999999999931217
269.16440083811127e-121.83288016762225e-110.999999999990836
279.74142818817262e-131.94828563763452e-120.999999999999026
281.48103815054379e-132.96207630108759e-130.999999999999852
292.04876796536312e-144.09753593072625e-140.99999999999998
302.24363956995947e-154.48727913991893e-150.999999999999998
312.64072137605473e-165.28144275210947e-161
325.0087616319517e-171.00175232639034e-161
335.05509968002994e-171.01101993600599e-161
341.60610882935221e-173.21221765870442e-171
353.72125714147942e-187.44251428295884e-181
361.09277940449768e-182.18555880899537e-181
374.53360548298327e-199.06721096596654e-191
381.50059937679000e-193.00119875358001e-191
393.76622360725320e-207.53244721450641e-201
401.41111228206874e-202.82222456413749e-201
418.27291189943653e-211.65458237988731e-201
424.54569132588485e-219.0913826517697e-211
431.31630687039876e-202.63261374079753e-201
442.75925241125943e-165.51850482251886e-161
456.39042594885341e-131.27808518977068e-120.99999999999936
463.01241398047231e-106.02482796094462e-100.999999999698759
474.8491020854336e-089.6982041708672e-080.99999995150898
481.40661129056626e-062.81322258113252e-060.99999859338871
499.65055820512167e-061.93011164102433e-050.999990349441795
505.62989147498452e-050.0001125978294996900.99994370108525
510.000204925279588510.000409850559177020.999795074720412
520.000616715617479910.001233431234959820.99938328438252
530.001859763561870410.003719527123740820.99814023643813
540.004995128833031160.009990257666062310.995004871166969
550.01269240908424150.02538481816848310.987307590915758
560.03070303939055140.06140607878110280.969296960609449
570.05919221676911390.1183844335382280.940807783230886
580.099758853833610.199517707667220.90024114616639
590.2003552902685920.4007105805371850.799644709731408
600.3646505358950580.7293010717901170.635349464104942
610.5063644555957120.9872710888085760.493635544404288
620.5661350162205890.8677299675588220.433864983779411
630.6888802516700150.6222394966599690.311119748329985
640.756591516093740.4868169678125190.243408483906259
650.8101689861996160.3796620276007690.189831013800385
660.8607789894529880.2784420210940250.139221010547012
670.95122017388170.09755965223660150.0487798261183008
680.9970543993872780.005891201225444590.00294560061272230


Meta Analysis of Goldfeld-Quandt test for Heteroskedasticity
Description# significant tests% significant testsOK/NOK
1% type I error level390.735849056603774NOK
5% type I error level410.773584905660377NOK
10% type I error level430.811320754716981NOK

\begin{tabular}{lllllllll}
\hline
Meta Analysis of Goldfeld-Quandt test for Heteroskedasticity \tabularnewline
Description & # significant tests & % significant tests & OK/NOK \tabularnewline
1% type I error level & 39 & 0.735849056603774 & NOK \tabularnewline
5% type I error level & 41 & 0.773584905660377 & NOK \tabularnewline
10% type I error level & 43 & 0.811320754716981 & NOK \tabularnewline
\hline
\end{tabular}
%Source: https://freestatistics.org/blog/index.php?pk=33775&T=6

[TABLE]
[ROW][C]Meta Analysis of Goldfeld-Quandt test for Heteroskedasticity[/C][/ROW]
[ROW][C]Description[/C][C]# significant tests[/C][C]% significant tests[/C][C]OK/NOK[/C][/ROW]
[ROW][C]1% type I error level[/C][C]39[/C][C]0.735849056603774[/C][C]NOK[/C][/ROW]
[ROW][C]5% type I error level[/C][C]41[/C][C]0.773584905660377[/C][C]NOK[/C][/ROW]
[ROW][C]10% type I error level[/C][C]43[/C][C]0.811320754716981[/C][C]NOK[/C][/ROW]
[/TABLE]
Source: https://freestatistics.org/blog/index.php?pk=33775&T=6

Globally Unique Identifier (entire table): ba.freestatistics.org/blog/index.php?pk=33775&T=6

As an alternative you can also use a QR Code:  

The GUIDs for individual cells are displayed in the table below:

Meta Analysis of Goldfeld-Quandt test for Heteroskedasticity
Description# significant tests% significant testsOK/NOK
1% type I error level390.735849056603774NOK
5% type I error level410.773584905660377NOK
10% type I error level430.811320754716981NOK


Parameters (Session):
par1 = 1 ; par2 = Include Monthly Dummies ; par3 = No Linear Trend ;
Parameters (R input):
par1 = 1 ; par2 = Include Monthly Dummies ; par3 = No Linear Trend ;
R code (references can be found in the software module):
library(lattice)
library(lmtest)
n25 <- 25 #minimum number of obs. for Goldfeld-Quandt test
par1 <- as.numeric(par1)
x <- t(y)
k <- length(x[1,])
n <- length(x[,1])
x1 <- cbind(x[,par1], x[,1:k!=par1])
mycolnames <- c(colnames(x)[par1], colnames(x)[1:k!=par1])
colnames(x1) <- mycolnames #colnames(x)[par1]
x <- x1
if (par3 == 'First Differences'){
x2 <- array(0, dim=c(n-1,k), dimnames=list(1:(n-1), paste('(1-B)',colnames(x),sep='')))
for (i in 1:n-1) {
for (j in 1:k) {
x2[i,j] <- x[i+1,j] - x[i,j]
}
}
x <- x2
}
if (par2 == 'Include Monthly Dummies'){
x2 <- array(0, dim=c(n,11), dimnames=list(1:n, paste('M', seq(1:11), sep ='')))
for (i in 1:11){
x2[seq(i,n,12),i] <- 1
}
x <- cbind(x, x2)
}
if (par2 == 'Include Quarterly Dummies'){
x2 <- array(0, dim=c(n,3), dimnames=list(1:n, paste('Q', seq(1:3), sep ='')))
for (i in 1:3){
x2[seq(i,n,4),i] <- 1
}
x <- cbind(x, x2)
}
k <- length(x[1,])
if (par3 == 'Linear Trend'){
x <- cbind(x, c(1:n))
colnames(x)[k+1] <- 't'
}
x
k <- length(x[1,])
df <- as.data.frame(x)
(mylm <- lm(df))
(mysum <- summary(mylm))
if (n > n25) {
kp3 <- k + 3
nmkm3 <- n - k - 3
gqarr <- array(NA, dim=c(nmkm3-kp3+1,3))
numgqtests <- 0
numsignificant1 <- 0
numsignificant5 <- 0
numsignificant10 <- 0
for (mypoint in kp3:nmkm3) {
j <- 0
numgqtests <- numgqtests + 1
for (myalt in c('greater', 'two.sided', 'less')) {
j <- j + 1
gqarr[mypoint-kp3+1,j] <- gqtest(mylm, point=mypoint, alternative=myalt)$p.value
}
if (gqarr[mypoint-kp3+1,2] < 0.01) numsignificant1 <- numsignificant1 + 1
if (gqarr[mypoint-kp3+1,2] < 0.05) numsignificant5 <- numsignificant5 + 1
if (gqarr[mypoint-kp3+1,2] < 0.10) numsignificant10 <- numsignificant10 + 1
}
gqarr
}
bitmap(file='test0.png')
plot(x[,1], type='l', main='Actuals and Interpolation', ylab='value of Actuals and Interpolation (dots)', xlab='time or index')
points(x[,1]-mysum$resid)
grid()
dev.off()
bitmap(file='test1.png')
plot(mysum$resid, type='b', pch=19, main='Residuals', ylab='value of Residuals', xlab='time or index')
grid()
dev.off()
bitmap(file='test2.png')
hist(mysum$resid, main='Residual Histogram', xlab='values of Residuals')
grid()
dev.off()
bitmap(file='test3.png')
densityplot(~mysum$resid,col='black',main='Residual Density Plot', xlab='values of Residuals')
dev.off()
bitmap(file='test4.png')
qqnorm(mysum$resid, main='Residual Normal Q-Q Plot')
qqline(mysum$resid)
grid()
dev.off()
(myerror <- as.ts(mysum$resid))
bitmap(file='test5.png')
dum <- cbind(lag(myerror,k=1),myerror)
dum
dum1 <- dum[2:length(myerror),]
dum1
z <- as.data.frame(dum1)
z
plot(z,main=paste('Residual Lag plot, lowess, and regression line'), ylab='values of Residuals', xlab='lagged values of Residuals')
lines(lowess(z))
abline(lm(z))
grid()
dev.off()
bitmap(file='test6.png')
acf(mysum$resid, lag.max=length(mysum$resid)/2, main='Residual Autocorrelation Function')
grid()
dev.off()
bitmap(file='test7.png')
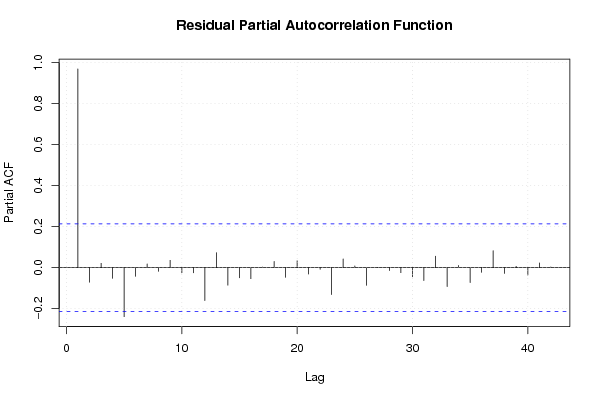
pacf(mysum$resid, lag.max=length(mysum$resid)/2, main='Residual Partial Autocorrelation Function')
grid()
dev.off()
bitmap(file='test8.png')
opar <- par(mfrow = c(2,2), oma = c(0, 0, 1.1, 0))
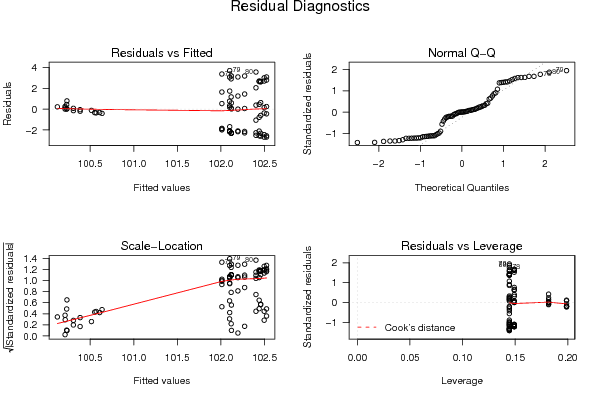
plot(mylm, las = 1, sub='Residual Diagnostics')
par(opar)
dev.off()
if (n > n25) {
bitmap(file='test9.png')
plot(kp3:nmkm3,gqarr[,2], main='Goldfeld-Quandt test',ylab='2-sided p-value',xlab='breakpoint')
grid()
dev.off()
}
load(file='createtable')
a<-table.start()
a<-table.row.start(a)
a<-table.element(a, 'Multiple Linear Regression - Estimated Regression Equation', 1, TRUE)
a<-table.row.end(a)
myeq <- colnames(x)[1]
myeq <- paste(myeq, '[t] = ', sep='')
for (i in 1:k){
if (mysum$coefficients[i,1] > 0) myeq <- paste(myeq, '+', '')
myeq <- paste(myeq, mysum$coefficients[i,1], sep=' ')
if (rownames(mysum$coefficients)[i] != '(Intercept)') {
myeq <- paste(myeq, rownames(mysum$coefficients)[i], sep='')
if (rownames(mysum$coefficients)[i] != 't') myeq <- paste(myeq, '[t]', sep='')
}
}
myeq <- paste(myeq, ' + e[t]')
a<-table.row.start(a)
a<-table.element(a, myeq)
a<-table.row.end(a)
a<-table.end(a)
table.save(a,file='mytable1.tab')
a<-table.start()
a<-table.row.start(a)
a<-table.element(a,hyperlink('ols1.htm','Multiple Linear Regression - Ordinary Least Squares',''), 6, TRUE)
a<-table.row.end(a)
a<-table.row.start(a)
a<-table.element(a,'Variable',header=TRUE)
a<-table.element(a,'Parameter',header=TRUE)
a<-table.element(a,'S.D.',header=TRUE)
a<-table.element(a,'T-STAT
H0: parameter = 0',header=TRUE)
a<-table.element(a,'2-tail p-value',header=TRUE)
a<-table.element(a,'1-tail p-value',header=TRUE)
a<-table.row.end(a)
for (i in 1:k){
a<-table.row.start(a)
a<-table.element(a,rownames(mysum$coefficients)[i],header=TRUE)
a<-table.element(a,mysum$coefficients[i,1])
a<-table.element(a, round(mysum$coefficients[i,2],6))
a<-table.element(a, round(mysum$coefficients[i,3],4))
a<-table.element(a, round(mysum$coefficients[i,4],6))
a<-table.element(a, round(mysum$coefficients[i,4]/2,6))
a<-table.row.end(a)
}
a<-table.end(a)
table.save(a,file='mytable2.tab')
a<-table.start()
a<-table.row.start(a)
a<-table.element(a, 'Multiple Linear Regression - Regression Statistics', 2, TRUE)
a<-table.row.end(a)
a<-table.row.start(a)
a<-table.element(a, 'Multiple R',1,TRUE)
a<-table.element(a, sqrt(mysum$r.squared))
a<-table.row.end(a)
a<-table.row.start(a)
a<-table.element(a, 'R-squared',1,TRUE)
a<-table.element(a, mysum$r.squared)
a<-table.row.end(a)
a<-table.row.start(a)
a<-table.element(a, 'Adjusted R-squared',1,TRUE)
a<-table.element(a, mysum$adj.r.squared)
a<-table.row.end(a)
a<-table.row.start(a)
a<-table.element(a, 'F-TEST (value)',1,TRUE)
a<-table.element(a, mysum$fstatistic[1])
a<-table.row.end(a)
a<-table.row.start(a)
a<-table.element(a, 'F-TEST (DF numerator)',1,TRUE)
a<-table.element(a, mysum$fstatistic[2])
a<-table.row.end(a)
a<-table.row.start(a)
a<-table.element(a, 'F-TEST (DF denominator)',1,TRUE)
a<-table.element(a, mysum$fstatistic[3])
a<-table.row.end(a)
a<-table.row.start(a)
a<-table.element(a, 'p-value',1,TRUE)
a<-table.element(a, 1-pf(mysum$fstatistic[1],mysum$fstatistic[2],mysum$fstatistic[3]))
a<-table.row.end(a)
a<-table.row.start(a)
a<-table.element(a, 'Multiple Linear Regression - Residual Statistics', 2, TRUE)
a<-table.row.end(a)
a<-table.row.start(a)
a<-table.element(a, 'Residual Standard Deviation',1,TRUE)
a<-table.element(a, mysum$sigma)
a<-table.row.end(a)
a<-table.row.start(a)
a<-table.element(a, 'Sum Squared Residuals',1,TRUE)
a<-table.element(a, sum(myerror*myerror))
a<-table.row.end(a)
a<-table.end(a)
table.save(a,file='mytable3.tab')
a<-table.start()
a<-table.row.start(a)
a<-table.element(a, 'Multiple Linear Regression - Actuals, Interpolation, and Residuals', 4, TRUE)
a<-table.row.end(a)
a<-table.row.start(a)
a<-table.element(a, 'Time or Index', 1, TRUE)
a<-table.element(a, 'Actuals', 1, TRUE)
a<-table.element(a, 'Interpolation
Forecast', 1, TRUE)
a<-table.element(a, 'Residuals
Prediction Error', 1, TRUE)
a<-table.row.end(a)
for (i in 1:n) {
a<-table.row.start(a)
a<-table.element(a,i, 1, TRUE)
a<-table.element(a,x[i])
a<-table.element(a,x[i]-mysum$resid[i])
a<-table.element(a,mysum$resid[i])
a<-table.row.end(a)
}
a<-table.end(a)
table.save(a,file='mytable4.tab')
if (n > n25) {
a<-table.start()
a<-table.row.start(a)
a<-table.element(a,'Goldfeld-Quandt test for Heteroskedasticity',4,TRUE)
a<-table.row.end(a)
a<-table.row.start(a)
a<-table.element(a,'p-values',header=TRUE)
a<-table.element(a,'Alternative Hypothesis',3,header=TRUE)
a<-table.row.end(a)
a<-table.row.start(a)
a<-table.element(a,'breakpoint index',header=TRUE)
a<-table.element(a,'greater',header=TRUE)
a<-table.element(a,'2-sided',header=TRUE)
a<-table.element(a,'less',header=TRUE)
a<-table.row.end(a)
for (mypoint in kp3:nmkm3) {
a<-table.row.start(a)
a<-table.element(a,mypoint,header=TRUE)
a<-table.element(a,gqarr[mypoint-kp3+1,1])
a<-table.element(a,gqarr[mypoint-kp3+1,2])
a<-table.element(a,gqarr[mypoint-kp3+1,3])
a<-table.row.end(a)
}
a<-table.end(a)
table.save(a,file='mytable5.tab')
a<-table.start()
a<-table.row.start(a)
a<-table.element(a,'Meta Analysis of Goldfeld-Quandt test for Heteroskedasticity',4,TRUE)
a<-table.row.end(a)
a<-table.row.start(a)
a<-table.element(a,'Description',header=TRUE)
a<-table.element(a,'# significant tests',header=TRUE)
a<-table.element(a,'% significant tests',header=TRUE)
a<-table.element(a,'OK/NOK',header=TRUE)
a<-table.row.end(a)
a<-table.row.start(a)
a<-table.element(a,'1% type I error level',header=TRUE)
a<-table.element(a,numsignificant1)
a<-table.element(a,numsignificant1/numgqtests)
if (numsignificant1/numgqtests < 0.01) dum <- 'OK' else dum <- 'NOK'
a<-table.element(a,dum)
a<-table.row.end(a)
a<-table.row.start(a)
a<-table.element(a,'5% type I error level',header=TRUE)
a<-table.element(a,numsignificant5)
a<-table.element(a,numsignificant5/numgqtests)
if (numsignificant5/numgqtests < 0.05) dum <- 'OK' else dum <- 'NOK'
a<-table.element(a,dum)
a<-table.row.end(a)
a<-table.row.start(a)
a<-table.element(a,'10% type I error level',header=TRUE)
a<-table.element(a,numsignificant10)
a<-table.element(a,numsignificant10/numgqtests)
if (numsignificant10/numgqtests < 0.1) dum <- 'OK' else dum <- 'NOK'
a<-table.element(a,dum)
a<-table.row.end(a)
a<-table.end(a)
table.save(a,file='mytable6.tab')
}