Free Statistics

of Irreproducible Research!

Author's title

Author*The author of this computation has been verified*
R Software Modulerwasp_arimaforecasting.wasp
Title produced by softwareARIMA Forecasting
Date of computationMon, 15 Dec 2008 11:09:31 -0700
Cite this page as followsStatistical Computations at FreeStatistics.org, Office for Research Development and Education, URL https://freestatistics.org/blog/index.php?v=date/2008/Dec/15/t1229364615vcnyutzvtn5tgj8.htm/, Retrieved Wed, 15 May 2024 07:39:02 +0000
Statistical Computations at FreeStatistics.org, Office for Research Development and Education, URL https://freestatistics.org/blog/index.php?pk=33760, Retrieved Wed, 15 May 2024 07:39:02 +0000
QR Codes:

Original text written by user:
IsPrivate?No (this computation is public)
User-defined keywords
Estimated Impact232
Family? (F = Feedback message, R = changed R code, M = changed R Module, P = changed Parameters, D = changed Data)
F     [Univariate Data Series] [Airline data] [2007-10-18 09:58:47] [42daae401fd3def69a25014f2252b4c2]
F RMPD  [Spectral Analysis] [spectral analysis] [2008-12-02 17:36:41] [415d0222c17b651a9576eaac006f530d]
F RMPD    [(Partial) Autocorrelation Function] [autocorrelatie] [2008-12-02 18:10:55] [415d0222c17b651a9576eaac006f530d]
F RMP         [ARIMA Forecasting] [arima forecasting] [2008-12-15 18:09:31] [bb7e3816cefc365f4d7adcd50784b783] [Current]
Feedback Forum
2008-12-22 15:49:06 [Gert-Jan Geudens] [reply
Correct maar totaal overbodig : in de vraag stond reeds dat je 12 perioden moet testen.
Het heeft geen zin om een voorspelling te maken voor nul perioden. Dan kan je beter geen voorspelling doen.

Post a new message
Dataseries X:
3.253
3.233
3.196
3.138
3.091
3.17
3.378
3.468
3.33
3.413
3.356
3.525
3.633
3.597
3.6
3.522
3.503
3.532
3.686
3.748
3.672
3.843
3.905
3.999
4.07
4.084
4.042
3.951
3.933
3.958
4.147
4.221
4.058
4.057
4.089
4.268
4.309
4.303
4.177
4.117
4.065
3.983
4.091
4.067
4.024
3.868
3.8
3.804
3.862
3.792
3.674
3.56
3.489
3.412
3.674
3.672
3.463
3.429
3.4
3.533


Summary of computational transaction
Raw Inputview raw input (R code)
Raw Outputview raw output of R engine
Computing time1 seconds
R Server'Gwilym Jenkins' @ 72.249.127.135

\begin{tabular}{lllllllll}
\hline
Summary of computational transaction \tabularnewline
Raw Input & view raw input (R code)  \tabularnewline
Raw Output & view raw output of R engine  \tabularnewline
Computing time & 1 seconds \tabularnewline
R Server & 'Gwilym Jenkins' @ 72.249.127.135 \tabularnewline
\hline
\end{tabular}
%Source: https://freestatistics.org/blog/index.php?pk=33760&T=0

[TABLE]
[ROW][C]Summary of computational transaction[/C][/ROW]
[ROW][C]Raw Input[/C][C]view raw input (R code) [/C][/ROW]
[ROW][C]Raw Output[/C][C]view raw output of R engine [/C][/ROW]
[ROW][C]Computing time[/C][C]1 seconds[/C][/ROW]
[ROW][C]R Server[/C][C]'Gwilym Jenkins' @ 72.249.127.135[/C][/ROW]
[/TABLE]
Source: https://freestatistics.org/blog/index.php?pk=33760&T=0

Globally Unique Identifier (entire table): ba.freestatistics.org/blog/index.php?pk=33760&T=0

As an alternative you can also use a QR Code:  

The GUIDs for individual cells are displayed in the table below:

Summary of computational transaction
Raw Inputview raw input (R code)
Raw Outputview raw output of R engine
Computing time1 seconds
R Server'Gwilym Jenkins' @ 72.249.127.135


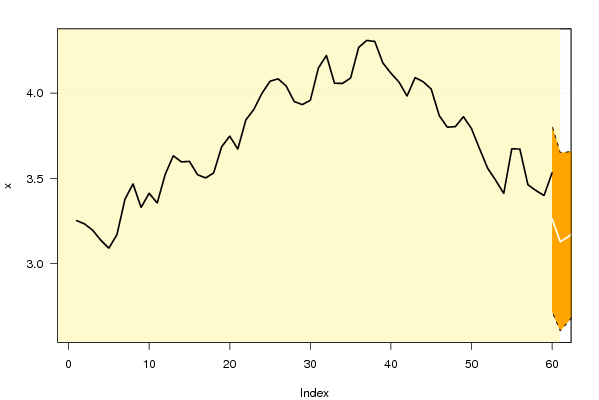
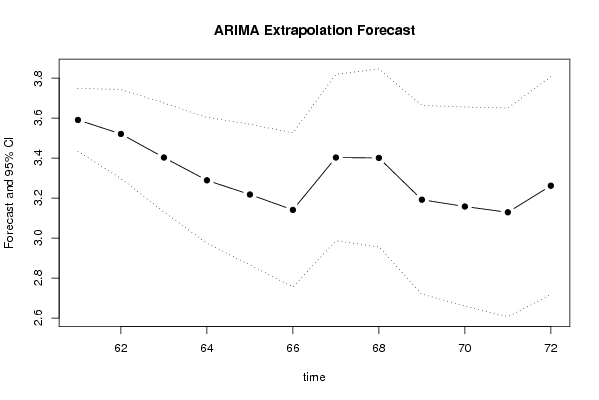
Univariate ARIMA Extrapolation Forecast
timeY[t]F[t]95% LB95% UBp-value(H0: Y[t] = F[t])P(F[t]>Y[t-1])P(F[t]>Y[t-s])P(F[t]>Y[60])
483.804-------
493.862-------
503.792-------
513.674-------
523.56-------
533.489-------
543.412-------
553.674-------
563.672-------
573.463-------
583.429-------
593.4-------
603.533-------
61NA3.5913.43363.7484NA0.7654e-040.765
62NA3.5213.29843.7436NANA0.00850.4579
63NA3.4033.13043.6756NANA0.02570.175
64NA3.2892.97423.6038NANA0.04580.0643
65NA3.2182.86613.5699NANA0.06560.0397
66NA3.1412.75553.5265NANA0.08410.0231
67NA3.4032.98663.8194NANA0.1010.2703
68NA3.4012.95593.8461NANA0.11640.2805
69NA3.1922.71993.6641NANA0.13030.0784
70NA3.1582.66033.6557NANA0.14290.0699
71NA3.1292.6073.651NANA0.15440.0646
72NA3.2622.71683.8072NANA0.1650.165

\begin{tabular}{lllllllll}
\hline
Univariate ARIMA Extrapolation Forecast \tabularnewline
time & Y[t] & F[t] & 95% LB & 95% UB & p-value(H0: Y[t] = F[t]) & P(F[t]>Y[t-1]) & P(F[t]>Y[t-s]) & P(F[t]>Y[60]) \tabularnewline
48 & 3.804 & - & - & - & - & - & - & - \tabularnewline
49 & 3.862 & - & - & - & - & - & - & - \tabularnewline
50 & 3.792 & - & - & - & - & - & - & - \tabularnewline
51 & 3.674 & - & - & - & - & - & - & - \tabularnewline
52 & 3.56 & - & - & - & - & - & - & - \tabularnewline
53 & 3.489 & - & - & - & - & - & - & - \tabularnewline
54 & 3.412 & - & - & - & - & - & - & - \tabularnewline
55 & 3.674 & - & - & - & - & - & - & - \tabularnewline
56 & 3.672 & - & - & - & - & - & - & - \tabularnewline
57 & 3.463 & - & - & - & - & - & - & - \tabularnewline
58 & 3.429 & - & - & - & - & - & - & - \tabularnewline
59 & 3.4 & - & - & - & - & - & - & - \tabularnewline
60 & 3.533 & - & - & - & - & - & - & - \tabularnewline
61 & NA & 3.591 & 3.4336 & 3.7484 & NA & 0.765 & 4e-04 & 0.765 \tabularnewline
62 & NA & 3.521 & 3.2984 & 3.7436 & NA & NA & 0.0085 & 0.4579 \tabularnewline
63 & NA & 3.403 & 3.1304 & 3.6756 & NA & NA & 0.0257 & 0.175 \tabularnewline
64 & NA & 3.289 & 2.9742 & 3.6038 & NA & NA & 0.0458 & 0.0643 \tabularnewline
65 & NA & 3.218 & 2.8661 & 3.5699 & NA & NA & 0.0656 & 0.0397 \tabularnewline
66 & NA & 3.141 & 2.7555 & 3.5265 & NA & NA & 0.0841 & 0.0231 \tabularnewline
67 & NA & 3.403 & 2.9866 & 3.8194 & NA & NA & 0.101 & 0.2703 \tabularnewline
68 & NA & 3.401 & 2.9559 & 3.8461 & NA & NA & 0.1164 & 0.2805 \tabularnewline
69 & NA & 3.192 & 2.7199 & 3.6641 & NA & NA & 0.1303 & 0.0784 \tabularnewline
70 & NA & 3.158 & 2.6603 & 3.6557 & NA & NA & 0.1429 & 0.0699 \tabularnewline
71 & NA & 3.129 & 2.607 & 3.651 & NA & NA & 0.1544 & 0.0646 \tabularnewline
72 & NA & 3.262 & 2.7168 & 3.8072 & NA & NA & 0.165 & 0.165 \tabularnewline
\hline
\end{tabular}
%Source: https://freestatistics.org/blog/index.php?pk=33760&T=1

[TABLE]
[ROW][C]Univariate ARIMA Extrapolation Forecast[/C][/ROW]
[ROW][C]time[/C][C]Y[t][/C][C]F[t][/C][C]95% LB[/C][C]95% UB[/C][C]p-value(H0: Y[t] = F[t])[/C][C]P(F[t]>Y[t-1])[/C][C]P(F[t]>Y[t-s])[/C][C]P(F[t]>Y[60])[/C][/ROW]
[ROW][C]48[/C][C]3.804[/C][C]-[/C][C]-[/C][C]-[/C][C]-[/C][C]-[/C][C]-[/C][C]-[/C][/ROW]
[ROW][C]49[/C][C]3.862[/C][C]-[/C][C]-[/C][C]-[/C][C]-[/C][C]-[/C][C]-[/C][C]-[/C][/ROW]
[ROW][C]50[/C][C]3.792[/C][C]-[/C][C]-[/C][C]-[/C][C]-[/C][C]-[/C][C]-[/C][C]-[/C][/ROW]
[ROW][C]51[/C][C]3.674[/C][C]-[/C][C]-[/C][C]-[/C][C]-[/C][C]-[/C][C]-[/C][C]-[/C][/ROW]
[ROW][C]52[/C][C]3.56[/C][C]-[/C][C]-[/C][C]-[/C][C]-[/C][C]-[/C][C]-[/C][C]-[/C][/ROW]
[ROW][C]53[/C][C]3.489[/C][C]-[/C][C]-[/C][C]-[/C][C]-[/C][C]-[/C][C]-[/C][C]-[/C][/ROW]
[ROW][C]54[/C][C]3.412[/C][C]-[/C][C]-[/C][C]-[/C][C]-[/C][C]-[/C][C]-[/C][C]-[/C][/ROW]
[ROW][C]55[/C][C]3.674[/C][C]-[/C][C]-[/C][C]-[/C][C]-[/C][C]-[/C][C]-[/C][C]-[/C][/ROW]
[ROW][C]56[/C][C]3.672[/C][C]-[/C][C]-[/C][C]-[/C][C]-[/C][C]-[/C][C]-[/C][C]-[/C][/ROW]
[ROW][C]57[/C][C]3.463[/C][C]-[/C][C]-[/C][C]-[/C][C]-[/C][C]-[/C][C]-[/C][C]-[/C][/ROW]
[ROW][C]58[/C][C]3.429[/C][C]-[/C][C]-[/C][C]-[/C][C]-[/C][C]-[/C][C]-[/C][C]-[/C][/ROW]
[ROW][C]59[/C][C]3.4[/C][C]-[/C][C]-[/C][C]-[/C][C]-[/C][C]-[/C][C]-[/C][C]-[/C][/ROW]
[ROW][C]60[/C][C]3.533[/C][C]-[/C][C]-[/C][C]-[/C][C]-[/C][C]-[/C][C]-[/C][C]-[/C][/ROW]
[ROW][C]61[/C][C]NA[/C][C]3.591[/C][C]3.4336[/C][C]3.7484[/C][C]NA[/C][C]0.765[/C][C]4e-04[/C][C]0.765[/C][/ROW]
[ROW][C]62[/C][C]NA[/C][C]3.521[/C][C]3.2984[/C][C]3.7436[/C][C]NA[/C][C]NA[/C][C]0.0085[/C][C]0.4579[/C][/ROW]
[ROW][C]63[/C][C]NA[/C][C]3.403[/C][C]3.1304[/C][C]3.6756[/C][C]NA[/C][C]NA[/C][C]0.0257[/C][C]0.175[/C][/ROW]
[ROW][C]64[/C][C]NA[/C][C]3.289[/C][C]2.9742[/C][C]3.6038[/C][C]NA[/C][C]NA[/C][C]0.0458[/C][C]0.0643[/C][/ROW]
[ROW][C]65[/C][C]NA[/C][C]3.218[/C][C]2.8661[/C][C]3.5699[/C][C]NA[/C][C]NA[/C][C]0.0656[/C][C]0.0397[/C][/ROW]
[ROW][C]66[/C][C]NA[/C][C]3.141[/C][C]2.7555[/C][C]3.5265[/C][C]NA[/C][C]NA[/C][C]0.0841[/C][C]0.0231[/C][/ROW]
[ROW][C]67[/C][C]NA[/C][C]3.403[/C][C]2.9866[/C][C]3.8194[/C][C]NA[/C][C]NA[/C][C]0.101[/C][C]0.2703[/C][/ROW]
[ROW][C]68[/C][C]NA[/C][C]3.401[/C][C]2.9559[/C][C]3.8461[/C][C]NA[/C][C]NA[/C][C]0.1164[/C][C]0.2805[/C][/ROW]
[ROW][C]69[/C][C]NA[/C][C]3.192[/C][C]2.7199[/C][C]3.6641[/C][C]NA[/C][C]NA[/C][C]0.1303[/C][C]0.0784[/C][/ROW]
[ROW][C]70[/C][C]NA[/C][C]3.158[/C][C]2.6603[/C][C]3.6557[/C][C]NA[/C][C]NA[/C][C]0.1429[/C][C]0.0699[/C][/ROW]
[ROW][C]71[/C][C]NA[/C][C]3.129[/C][C]2.607[/C][C]3.651[/C][C]NA[/C][C]NA[/C][C]0.1544[/C][C]0.0646[/C][/ROW]
[ROW][C]72[/C][C]NA[/C][C]3.262[/C][C]2.7168[/C][C]3.8072[/C][C]NA[/C][C]NA[/C][C]0.165[/C][C]0.165[/C][/ROW]
[/TABLE]
Source: https://freestatistics.org/blog/index.php?pk=33760&T=1

Globally Unique Identifier (entire table): ba.freestatistics.org/blog/index.php?pk=33760&T=1

As an alternative you can also use a QR Code:  

The GUIDs for individual cells are displayed in the table below:

Univariate ARIMA Extrapolation Forecast
timeY[t]F[t]95% LB95% UBp-value(H0: Y[t] = F[t])P(F[t]>Y[t-1])P(F[t]>Y[t-s])P(F[t]>Y[60])
483.804-------
493.862-------
503.792-------
513.674-------
523.56-------
533.489-------
543.412-------
553.674-------
563.672-------
573.463-------
583.429-------
593.4-------
603.533-------
61NA3.5913.43363.7484NA0.7654e-040.765
62NA3.5213.29843.7436NANA0.00850.4579
63NA3.4033.13043.6756NANA0.02570.175
64NA3.2892.97423.6038NANA0.04580.0643
65NA3.2182.86613.5699NANA0.06560.0397
66NA3.1412.75553.5265NANA0.08410.0231
67NA3.4032.98663.8194NANA0.1010.2703
68NA3.4012.95593.8461NANA0.11640.2805
69NA3.1922.71993.6641NANA0.13030.0784
70NA3.1582.66033.6557NANA0.14290.0699
71NA3.1292.6073.651NANA0.15440.0646
72NA3.2622.71683.8072NANA0.1650.165


Univariate ARIMA Extrapolation Forecast Performance
time% S.E.PEMAPESq.EMSERMSE
610.0224NANANANANA
620.0323NANANANANA
630.0409NANANANANA
640.0488NANANANANA
650.0558NANANANANA
660.0626NANANANANA
670.0624NANANANANA
680.0668NANANANANA
690.0755NANANANANA
700.0804NANANANANA
710.0851NANANANANA
720.0853NANANANANA

\begin{tabular}{lllllllll}
\hline
Univariate ARIMA Extrapolation Forecast Performance \tabularnewline
time & % S.E. & PE & MAPE & Sq.E & MSE & RMSE \tabularnewline
61 & 0.0224 & NA & NA & NA & NA & NA \tabularnewline
62 & 0.0323 & NA & NA & NA & NA & NA \tabularnewline
63 & 0.0409 & NA & NA & NA & NA & NA \tabularnewline
64 & 0.0488 & NA & NA & NA & NA & NA \tabularnewline
65 & 0.0558 & NA & NA & NA & NA & NA \tabularnewline
66 & 0.0626 & NA & NA & NA & NA & NA \tabularnewline
67 & 0.0624 & NA & NA & NA & NA & NA \tabularnewline
68 & 0.0668 & NA & NA & NA & NA & NA \tabularnewline
69 & 0.0755 & NA & NA & NA & NA & NA \tabularnewline
70 & 0.0804 & NA & NA & NA & NA & NA \tabularnewline
71 & 0.0851 & NA & NA & NA & NA & NA \tabularnewline
72 & 0.0853 & NA & NA & NA & NA & NA \tabularnewline
\hline
\end{tabular}
%Source: https://freestatistics.org/blog/index.php?pk=33760&T=2

[TABLE]
[ROW][C]Univariate ARIMA Extrapolation Forecast Performance[/C][/ROW]
[ROW][C]time[/C][C]% S.E.[/C][C]PE[/C][C]MAPE[/C][C]Sq.E[/C][C]MSE[/C][C]RMSE[/C][/ROW]
[ROW][C]61[/C][C]0.0224[/C][C]NA[/C][C]NA[/C][C]NA[/C][C]NA[/C][C]NA[/C][/ROW]
[ROW][C]62[/C][C]0.0323[/C][C]NA[/C][C]NA[/C][C]NA[/C][C]NA[/C][C]NA[/C][/ROW]
[ROW][C]63[/C][C]0.0409[/C][C]NA[/C][C]NA[/C][C]NA[/C][C]NA[/C][C]NA[/C][/ROW]
[ROW][C]64[/C][C]0.0488[/C][C]NA[/C][C]NA[/C][C]NA[/C][C]NA[/C][C]NA[/C][/ROW]
[ROW][C]65[/C][C]0.0558[/C][C]NA[/C][C]NA[/C][C]NA[/C][C]NA[/C][C]NA[/C][/ROW]
[ROW][C]66[/C][C]0.0626[/C][C]NA[/C][C]NA[/C][C]NA[/C][C]NA[/C][C]NA[/C][/ROW]
[ROW][C]67[/C][C]0.0624[/C][C]NA[/C][C]NA[/C][C]NA[/C][C]NA[/C][C]NA[/C][/ROW]
[ROW][C]68[/C][C]0.0668[/C][C]NA[/C][C]NA[/C][C]NA[/C][C]NA[/C][C]NA[/C][/ROW]
[ROW][C]69[/C][C]0.0755[/C][C]NA[/C][C]NA[/C][C]NA[/C][C]NA[/C][C]NA[/C][/ROW]
[ROW][C]70[/C][C]0.0804[/C][C]NA[/C][C]NA[/C][C]NA[/C][C]NA[/C][C]NA[/C][/ROW]
[ROW][C]71[/C][C]0.0851[/C][C]NA[/C][C]NA[/C][C]NA[/C][C]NA[/C][C]NA[/C][/ROW]
[ROW][C]72[/C][C]0.0853[/C][C]NA[/C][C]NA[/C][C]NA[/C][C]NA[/C][C]NA[/C][/ROW]
[/TABLE]
Source: https://freestatistics.org/blog/index.php?pk=33760&T=2

Globally Unique Identifier (entire table): ba.freestatistics.org/blog/index.php?pk=33760&T=2

As an alternative you can also use a QR Code:  

The GUIDs for individual cells are displayed in the table below:

Univariate ARIMA Extrapolation Forecast Performance
time% S.E.PEMAPESq.EMSERMSE
610.0224NANANANANA
620.0323NANANANANA
630.0409NANANANANA
640.0488NANANANANA
650.0558NANANANANA
660.0626NANANANANA
670.0624NANANANANA
680.0668NANANANANA
690.0755NANANANANA
700.0804NANANANANA
710.0851NANANANANA
720.0853NANANANANA


Parameters (Session):
par1 = 0 ; par2 = 1 ; par3 = 1 ; par4 = 1 ; par5 = 12 ; par6 = 0 ; par7 = 0 ; par8 = 0 ; par9 = 0 ; par10 = FALSE ;
Parameters (R input):
par1 = 0 ; par2 = 1 ; par3 = 1 ; par4 = 1 ; par5 = 12 ; par6 = 0 ; par7 = 0 ; par8 = 0 ; par9 = 0 ; par10 = FALSE ;
R code (references can be found in the software module):
par1 <- as.numeric(par1) #cut off periods
par2 <- as.numeric(par2) #lambda
par3 <- as.numeric(par3) #degree of non-seasonal differencing
par4 <- as.numeric(par4) #degree of seasonal differencing
par5 <- as.numeric(par5) #seasonal period
par6 <- as.numeric(par6) #p
par7 <- as.numeric(par7) #q
par8 <- as.numeric(par8) #P
par9 <- as.numeric(par9) #Q
if (par10 == 'TRUE') par10 <- TRUE
if (par10 == 'FALSE') par10 <- FALSE
if (par2 == 0) x <- log(x)
if (par2 != 0) x <- x^par2
lx <- length(x)
first <- lx - 2*par1
nx <- lx - par1
nx1 <- nx + 1
fx <- lx - nx
if (fx < 1) {
fx <- par5
nx1 <- lx + fx - 1
first <- lx - 2*fx
}
first <- 1
if (fx < 3) fx <- round(lx/10,0)
(arima.out <- arima(x[1:nx], order=c(par6,par3,par7), seasonal=list(order=c(par8,par4,par9), period=par5), include.mean=par10, method='ML'))
(forecast <- predict(arima.out,fx))
(lb <- forecast$pred - 1.96 * forecast$se)
(ub <- forecast$pred + 1.96 * forecast$se)
if (par2 == 0) {
x <- exp(x)
forecast$pred <- exp(forecast$pred)
lb <- exp(lb)
ub <- exp(ub)
}
if (par2 != 0) {
x <- x^(1/par2)
forecast$pred <- forecast$pred^(1/par2)
lb <- lb^(1/par2)
ub <- ub^(1/par2)
}
if (par2 < 0) {
olb <- lb
lb <- ub
ub <- olb
}
(actandfor <- c(x[1:nx], forecast$pred))
(perc.se <- (ub-forecast$pred)/1.96/forecast$pred)
bitmap(file='test1.png')
opar <- par(mar=c(4,4,2,2),las=1)
ylim <- c( min(x[first:nx],lb), max(x[first:nx],ub))
plot(x,ylim=ylim,type='n',xlim=c(first,lx))
usr <- par('usr')
rect(usr[1],usr[3],nx+1,usr[4],border=NA,col='lemonchiffon')
rect(nx1,usr[3],usr[2],usr[4],border=NA,col='lavender')
abline(h= (-3:3)*2 , col ='gray', lty =3)
polygon( c(nx1:lx,lx:nx1), c(lb,rev(ub)), col = 'orange', lty=2,border=NA)
lines(nx1:lx, lb , lty=2)
lines(nx1:lx, ub , lty=2)
lines(x, lwd=2)
lines(nx1:lx, forecast$pred , lwd=2 , col ='white')
box()
par(opar)
dev.off()
prob.dec <- array(NA, dim=fx)
prob.sdec <- array(NA, dim=fx)
prob.ldec <- array(NA, dim=fx)
prob.pval <- array(NA, dim=fx)
perf.pe <- array(0, dim=fx)
perf.mape <- array(0, dim=fx)
perf.se <- array(0, dim=fx)
perf.mse <- array(0, dim=fx)
perf.rmse <- array(0, dim=fx)
for (i in 1:fx) {
locSD <- (ub[i] - forecast$pred[i]) / 1.96
perf.pe[i] = (x[nx+i] - forecast$pred[i]) / forecast$pred[i]
perf.mape[i] = perf.mape[i] + abs(perf.pe[i])
perf.se[i] = (x[nx+i] - forecast$pred[i])^2
perf.mse[i] = perf.mse[i] + perf.se[i]
prob.dec[i] = pnorm((x[nx+i-1] - forecast$pred[i]) / locSD)
prob.sdec[i] = pnorm((x[nx+i-par5] - forecast$pred[i]) / locSD)
prob.ldec[i] = pnorm((x[nx] - forecast$pred[i]) / locSD)
prob.pval[i] = pnorm(abs(x[nx+i] - forecast$pred[i]) / locSD)
}
perf.mape = perf.mape / fx
perf.mse = perf.mse / fx
perf.rmse = sqrt(perf.mse)
bitmap(file='test2.png')
plot(forecast$pred, pch=19, type='b',main='ARIMA Extrapolation Forecast', ylab='Forecast and 95% CI', xlab='time',ylim=c(min(lb),max(ub)))
dum <- forecast$pred
dum[1:12] <- x[(nx+1):lx]
lines(dum, lty=1)
lines(ub,lty=3)
lines(lb,lty=3)
dev.off()
load(file='createtable')
a<-table.start()
a<-table.row.start(a)
a<-table.element(a,'Univariate ARIMA Extrapolation Forecast',9,TRUE)
a<-table.row.end(a)
a<-table.row.start(a)
a<-table.element(a,'time',1,header=TRUE)
a<-table.element(a,'Y[t]',1,header=TRUE)
a<-table.element(a,'F[t]',1,header=TRUE)
a<-table.element(a,'95% LB',1,header=TRUE)
a<-table.element(a,'95% UB',1,header=TRUE)
a<-table.element(a,'p-value
(H0: Y[t] = F[t])',1,header=TRUE)
a<-table.element(a,'P(F[t]>Y[t-1])',1,header=TRUE)
a<-table.element(a,'P(F[t]>Y[t-s])',1,header=TRUE)
mylab <- paste('P(F[t]>Y[',nx,sep='')
mylab <- paste(mylab,'])',sep='')
a<-table.element(a,mylab,1,header=TRUE)
a<-table.row.end(a)
for (i in (nx-par5):nx) {
a<-table.row.start(a)
a<-table.element(a,i,header=TRUE)
a<-table.element(a,x[i])
a<-table.element(a,'-')
a<-table.row.end(a)
}
for (i in 1:fx) {
a<-table.row.start(a)
a<-table.element(a,nx+i,header=TRUE)
a<-table.element(a,round(x[nx+i],4))
a<-table.element(a,round(forecast$pred[i],4))
a<-table.element(a,round(lb[i],4))
a<-table.element(a,round(ub[i],4))
a<-table.element(a,round((1-prob.pval[i]),4))
a<-table.element(a,round((1-prob.dec[i]),4))
a<-table.element(a,round((1-prob.sdec[i]),4))
a<-table.element(a,round((1-prob.ldec[i]),4))
a<-table.row.end(a)
}
a<-table.end(a)
table.save(a,file='mytable.tab')
a<-table.start()
a<-table.row.start(a)
a<-table.element(a,'Univariate ARIMA Extrapolation Forecast Performance',7,TRUE)
a<-table.row.end(a)
a<-table.row.start(a)
a<-table.element(a,'time',1,header=TRUE)
a<-table.element(a,'% S.E.',1,header=TRUE)
a<-table.element(a,'PE',1,header=TRUE)
a<-table.element(a,'MAPE',1,header=TRUE)
a<-table.element(a,'Sq.E',1,header=TRUE)
a<-table.element(a,'MSE',1,header=TRUE)
a<-table.element(a,'RMSE',1,header=TRUE)
a<-table.row.end(a)
for (i in 1:fx) {
a<-table.row.start(a)
a<-table.element(a,nx+i,header=TRUE)
a<-table.element(a,round(perc.se[i],4))
a<-table.element(a,round(perf.pe[i],4))
a<-table.element(a,round(perf.mape[i],4))
a<-table.element(a,round(perf.se[i],4))
a<-table.element(a,round(perf.mse[i],4))
a<-table.element(a,round(perf.rmse[i],4))
a<-table.row.end(a)
}
a<-table.end(a)
table.save(a,file='mytable1.tab')