Free Statistics

of Irreproducible Research!

Author's title

Author*Unverified author*
R Software Modulerwasp_arimabackwardselection.wasp
Title produced by softwareARIMA Backward Selection
Date of computationMon, 15 Dec 2008 11:05:04 -0700
Cite this page as followsStatistical Computations at FreeStatistics.org, Office for Research Development and Education, URL https://freestatistics.org/blog/index.php?v=date/2008/Dec/15/t12293645226wcep86wtx8jdra.htm/, Retrieved Wed, 15 May 2024 06:54:05 +0000
Statistical Computations at FreeStatistics.org, Office for Research Development and Education, URL https://freestatistics.org/blog/index.php?pk=33759, Retrieved Wed, 15 May 2024 06:54:05 +0000
QR Codes:

Original text written by user:
IsPrivate?No (this computation is public)
User-defined keywords
Estimated Impact221
Family? (F = Feedback message, R = changed R code, M = changed R Module, P = changed Parameters, D = changed Data)
F     [(Partial) Autocorrelation Function] [paper bel20 autoc...] [2008-12-03 13:05:59] [f58cc3b532da25682c394745f1a82535]
-   PD  [(Partial) Autocorrelation Function] [paper variance re...] [2008-12-03 14:08:24] [f58cc3b532da25682c394745f1a82535]
- RM      [Spectral Analysis] [paper spectral an...] [2008-12-03 14:40:03] [f58cc3b532da25682c394745f1a82535]
-   P       [Spectral Analysis] [] [2008-12-07 15:17:33] [74be16979710d4c4e7c6647856088456]
F RMP         [ARIMA Backward Selection] [] [2008-12-09 18:26:36] [300682cb535653f8775e6b312a464dab]
-   P           [ARIMA Backward Selection] [] [2008-12-14 15:26:26] [74be16979710d4c4e7c6647856088456]
-   P               [ARIMA Backward Selection] [] [2008-12-15 18:05:04] [d41d8cd98f00b204e9800998ecf8427e] [Current]
-   P                 [ARIMA Backward Selection] [] [2008-12-16 16:31:14] [74be16979710d4c4e7c6647856088456]
F RMP                   [ARIMA Forecasting] [] [2008-12-16 17:13:10] [74be16979710d4c4e7c6647856088456]
Feedback Forum

Post a new message
Dataseries X:
2659.81
2638.53
2720.25
2745.88
2735.7
2811.7
2799.43
2555.28
2304.98
2214.95
2065.81
1940.49
2042
1995.37
1946.81
1765.9
1635.25
1833.42
1910.43
1959.67
1969.6
2061.41
2093.48
2120.88
2174.56
2196.72
2350.44
2440.25
2408.64
2472.81
2407.6
2454.62
2448.05
2497.84
2645.64
2756.76
2849.27
2921.44
2981.85
3080.58
3106.22
3119.31
3061.26
3097.31
3161.69
3257.16
3277.01
3295.32
3363.99
3494.17
3667.03
3813.06
3917.96
3895.51
3801.06
3570.12
3701.61
3862.27
3970.1
4138.52
4199.75
4290.89
4443.91
4502.64
4356.98
4591.27
4696.96
4621.4
4562.84
4202.52
4296.49
4435.23
4105.18
4116.68
3844.49
3720.98
3674.4
3857.62
3801.06
3504.37
3032.6
3047.03


Summary of computational transaction
Raw Inputview raw input (R code)
Raw Outputview raw output of R engine
Computing time4 seconds
R Server'Gwilym Jenkins' @ 72.249.127.135

\begin{tabular}{lllllllll}
\hline
Summary of computational transaction \tabularnewline
Raw Input & view raw input (R code)  \tabularnewline
Raw Output & view raw output of R engine  \tabularnewline
Computing time & 4 seconds \tabularnewline
R Server & 'Gwilym Jenkins' @ 72.249.127.135 \tabularnewline
\hline
\end{tabular}
%Source: https://freestatistics.org/blog/index.php?pk=33759&T=0

[TABLE]
[ROW][C]Summary of computational transaction[/C][/ROW]
[ROW][C]Raw Input[/C][C]view raw input (R code) [/C][/ROW]
[ROW][C]Raw Output[/C][C]view raw output of R engine [/C][/ROW]
[ROW][C]Computing time[/C][C]4 seconds[/C][/ROW]
[ROW][C]R Server[/C][C]'Gwilym Jenkins' @ 72.249.127.135[/C][/ROW]
[/TABLE]
Source: https://freestatistics.org/blog/index.php?pk=33759&T=0

Globally Unique Identifier (entire table): ba.freestatistics.org/blog/index.php?pk=33759&T=0

As an alternative you can also use a QR Code:  

The GUIDs for individual cells are displayed in the table below:

Summary of computational transaction
Raw Inputview raw input (R code)
Raw Outputview raw output of R engine
Computing time4 seconds
R Server'Gwilym Jenkins' @ 72.249.127.135


ARIMA Parameter Estimation and Backward Selection
Iterationar1ar2ar3ma1sar1sma1
Estimates ( 1 )-0.32610.1380.04590.6512-0.25550.4001
(p-val)(0.3797 )(0.4108 )(0.7217 )(0.0721 )(0.6963 )(0.5206 )
Estimates ( 2 )-0.37440.14300.707-0.25350.4012
(p-val)(0.294 )(0.4045 )(NA )(0.0358 )(0.6963 )(0.5175 )
Estimates ( 3 )-0.37430.141700.702900.1509
(p-val)(0.3082 )(0.4132 )(NA )(0.0434 )(NA )(0.3256 )
Estimates ( 4 )0.1284000.189600.1478
(p-val)(0.8058 )(NA )(NA )(0.7258 )(NA )(0.3326 )
Estimates ( 5 )0000.317700.1525
(p-val)(NA )(NA )(NA )(0.0057 )(NA )(0.3142 )
Estimates ( 6 )0000.3100
(p-val)(NA )(NA )(NA )(0.0055 )(NA )(NA )
Estimates ( 7 )NANANANANANA
(p-val)(NA )(NA )(NA )(NA )(NA )(NA )
Estimates ( 8 )NANANANANANA
(p-val)(NA )(NA )(NA )(NA )(NA )(NA )
Estimates ( 9 )NANANANANANA
(p-val)(NA )(NA )(NA )(NA )(NA )(NA )
Estimates ( 10 )NANANANANANA
(p-val)(NA )(NA )(NA )(NA )(NA )(NA )
Estimates ( 11 )NANANANANANA
(p-val)(NA )(NA )(NA )(NA )(NA )(NA )

\begin{tabular}{lllllllll}
\hline
ARIMA Parameter Estimation and Backward Selection \tabularnewline
Iteration & ar1 & ar2 & ar3 & ma1 & sar1 & sma1 \tabularnewline
Estimates ( 1 ) & -0.3261 & 0.138 & 0.0459 & 0.6512 & -0.2555 & 0.4001 \tabularnewline
(p-val) & (0.3797 ) & (0.4108 ) & (0.7217 ) & (0.0721 ) & (0.6963 ) & (0.5206 ) \tabularnewline
Estimates ( 2 ) & -0.3744 & 0.143 & 0 & 0.707 & -0.2535 & 0.4012 \tabularnewline
(p-val) & (0.294 ) & (0.4045 ) & (NA ) & (0.0358 ) & (0.6963 ) & (0.5175 ) \tabularnewline
Estimates ( 3 ) & -0.3743 & 0.1417 & 0 & 0.7029 & 0 & 0.1509 \tabularnewline
(p-val) & (0.3082 ) & (0.4132 ) & (NA ) & (0.0434 ) & (NA ) & (0.3256 ) \tabularnewline
Estimates ( 4 ) & 0.1284 & 0 & 0 & 0.1896 & 0 & 0.1478 \tabularnewline
(p-val) & (0.8058 ) & (NA ) & (NA ) & (0.7258 ) & (NA ) & (0.3326 ) \tabularnewline
Estimates ( 5 ) & 0 & 0 & 0 & 0.3177 & 0 & 0.1525 \tabularnewline
(p-val) & (NA ) & (NA ) & (NA ) & (0.0057 ) & (NA ) & (0.3142 ) \tabularnewline
Estimates ( 6 ) & 0 & 0 & 0 & 0.31 & 0 & 0 \tabularnewline
(p-val) & (NA ) & (NA ) & (NA ) & (0.0055 ) & (NA ) & (NA ) \tabularnewline
Estimates ( 7 ) & NA & NA & NA & NA & NA & NA \tabularnewline
(p-val) & (NA ) & (NA ) & (NA ) & (NA ) & (NA ) & (NA ) \tabularnewline
Estimates ( 8 ) & NA & NA & NA & NA & NA & NA \tabularnewline
(p-val) & (NA ) & (NA ) & (NA ) & (NA ) & (NA ) & (NA ) \tabularnewline
Estimates ( 9 ) & NA & NA & NA & NA & NA & NA \tabularnewline
(p-val) & (NA ) & (NA ) & (NA ) & (NA ) & (NA ) & (NA ) \tabularnewline
Estimates ( 10 ) & NA & NA & NA & NA & NA & NA \tabularnewline
(p-val) & (NA ) & (NA ) & (NA ) & (NA ) & (NA ) & (NA ) \tabularnewline
Estimates ( 11 ) & NA & NA & NA & NA & NA & NA \tabularnewline
(p-val) & (NA ) & (NA ) & (NA ) & (NA ) & (NA ) & (NA ) \tabularnewline
\hline
\end{tabular}
%Source: https://freestatistics.org/blog/index.php?pk=33759&T=1

[TABLE]
[ROW][C]ARIMA Parameter Estimation and Backward Selection[/C][/ROW]
[ROW][C]Iteration[/C][C]ar1[/C][C]ar2[/C][C]ar3[/C][C]ma1[/C][C]sar1[/C][C]sma1[/C][/ROW]
[ROW][C]Estimates ( 1 )[/C][C]-0.3261[/C][C]0.138[/C][C]0.0459[/C][C]0.6512[/C][C]-0.2555[/C][C]0.4001[/C][/ROW]
[ROW][C](p-val)[/C][C](0.3797 )[/C][C](0.4108 )[/C][C](0.7217 )[/C][C](0.0721 )[/C][C](0.6963 )[/C][C](0.5206 )[/C][/ROW]
[ROW][C]Estimates ( 2 )[/C][C]-0.3744[/C][C]0.143[/C][C]0[/C][C]0.707[/C][C]-0.2535[/C][C]0.4012[/C][/ROW]
[ROW][C](p-val)[/C][C](0.294 )[/C][C](0.4045 )[/C][C](NA )[/C][C](0.0358 )[/C][C](0.6963 )[/C][C](0.5175 )[/C][/ROW]
[ROW][C]Estimates ( 3 )[/C][C]-0.3743[/C][C]0.1417[/C][C]0[/C][C]0.7029[/C][C]0[/C][C]0.1509[/C][/ROW]
[ROW][C](p-val)[/C][C](0.3082 )[/C][C](0.4132 )[/C][C](NA )[/C][C](0.0434 )[/C][C](NA )[/C][C](0.3256 )[/C][/ROW]
[ROW][C]Estimates ( 4 )[/C][C]0.1284[/C][C]0[/C][C]0[/C][C]0.1896[/C][C]0[/C][C]0.1478[/C][/ROW]
[ROW][C](p-val)[/C][C](0.8058 )[/C][C](NA )[/C][C](NA )[/C][C](0.7258 )[/C][C](NA )[/C][C](0.3326 )[/C][/ROW]
[ROW][C]Estimates ( 5 )[/C][C]0[/C][C]0[/C][C]0[/C][C]0.3177[/C][C]0[/C][C]0.1525[/C][/ROW]
[ROW][C](p-val)[/C][C](NA )[/C][C](NA )[/C][C](NA )[/C][C](0.0057 )[/C][C](NA )[/C][C](0.3142 )[/C][/ROW]
[ROW][C]Estimates ( 6 )[/C][C]0[/C][C]0[/C][C]0[/C][C]0.31[/C][C]0[/C][C]0[/C][/ROW]
[ROW][C](p-val)[/C][C](NA )[/C][C](NA )[/C][C](NA )[/C][C](0.0055 )[/C][C](NA )[/C][C](NA )[/C][/ROW]
[ROW][C]Estimates ( 7 )[/C][C]NA[/C][C]NA[/C][C]NA[/C][C]NA[/C][C]NA[/C][C]NA[/C][/ROW]
[ROW][C](p-val)[/C][C](NA )[/C][C](NA )[/C][C](NA )[/C][C](NA )[/C][C](NA )[/C][C](NA )[/C][/ROW]
[ROW][C]Estimates ( 8 )[/C][C]NA[/C][C]NA[/C][C]NA[/C][C]NA[/C][C]NA[/C][C]NA[/C][/ROW]
[ROW][C](p-val)[/C][C](NA )[/C][C](NA )[/C][C](NA )[/C][C](NA )[/C][C](NA )[/C][C](NA )[/C][/ROW]
[ROW][C]Estimates ( 9 )[/C][C]NA[/C][C]NA[/C][C]NA[/C][C]NA[/C][C]NA[/C][C]NA[/C][/ROW]
[ROW][C](p-val)[/C][C](NA )[/C][C](NA )[/C][C](NA )[/C][C](NA )[/C][C](NA )[/C][C](NA )[/C][/ROW]
[ROW][C]Estimates ( 10 )[/C][C]NA[/C][C]NA[/C][C]NA[/C][C]NA[/C][C]NA[/C][C]NA[/C][/ROW]
[ROW][C](p-val)[/C][C](NA )[/C][C](NA )[/C][C](NA )[/C][C](NA )[/C][C](NA )[/C][C](NA )[/C][/ROW]
[ROW][C]Estimates ( 11 )[/C][C]NA[/C][C]NA[/C][C]NA[/C][C]NA[/C][C]NA[/C][C]NA[/C][/ROW]
[ROW][C](p-val)[/C][C](NA )[/C][C](NA )[/C][C](NA )[/C][C](NA )[/C][C](NA )[/C][C](NA )[/C][/ROW]
[/TABLE]
Source: https://freestatistics.org/blog/index.php?pk=33759&T=1

Globally Unique Identifier (entire table): ba.freestatistics.org/blog/index.php?pk=33759&T=1

As an alternative you can also use a QR Code:  

The GUIDs for individual cells are displayed in the table below:

ARIMA Parameter Estimation and Backward Selection
Iterationar1ar2ar3ma1sar1sma1
Estimates ( 1 )-0.32610.1380.04590.6512-0.25550.4001
(p-val)(0.3797 )(0.4108 )(0.7217 )(0.0721 )(0.6963 )(0.5206 )
Estimates ( 2 )-0.37440.14300.707-0.25350.4012
(p-val)(0.294 )(0.4045 )(NA )(0.0358 )(0.6963 )(0.5175 )
Estimates ( 3 )-0.37430.141700.702900.1509
(p-val)(0.3082 )(0.4132 )(NA )(0.0434 )(NA )(0.3256 )
Estimates ( 4 )0.1284000.189600.1478
(p-val)(0.8058 )(NA )(NA )(0.7258 )(NA )(0.3326 )
Estimates ( 5 )0000.317700.1525
(p-val)(NA )(NA )(NA )(0.0057 )(NA )(0.3142 )
Estimates ( 6 )0000.3100
(p-val)(NA )(NA )(NA )(0.0055 )(NA )(NA )
Estimates ( 7 )NANANANANANA
(p-val)(NA )(NA )(NA )(NA )(NA )(NA )
Estimates ( 8 )NANANANANANA
(p-val)(NA )(NA )(NA )(NA )(NA )(NA )
Estimates ( 9 )NANANANANANA
(p-val)(NA )(NA )(NA )(NA )(NA )(NA )
Estimates ( 10 )NANANANANANA
(p-val)(NA )(NA )(NA )(NA )(NA )(NA )
Estimates ( 11 )NANANANANANA
(p-val)(NA )(NA )(NA )(NA )(NA )(NA )


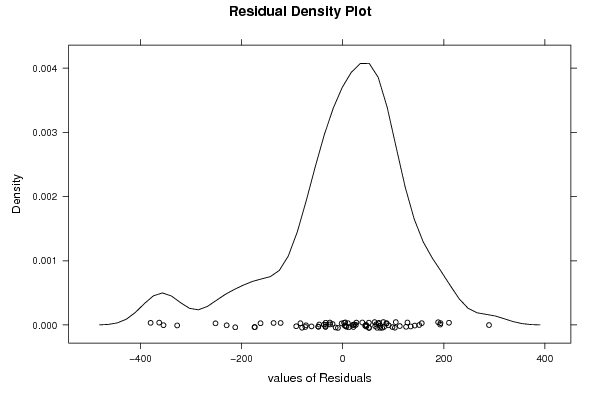
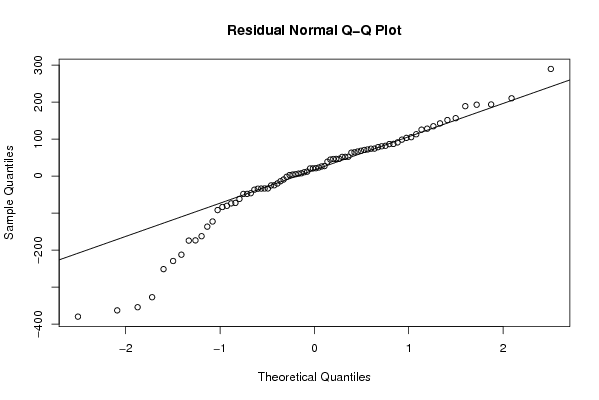
Estimated ARIMA Residuals
Value
2.65980850180785
-20.0500591259591
86.4575258620098
-2.00317887752455
-9.42707157765429
78.1256067267605
-36.9498732989612
-229.619981036125
-174.488945246369
-33.566135185722
-136.771153463658
-80.4356579960752
128.092236934760
-83.647354287267
-34.1733318391274
-173.823942947993
-73.875639156739
210.262647467809
12.0182088210192
81.7904121784228
21.2408062528454
98.4532507446957
23.0070415597756
38.7578428826838
25.9583987533938
20.5390798543693
156.452826754994
68.2649120511577
-33.6125947943051
46.3663387062764
-91.9581208006455
63.1810600338415
-33.8432637693498
44.5006319383644
125.384010224179
64.26092669892
66.2587042626603
46.7296884071367
20.7068371913218
74.1589092882682
3.89871933973546
6.4083329049473
-48.3072163416454
46.2165635053244
51.7974338766063
73.8667706688829
-24.8969727605691
10.3432221235896
52.1644863923618
103.269725366625
134.629009342109
90.944690116328
71.8191223440983
-46.4330388456556
-72.641062090216
-212.570356912638
188.883418444020
86.8762790034635
80.4477165432978
142.490831226876
7.50376892691045
70.477746204643
105.091868414896
4.94827238150685
-162.592636585017
289.54716881654
27.0308297896353
-48.2065689122112
-61.7532708245486
-363.103900154236
192.847578011991
51.8420855349822
-354.568968120809
113.032679887154
-327.543768717531
-25.2972423963028
-13.9842916562490
151.379505428904
-122.805620057677
-251.632329701718
-380.072675681252
193.550833862201

\begin{tabular}{lllllllll}
\hline
Estimated ARIMA Residuals \tabularnewline
Value \tabularnewline
2.65980850180785 \tabularnewline
-20.0500591259591 \tabularnewline
86.4575258620098 \tabularnewline
-2.00317887752455 \tabularnewline
-9.42707157765429 \tabularnewline
78.1256067267605 \tabularnewline
-36.9498732989612 \tabularnewline
-229.619981036125 \tabularnewline
-174.488945246369 \tabularnewline
-33.566135185722 \tabularnewline
-136.771153463658 \tabularnewline
-80.4356579960752 \tabularnewline
128.092236934760 \tabularnewline
-83.647354287267 \tabularnewline
-34.1733318391274 \tabularnewline
-173.823942947993 \tabularnewline
-73.875639156739 \tabularnewline
210.262647467809 \tabularnewline
12.0182088210192 \tabularnewline
81.7904121784228 \tabularnewline
21.2408062528454 \tabularnewline
98.4532507446957 \tabularnewline
23.0070415597756 \tabularnewline
38.7578428826838 \tabularnewline
25.9583987533938 \tabularnewline
20.5390798543693 \tabularnewline
156.452826754994 \tabularnewline
68.2649120511577 \tabularnewline
-33.6125947943051 \tabularnewline
46.3663387062764 \tabularnewline
-91.9581208006455 \tabularnewline
63.1810600338415 \tabularnewline
-33.8432637693498 \tabularnewline
44.5006319383644 \tabularnewline
125.384010224179 \tabularnewline
64.26092669892 \tabularnewline
66.2587042626603 \tabularnewline
46.7296884071367 \tabularnewline
20.7068371913218 \tabularnewline
74.1589092882682 \tabularnewline
3.89871933973546 \tabularnewline
6.4083329049473 \tabularnewline
-48.3072163416454 \tabularnewline
46.2165635053244 \tabularnewline
51.7974338766063 \tabularnewline
73.8667706688829 \tabularnewline
-24.8969727605691 \tabularnewline
10.3432221235896 \tabularnewline
52.1644863923618 \tabularnewline
103.269725366625 \tabularnewline
134.629009342109 \tabularnewline
90.944690116328 \tabularnewline
71.8191223440983 \tabularnewline
-46.4330388456556 \tabularnewline
-72.641062090216 \tabularnewline
-212.570356912638 \tabularnewline
188.883418444020 \tabularnewline
86.8762790034635 \tabularnewline
80.4477165432978 \tabularnewline
142.490831226876 \tabularnewline
7.50376892691045 \tabularnewline
70.477746204643 \tabularnewline
105.091868414896 \tabularnewline
4.94827238150685 \tabularnewline
-162.592636585017 \tabularnewline
289.54716881654 \tabularnewline
27.0308297896353 \tabularnewline
-48.2065689122112 \tabularnewline
-61.7532708245486 \tabularnewline
-363.103900154236 \tabularnewline
192.847578011991 \tabularnewline
51.8420855349822 \tabularnewline
-354.568968120809 \tabularnewline
113.032679887154 \tabularnewline
-327.543768717531 \tabularnewline
-25.2972423963028 \tabularnewline
-13.9842916562490 \tabularnewline
151.379505428904 \tabularnewline
-122.805620057677 \tabularnewline
-251.632329701718 \tabularnewline
-380.072675681252 \tabularnewline
193.550833862201 \tabularnewline
\hline
\end{tabular}
%Source: https://freestatistics.org/blog/index.php?pk=33759&T=2

[TABLE]
[ROW][C]Estimated ARIMA Residuals[/C][/ROW]
[ROW][C]Value[/C][/ROW]
[ROW][C]2.65980850180785[/C][/ROW]
[ROW][C]-20.0500591259591[/C][/ROW]
[ROW][C]86.4575258620098[/C][/ROW]
[ROW][C]-2.00317887752455[/C][/ROW]
[ROW][C]-9.42707157765429[/C][/ROW]
[ROW][C]78.1256067267605[/C][/ROW]
[ROW][C]-36.9498732989612[/C][/ROW]
[ROW][C]-229.619981036125[/C][/ROW]
[ROW][C]-174.488945246369[/C][/ROW]
[ROW][C]-33.566135185722[/C][/ROW]
[ROW][C]-136.771153463658[/C][/ROW]
[ROW][C]-80.4356579960752[/C][/ROW]
[ROW][C]128.092236934760[/C][/ROW]
[ROW][C]-83.647354287267[/C][/ROW]
[ROW][C]-34.1733318391274[/C][/ROW]
[ROW][C]-173.823942947993[/C][/ROW]
[ROW][C]-73.875639156739[/C][/ROW]
[ROW][C]210.262647467809[/C][/ROW]
[ROW][C]12.0182088210192[/C][/ROW]
[ROW][C]81.7904121784228[/C][/ROW]
[ROW][C]21.2408062528454[/C][/ROW]
[ROW][C]98.4532507446957[/C][/ROW]
[ROW][C]23.0070415597756[/C][/ROW]
[ROW][C]38.7578428826838[/C][/ROW]
[ROW][C]25.9583987533938[/C][/ROW]
[ROW][C]20.5390798543693[/C][/ROW]
[ROW][C]156.452826754994[/C][/ROW]
[ROW][C]68.2649120511577[/C][/ROW]
[ROW][C]-33.6125947943051[/C][/ROW]
[ROW][C]46.3663387062764[/C][/ROW]
[ROW][C]-91.9581208006455[/C][/ROW]
[ROW][C]63.1810600338415[/C][/ROW]
[ROW][C]-33.8432637693498[/C][/ROW]
[ROW][C]44.5006319383644[/C][/ROW]
[ROW][C]125.384010224179[/C][/ROW]
[ROW][C]64.26092669892[/C][/ROW]
[ROW][C]66.2587042626603[/C][/ROW]
[ROW][C]46.7296884071367[/C][/ROW]
[ROW][C]20.7068371913218[/C][/ROW]
[ROW][C]74.1589092882682[/C][/ROW]
[ROW][C]3.89871933973546[/C][/ROW]
[ROW][C]6.4083329049473[/C][/ROW]
[ROW][C]-48.3072163416454[/C][/ROW]
[ROW][C]46.2165635053244[/C][/ROW]
[ROW][C]51.7974338766063[/C][/ROW]
[ROW][C]73.8667706688829[/C][/ROW]
[ROW][C]-24.8969727605691[/C][/ROW]
[ROW][C]10.3432221235896[/C][/ROW]
[ROW][C]52.1644863923618[/C][/ROW]
[ROW][C]103.269725366625[/C][/ROW]
[ROW][C]134.629009342109[/C][/ROW]
[ROW][C]90.944690116328[/C][/ROW]
[ROW][C]71.8191223440983[/C][/ROW]
[ROW][C]-46.4330388456556[/C][/ROW]
[ROW][C]-72.641062090216[/C][/ROW]
[ROW][C]-212.570356912638[/C][/ROW]
[ROW][C]188.883418444020[/C][/ROW]
[ROW][C]86.8762790034635[/C][/ROW]
[ROW][C]80.4477165432978[/C][/ROW]
[ROW][C]142.490831226876[/C][/ROW]
[ROW][C]7.50376892691045[/C][/ROW]
[ROW][C]70.477746204643[/C][/ROW]
[ROW][C]105.091868414896[/C][/ROW]
[ROW][C]4.94827238150685[/C][/ROW]
[ROW][C]-162.592636585017[/C][/ROW]
[ROW][C]289.54716881654[/C][/ROW]
[ROW][C]27.0308297896353[/C][/ROW]
[ROW][C]-48.2065689122112[/C][/ROW]
[ROW][C]-61.7532708245486[/C][/ROW]
[ROW][C]-363.103900154236[/C][/ROW]
[ROW][C]192.847578011991[/C][/ROW]
[ROW][C]51.8420855349822[/C][/ROW]
[ROW][C]-354.568968120809[/C][/ROW]
[ROW][C]113.032679887154[/C][/ROW]
[ROW][C]-327.543768717531[/C][/ROW]
[ROW][C]-25.2972423963028[/C][/ROW]
[ROW][C]-13.9842916562490[/C][/ROW]
[ROW][C]151.379505428904[/C][/ROW]
[ROW][C]-122.805620057677[/C][/ROW]
[ROW][C]-251.632329701718[/C][/ROW]
[ROW][C]-380.072675681252[/C][/ROW]
[ROW][C]193.550833862201[/C][/ROW]
[/TABLE]
Source: https://freestatistics.org/blog/index.php?pk=33759&T=2

Globally Unique Identifier (entire table): ba.freestatistics.org/blog/index.php?pk=33759&T=2

As an alternative you can also use a QR Code:  

The GUIDs for individual cells are displayed in the table below:

Estimated ARIMA Residuals
Value
2.65980850180785
-20.0500591259591
86.4575258620098
-2.00317887752455
-9.42707157765429
78.1256067267605
-36.9498732989612
-229.619981036125
-174.488945246369
-33.566135185722
-136.771153463658
-80.4356579960752
128.092236934760
-83.647354287267
-34.1733318391274
-173.823942947993
-73.875639156739
210.262647467809
12.0182088210192
81.7904121784228
21.2408062528454
98.4532507446957
23.0070415597756
38.7578428826838
25.9583987533938
20.5390798543693
156.452826754994
68.2649120511577
-33.6125947943051
46.3663387062764
-91.9581208006455
63.1810600338415
-33.8432637693498
44.5006319383644
125.384010224179
64.26092669892
66.2587042626603
46.7296884071367
20.7068371913218
74.1589092882682
3.89871933973546
6.4083329049473
-48.3072163416454
46.2165635053244
51.7974338766063
73.8667706688829
-24.8969727605691
10.3432221235896
52.1644863923618
103.269725366625
134.629009342109
90.944690116328
71.8191223440983
-46.4330388456556
-72.641062090216
-212.570356912638
188.883418444020
86.8762790034635
80.4477165432978
142.490831226876
7.50376892691045
70.477746204643
105.091868414896
4.94827238150685
-162.592636585017
289.54716881654
27.0308297896353
-48.2065689122112
-61.7532708245486
-363.103900154236
192.847578011991
51.8420855349822
-354.568968120809
113.032679887154
-327.543768717531
-25.2972423963028
-13.9842916562490
151.379505428904
-122.805620057677
-251.632329701718
-380.072675681252
193.550833862201


Parameters (Session):
par1 = FALSE ; par2 = 1 ; par3 = 1 ; par4 = 0 ; par5 = 12 ; par6 = 3 ; par7 = 1 ; par8 = 1 ; par9 = 1 ;
Parameters (R input):
par1 = FALSE ; par2 = 1 ; par3 = 1 ; par4 = 0 ; par5 = 12 ; par6 = 3 ; par7 = 1 ; par8 = 1 ; par9 = 1 ;
R code (references can be found in the software module):
library(lattice)
if (par1 == 'TRUE') par1 <- TRUE
if (par1 == 'FALSE') par1 <- FALSE
par2 <- as.numeric(par2) #Box-Cox lambda transformation parameter
par3 <- as.numeric(par3) #degree of non-seasonal differencing
par4 <- as.numeric(par4) #degree of seasonal differencing
par5 <- as.numeric(par5) #seasonal period
par6 <- as.numeric(par6) #degree (p) of the non-seasonal AR(p) polynomial
par7 <- as.numeric(par7) #degree (q) of the non-seasonal MA(q) polynomial
par8 <- as.numeric(par8) #degree (P) of the seasonal AR(P) polynomial
par9 <- as.numeric(par9) #degree (Q) of the seasonal MA(Q) polynomial
armaGR <- function(arima.out, names, n){
try1 <- arima.out$coef
try2 <- sqrt(diag(arima.out$var.coef))
try.data.frame <- data.frame(matrix(NA,ncol=4,nrow=length(names)))
dimnames(try.data.frame) <- list(names,c('coef','std','tstat','pv'))
try.data.frame[,1] <- try1
for(i in 1:length(try2)) try.data.frame[which(rownames(try.data.frame)==names(try2)[i]),2] <- try2[i]
try.data.frame[,3] <- try.data.frame[,1] / try.data.frame[,2]
try.data.frame[,4] <- round((1-pt(abs(try.data.frame[,3]),df=n-(length(try2)+1)))*2,5)
vector <- rep(NA,length(names))
vector[is.na(try.data.frame[,4])] <- 0
maxi <- which.max(try.data.frame[,4])
continue <- max(try.data.frame[,4],na.rm=TRUE) > .05
vector[maxi] <- 0
list(summary=try.data.frame,next.vector=vector,continue=continue)
}
arimaSelect <- function(series, order=c(13,0,0), seasonal=list(order=c(2,0,0),period=12), include.mean=F){
nrc <- order[1]+order[3]+seasonal$order[1]+seasonal$order[3]
coeff <- matrix(NA, nrow=nrc*2, ncol=nrc)
pval <- matrix(NA, nrow=nrc*2, ncol=nrc)
mylist <- rep(list(NULL), nrc)
names <- NULL
if(order[1] > 0) names <- paste('ar',1:order[1],sep='')
if(order[3] > 0) names <- c( names , paste('ma',1:order[3],sep='') )
if(seasonal$order[1] > 0) names <- c(names, paste('sar',1:seasonal$order[1],sep=''))
if(seasonal$order[3] > 0) names <- c(names, paste('sma',1:seasonal$order[3],sep=''))
arima.out <- arima(series, order=order, seasonal=seasonal, include.mean=include.mean, method='ML')
mylist[[1]] <- arima.out
last.arma <- armaGR(arima.out, names, length(series))
mystop <- FALSE
i <- 1
coeff[i,] <- last.arma[[1]][,1]
pval [i,] <- last.arma[[1]][,4]
i <- 2
aic <- arima.out$aic
while(!mystop){
mylist[[i]] <- arima.out
arima.out <- arima(series, order=order, seasonal=seasonal, include.mean=include.mean, method='ML', fixed=last.arma$next.vector)
aic <- c(aic, arima.out$aic)
last.arma <- armaGR(arima.out, names, length(series))
mystop <- !last.arma$continue
coeff[i,] <- last.arma[[1]][,1]
pval [i,] <- last.arma[[1]][,4]
i <- i+1
}
list(coeff, pval, mylist, aic=aic)
}
arimaSelectplot <- function(arimaSelect.out,noms,choix){
noms <- names(arimaSelect.out[[3]][[1]]$coef)
coeff <- arimaSelect.out[[1]]
k <- min(which(is.na(coeff[,1])))-1
coeff <- coeff[1:k,]
pval <- arimaSelect.out[[2]][1:k,]
aic <- arimaSelect.out$aic[1:k]
coeff[coeff==0] <- NA
n <- ncol(coeff)
if(missing(choix)) choix <- k
layout(matrix(c(1,1,1,2,
3,3,3,2,
3,3,3,4,
5,6,7,7),nr=4),
widths=c(10,35,45,15),
heights=c(30,30,15,15))
couleurs <- rainbow(75)[1:50]#(50)
ticks <- pretty(coeff)
par(mar=c(1,1,3,1))
plot(aic,k:1-.5,type='o',pch=21,bg='blue',cex=2,axes=F,lty=2,xpd=NA)
points(aic[choix],k-choix+.5,pch=21,cex=4,bg=2,xpd=NA)
title('aic',line=2)
par(mar=c(3,0,0,0))
plot(0,axes=F,xlab='',ylab='',xlim=range(ticks),ylim=c(.1,1))
rect(xleft = min(ticks) + (0:49)/50*(max(ticks)-min(ticks)),
xright = min(ticks) + (1:50)/50*(max(ticks)-min(ticks)),
ytop = rep(1,50),
ybottom= rep(0,50),col=couleurs,border=NA)
axis(1,ticks)
rect(xleft=min(ticks),xright=max(ticks),ytop=1,ybottom=0)
text(mean(coeff,na.rm=T),.5,'coefficients',cex=2,font=2)
par(mar=c(1,1,3,1))
image(1:n,1:k,t(coeff[k:1,]),axes=F,col=couleurs,zlim=range(ticks))
for(i in 1:n) for(j in 1:k) if(!is.na(coeff[j,i])) {
if(pval[j,i]<.01) symb = 'green'
else if( (pval[j,i]<.05) & (pval[j,i]>=.01)) symb = 'orange'
else if( (pval[j,i]<.1) & (pval[j,i]>=.05)) symb = 'red'
else symb = 'black'
polygon(c(i+.5 ,i+.2 ,i+.5 ,i+.5),
c(k-j+0.5,k-j+0.5,k-j+0.8,k-j+0.5),
col=symb)
if(j==choix) {
rect(xleft=i-.5,
xright=i+.5,
ybottom=k-j+1.5,
ytop=k-j+.5,
lwd=4)
text(i,
k-j+1,
round(coeff[j,i],2),
cex=1.2,
font=2)
}
else{
rect(xleft=i-.5,xright=i+.5,ybottom=k-j+1.5,ytop=k-j+.5)
text(i,k-j+1,round(coeff[j,i],2),cex=1.2,font=1)
}
}
axis(3,1:n,noms)
par(mar=c(0.5,0,0,0.5))
plot(0,axes=F,xlab='',ylab='',type='n',xlim=c(0,8),ylim=c(-.2,.8))
cols <- c('green','orange','red','black')
niv <- c('0','0.01','0.05','0.1')
for(i in 0:3){
polygon(c(1+2*i ,1+2*i ,1+2*i-.5 ,1+2*i),
c(.4 ,.7 , .4 , .4),
col=cols[i+1])
text(2*i,0.5,niv[i+1],cex=1.5)
}
text(8,.5,1,cex=1.5)
text(4,0,'p-value',cex=2)
box()
residus <- arimaSelect.out[[3]][[choix]]$res
par(mar=c(1,2,4,1))
acf(residus,main='')
title('acf',line=.5)
par(mar=c(1,2,4,1))
pacf(residus,main='')
title('pacf',line=.5)
par(mar=c(2,2,4,1))
qqnorm(residus,main='')
title('qq-norm',line=.5)
qqline(residus)
residus
}
if (par2 == 0) x <- log(x)
if (par2 != 0) x <- x^par2
(selection <- arimaSelect(x, order=c(par6,par3,par7), seasonal=list(order=c(par8,par4,par9), period=par5)))
bitmap(file='test1.png')
resid <- arimaSelectplot(selection)
dev.off()
resid
bitmap(file='test2.png')
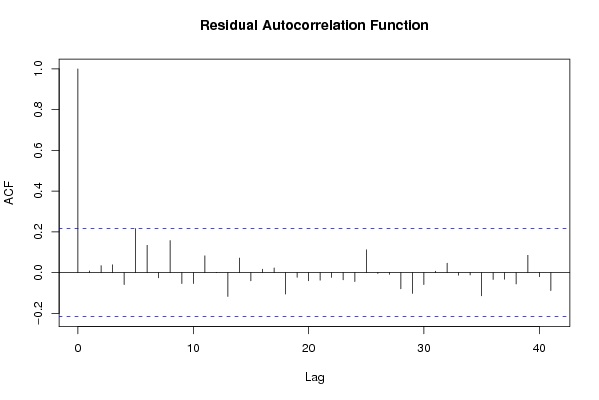
acf(resid,length(resid)/2, main='Residual Autocorrelation Function')
dev.off()
bitmap(file='test3.png')
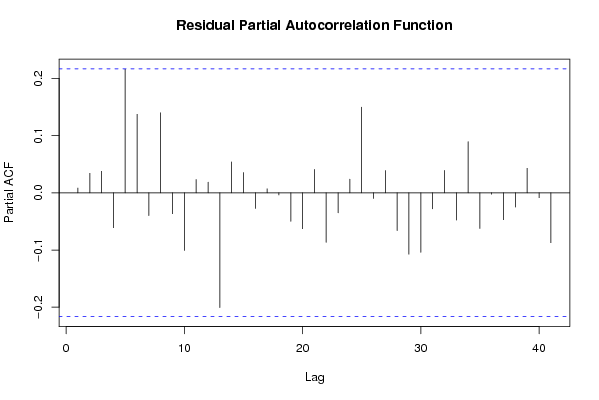
pacf(resid,length(resid)/2, main='Residual Partial Autocorrelation Function')
dev.off()
bitmap(file='test4.png')
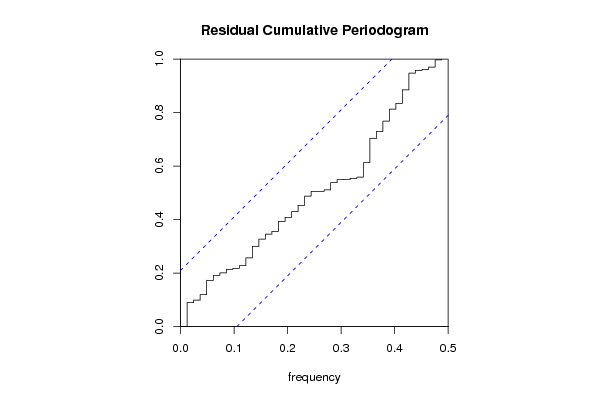
cpgram(resid, main='Residual Cumulative Periodogram')
dev.off()
bitmap(file='test5.png')
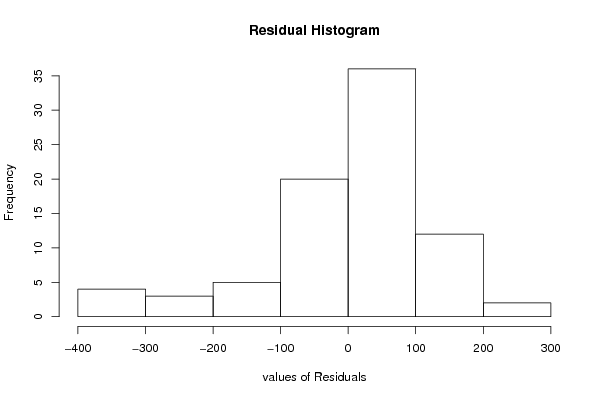
hist(resid, main='Residual Histogram', xlab='values of Residuals')
dev.off()
bitmap(file='test6.png')
densityplot(~resid,col='black',main='Residual Density Plot', xlab='values of Residuals')
dev.off()
bitmap(file='test7.png')
qqnorm(resid, main='Residual Normal Q-Q Plot')
qqline(resid)
dev.off()
ncols <- length(selection[[1]][1,])
nrows <- length(selection[[2]][,1])-1
load(file='createtable')
a<-table.start()
a<-table.row.start(a)
a<-table.element(a,'ARIMA Parameter Estimation and Backward Selection', ncols+1,TRUE)
a<-table.row.end(a)
a<-table.row.start(a)
a<-table.element(a,'Iteration', header=TRUE)
for (i in 1:ncols) {
a<-table.element(a,names(selection[[3]][[1]]$coef)[i],header=TRUE)
}
a<-table.row.end(a)
for (j in 1:nrows) {
a<-table.row.start(a)
mydum <- 'Estimates ('
mydum <- paste(mydum,j)
mydum <- paste(mydum,')')
a<-table.element(a,mydum, header=TRUE)
for (i in 1:ncols) {
a<-table.element(a,round(selection[[1]][j,i],4))
}
a<-table.row.end(a)
a<-table.row.start(a)
a<-table.element(a,'(p-val)', header=TRUE)
for (i in 1:ncols) {
mydum <- '('
mydum <- paste(mydum,round(selection[[2]][j,i],4),sep='')
mydum <- paste(mydum,')')
a<-table.element(a,mydum)
}
a<-table.row.end(a)
}
a<-table.end(a)
table.save(a,file='mytable.tab')
a<-table.start()
a<-table.row.start(a)
a<-table.element(a,'Estimated ARIMA Residuals', 1,TRUE)
a<-table.row.end(a)
a<-table.row.start(a)
a<-table.element(a,'Value', 1,TRUE)
a<-table.row.end(a)
for (i in (par4*par5+par3):length(resid)) {
a<-table.row.start(a)
a<-table.element(a,resid[i])
a<-table.row.end(a)
}
a<-table.end(a)
table.save(a,file='mytable1.tab')