Free Statistics

of Irreproducible Research!

Author's title

Author*Unverified author*
R Software Modulerwasp_arimaforecasting.wasp
Title produced by softwareARIMA Forecasting
Date of computationMon, 15 Dec 2008 10:32:11 -0700
Cite this page as followsStatistical Computations at FreeStatistics.org, Office for Research Development and Education, URL https://freestatistics.org/blog/index.php?v=date/2008/Dec/15/t1229362455qc8asajuvg67soj.htm/, Retrieved Thu, 16 May 2024 01:54:49 +0000
Statistical Computations at FreeStatistics.org, Office for Research Development and Education, URL https://freestatistics.org/blog/index.php?pk=33746, Retrieved Thu, 16 May 2024 01:54:49 +0000
QR Codes:

Original text written by user:
IsPrivate?No (this computation is public)
User-defined keywords
Estimated Impact180
Family? (F = Feedback message, R = changed R code, M = changed R Module, P = changed Parameters, D = changed Data)
-     [(Partial) Autocorrelation Function] [(P)ACF Transportm...] [2008-12-04 18:19:15] [65eec331235880e0070acfba94c20cfa]
F RMPD  [ARIMA Forecasting] [ARIMA Forecasting...] [2008-12-09 17:45:04] [74be16979710d4c4e7c6647856088456]
F   PD      [ARIMA Forecasting] [dfqsdfsq] [2008-12-15 17:32:11] [d41d8cd98f00b204e9800998ecf8427e] [Current]
Feedback Forum
2008-12-20 19:07:35 [Charis Berrevoets] [reply
Je begint met heel duidelijk uit te leggen wat de verschillende kolommen in de tabel voorstellen, dit is heel goed en ook helemaal juist. De voorspelde en de werkelijke waarden zijn inderdaad niet significant verschillend. Je had er nog bij kunnen vermelden dat die grotere p-waarden betekenen dat er een eerder grote kans is dat je je vergist bij het verwerpen van de nulhypothese en dat het verschil daarom niet significant is.
Er is inderdaad een stijgende trend. Dit had je ook nog kunnen zien aan P(F[t]>Y[t-1]). Deze zegt immers dat er telkens een stijging is ten opzichte van de vorige maand en dus een stijgende trend.
De volgende tabel heb je ook nog goed besproken, hoewel ik hier een aantal bemerkingen heb. Ten eerste is het niet zo dat je een goed model hebt omdat de %S.E. in stijgende lijn gaat. Het is inderdaad wel logisch dat deze stijgt naarmate je verder in de toekomst gaat voorspellen. Maar je hebt pas een goed model wanneer deze %S.E. nog niet te groot is aan het einde van de voorspelde periode. Hier zien we dat na een voorspelling van 12 maanden er theoretisch gezien bijna 18% kans is dat de voorspelling fout is. Dit is dus geen optimaal model maar nog wel goed. De kans op een fout lijkt me zeker nog aanvaardbaar.
De absolute waarde van PE moet inderdaad kleiner zijn dan de %S.E. Dit is omdat dit betekent dat de werkelijk gemeten fout na vergelijking met de werkelijke waarden kleiner is dan we verwacht hadden, wat uiteraard iets positief is.
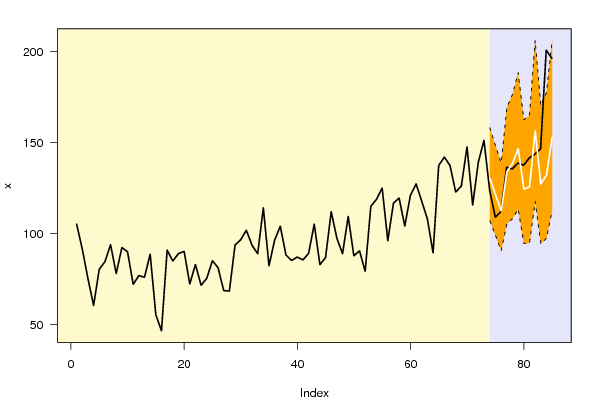
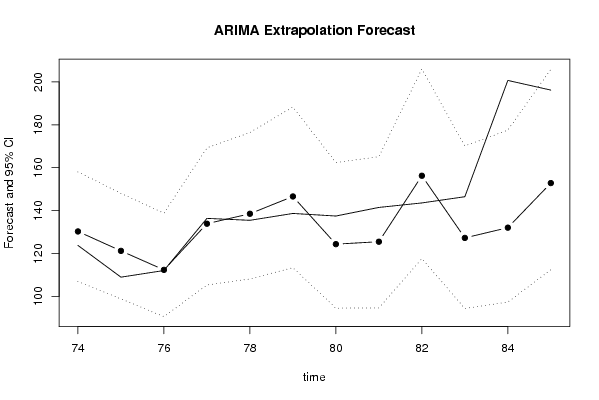
Ook de grafieken heb je goed besproken. Ik denk inderdaad dat je mag concluderen dat dit een redelijk betrouwbaar model is. Beide curven verlopen ook redelijk gelijklopend en binnen het betrouwbaarheidsinterval.
2008-12-24 11:40:17 [Anouk Greeve] [reply
Juiste berekening en goede interpretatie.
Mijn voorgaande collega vult het allemaal zeer goed aan. zelf zou ik nog vermeld hebben dat de grotere p-waarden inderdaad betekenen dat er een grotere kans is dat je je vergist bij het verwerpen van de nulhypothese en dat het verschil daarom niet significant is. De voorspelde waarden liggen binnen het betrouwbaarheidsinterval. We kunnen hieruit besluiten dat we niet te maken hebben met explosiviteit. De AR processen zijn stabiel en de MA processen zijn omkeerbaar. In de tabel kunnen we de theoretische schatting van de standaardfout op basis van het model aflezen (% SE). Daarnaast zien we de werkelijke fout (PE). Deze laatste is bijna altijd kleiner dan de voorspelde fout. Dit is een goed teken en wijst op een correct model.

Post a new message
Dataseries X:
105,2
91,5
75,3
60,5
80,4
84,5
93,9
78
92,3
90
72,1
76,9
76
88,7
55,4
46,6
90,9
84,9
89
90,2
72,3
83
71,6
75,4
85,1
81,2
68,7
68,4
93,7
96,6
101,8
93,6
88,9
114,1
82,3
96,4
104
88,2
85,2
87,1
85,5
89,1
105,2
82,9
86,8
112
97,4
88,9
109,4
87,8
90,5
79,3
114,9
118,8
125
96,1
116,7
119,5
104,1
121
127,3
117,7
108
89,4
137,4
142
137,3
122,8
126,1
147,6
115,7
139,2
151,2
123,8
109
112,1
136,4
135,5
138,7
137,5
141,5
143,6
146,5
200,7
196,2


Summary of computational transaction
Raw Inputview raw input (R code)
Raw Outputview raw output of R engine
Computing time5 seconds
R Server'Herman Ole Andreas Wold' @ 193.190.124.10:1001

\begin{tabular}{lllllllll}
\hline
Summary of computational transaction \tabularnewline
Raw Input & view raw input (R code)  \tabularnewline
Raw Output & view raw output of R engine  \tabularnewline
Computing time & 5 seconds \tabularnewline
R Server & 'Herman Ole Andreas Wold' @ 193.190.124.10:1001 \tabularnewline
\hline
\end{tabular}
%Source: https://freestatistics.org/blog/index.php?pk=33746&T=0

[TABLE]
[ROW][C]Summary of computational transaction[/C][/ROW]
[ROW][C]Raw Input[/C][C]view raw input (R code) [/C][/ROW]
[ROW][C]Raw Output[/C][C]view raw output of R engine [/C][/ROW]
[ROW][C]Computing time[/C][C]5 seconds[/C][/ROW]
[ROW][C]R Server[/C][C]'Herman Ole Andreas Wold' @ 193.190.124.10:1001[/C][/ROW]
[/TABLE]
Source: https://freestatistics.org/blog/index.php?pk=33746&T=0

Globally Unique Identifier (entire table): ba.freestatistics.org/blog/index.php?pk=33746&T=0

As an alternative you can also use a QR Code:  

The GUIDs for individual cells are displayed in the table below:

Summary of computational transaction
Raw Inputview raw input (R code)
Raw Outputview raw output of R engine
Computing time5 seconds
R Server'Herman Ole Andreas Wold' @ 193.190.124.10:1001


Univariate ARIMA Extrapolation Forecast
timeY[t]F[t]95% LB95% UBp-value(H0: Y[t] = F[t])P(F[t]>Y[t-1])P(F[t]>Y[t-s])P(F[t]>Y[73])
61127.3-------
62117.7-------
63108-------
6489.4-------
65137.400000000000-------
66142-------
67137.3-------
68122.8-------
69126.1-------
70147.6-------
71115.7-------
72139.2-------
73151.2-------
74123.8130.3123107.0201158.07170.32280.07010.81340.0701
75109121.257298.895148.07160.18510.42630.83370.0143
76112.1112.397390.5952138.8130.49120.59950.9560.002
77136.4133.9206105.3481169.28780.44540.88670.42350.1691
78135.5138.5556108.1718176.41560.43720.54440.42920.2564
79138.7146.6209113.4291188.31180.35480.69950.66940.4148
80137.5124.385994.562162.42340.24960.23040.53260.0835
81141.5125.530694.675165.1590.21480.27690.48880.1021
82143.6156.2707117.5909206.0470.30890.71960.63360.5791
83146.5127.293494.4064170.15430.18990.22790.7020.1371
84200.7132.073297.3842177.51190.00150.26690.37930.2047
85196.2152.8621112.4693205.87240.05450.03850.52450.5245

\begin{tabular}{lllllllll}
\hline
Univariate ARIMA Extrapolation Forecast \tabularnewline
time & Y[t] & F[t] & 95% LB & 95% UB & p-value(H0: Y[t] = F[t]) & P(F[t]>Y[t-1]) & P(F[t]>Y[t-s]) & P(F[t]>Y[73]) \tabularnewline
61 & 127.3 & - & - & - & - & - & - & - \tabularnewline
62 & 117.7 & - & - & - & - & - & - & - \tabularnewline
63 & 108 & - & - & - & - & - & - & - \tabularnewline
64 & 89.4 & - & - & - & - & - & - & - \tabularnewline
65 & 137.400000000000 & - & - & - & - & - & - & - \tabularnewline
66 & 142 & - & - & - & - & - & - & - \tabularnewline
67 & 137.3 & - & - & - & - & - & - & - \tabularnewline
68 & 122.8 & - & - & - & - & - & - & - \tabularnewline
69 & 126.1 & - & - & - & - & - & - & - \tabularnewline
70 & 147.6 & - & - & - & - & - & - & - \tabularnewline
71 & 115.7 & - & - & - & - & - & - & - \tabularnewline
72 & 139.2 & - & - & - & - & - & - & - \tabularnewline
73 & 151.2 & - & - & - & - & - & - & - \tabularnewline
74 & 123.8 & 130.3123 & 107.0201 & 158.0717 & 0.3228 & 0.0701 & 0.8134 & 0.0701 \tabularnewline
75 & 109 & 121.2572 & 98.895 & 148.0716 & 0.1851 & 0.4263 & 0.8337 & 0.0143 \tabularnewline
76 & 112.1 & 112.3973 & 90.5952 & 138.813 & 0.4912 & 0.5995 & 0.956 & 0.002 \tabularnewline
77 & 136.4 & 133.9206 & 105.3481 & 169.2878 & 0.4454 & 0.8867 & 0.4235 & 0.1691 \tabularnewline
78 & 135.5 & 138.5556 & 108.1718 & 176.4156 & 0.4372 & 0.5444 & 0.4292 & 0.2564 \tabularnewline
79 & 138.7 & 146.6209 & 113.4291 & 188.3118 & 0.3548 & 0.6995 & 0.6694 & 0.4148 \tabularnewline
80 & 137.5 & 124.3859 & 94.562 & 162.4234 & 0.2496 & 0.2304 & 0.5326 & 0.0835 \tabularnewline
81 & 141.5 & 125.5306 & 94.675 & 165.159 & 0.2148 & 0.2769 & 0.4888 & 0.1021 \tabularnewline
82 & 143.6 & 156.2707 & 117.5909 & 206.047 & 0.3089 & 0.7196 & 0.6336 & 0.5791 \tabularnewline
83 & 146.5 & 127.2934 & 94.4064 & 170.1543 & 0.1899 & 0.2279 & 0.702 & 0.1371 \tabularnewline
84 & 200.7 & 132.0732 & 97.3842 & 177.5119 & 0.0015 & 0.2669 & 0.3793 & 0.2047 \tabularnewline
85 & 196.2 & 152.8621 & 112.4693 & 205.8724 & 0.0545 & 0.0385 & 0.5245 & 0.5245 \tabularnewline
\hline
\end{tabular}
%Source: https://freestatistics.org/blog/index.php?pk=33746&T=1

[TABLE]
[ROW][C]Univariate ARIMA Extrapolation Forecast[/C][/ROW]
[ROW][C]time[/C][C]Y[t][/C][C]F[t][/C][C]95% LB[/C][C]95% UB[/C][C]p-value(H0: Y[t] = F[t])[/C][C]P(F[t]>Y[t-1])[/C][C]P(F[t]>Y[t-s])[/C][C]P(F[t]>Y[73])[/C][/ROW]
[ROW][C]61[/C][C]127.3[/C][C]-[/C][C]-[/C][C]-[/C][C]-[/C][C]-[/C][C]-[/C][C]-[/C][/ROW]
[ROW][C]62[/C][C]117.7[/C][C]-[/C][C]-[/C][C]-[/C][C]-[/C][C]-[/C][C]-[/C][C]-[/C][/ROW]
[ROW][C]63[/C][C]108[/C][C]-[/C][C]-[/C][C]-[/C][C]-[/C][C]-[/C][C]-[/C][C]-[/C][/ROW]
[ROW][C]64[/C][C]89.4[/C][C]-[/C][C]-[/C][C]-[/C][C]-[/C][C]-[/C][C]-[/C][C]-[/C][/ROW]
[ROW][C]65[/C][C]137.400000000000[/C][C]-[/C][C]-[/C][C]-[/C][C]-[/C][C]-[/C][C]-[/C][C]-[/C][/ROW]
[ROW][C]66[/C][C]142[/C][C]-[/C][C]-[/C][C]-[/C][C]-[/C][C]-[/C][C]-[/C][C]-[/C][/ROW]
[ROW][C]67[/C][C]137.3[/C][C]-[/C][C]-[/C][C]-[/C][C]-[/C][C]-[/C][C]-[/C][C]-[/C][/ROW]
[ROW][C]68[/C][C]122.8[/C][C]-[/C][C]-[/C][C]-[/C][C]-[/C][C]-[/C][C]-[/C][C]-[/C][/ROW]
[ROW][C]69[/C][C]126.1[/C][C]-[/C][C]-[/C][C]-[/C][C]-[/C][C]-[/C][C]-[/C][C]-[/C][/ROW]
[ROW][C]70[/C][C]147.6[/C][C]-[/C][C]-[/C][C]-[/C][C]-[/C][C]-[/C][C]-[/C][C]-[/C][/ROW]
[ROW][C]71[/C][C]115.7[/C][C]-[/C][C]-[/C][C]-[/C][C]-[/C][C]-[/C][C]-[/C][C]-[/C][/ROW]
[ROW][C]72[/C][C]139.2[/C][C]-[/C][C]-[/C][C]-[/C][C]-[/C][C]-[/C][C]-[/C][C]-[/C][/ROW]
[ROW][C]73[/C][C]151.2[/C][C]-[/C][C]-[/C][C]-[/C][C]-[/C][C]-[/C][C]-[/C][C]-[/C][/ROW]
[ROW][C]74[/C][C]123.8[/C][C]130.3123[/C][C]107.0201[/C][C]158.0717[/C][C]0.3228[/C][C]0.0701[/C][C]0.8134[/C][C]0.0701[/C][/ROW]
[ROW][C]75[/C][C]109[/C][C]121.2572[/C][C]98.895[/C][C]148.0716[/C][C]0.1851[/C][C]0.4263[/C][C]0.8337[/C][C]0.0143[/C][/ROW]
[ROW][C]76[/C][C]112.1[/C][C]112.3973[/C][C]90.5952[/C][C]138.813[/C][C]0.4912[/C][C]0.5995[/C][C]0.956[/C][C]0.002[/C][/ROW]
[ROW][C]77[/C][C]136.4[/C][C]133.9206[/C][C]105.3481[/C][C]169.2878[/C][C]0.4454[/C][C]0.8867[/C][C]0.4235[/C][C]0.1691[/C][/ROW]
[ROW][C]78[/C][C]135.5[/C][C]138.5556[/C][C]108.1718[/C][C]176.4156[/C][C]0.4372[/C][C]0.5444[/C][C]0.4292[/C][C]0.2564[/C][/ROW]
[ROW][C]79[/C][C]138.7[/C][C]146.6209[/C][C]113.4291[/C][C]188.3118[/C][C]0.3548[/C][C]0.6995[/C][C]0.6694[/C][C]0.4148[/C][/ROW]
[ROW][C]80[/C][C]137.5[/C][C]124.3859[/C][C]94.562[/C][C]162.4234[/C][C]0.2496[/C][C]0.2304[/C][C]0.5326[/C][C]0.0835[/C][/ROW]
[ROW][C]81[/C][C]141.5[/C][C]125.5306[/C][C]94.675[/C][C]165.159[/C][C]0.2148[/C][C]0.2769[/C][C]0.4888[/C][C]0.1021[/C][/ROW]
[ROW][C]82[/C][C]143.6[/C][C]156.2707[/C][C]117.5909[/C][C]206.047[/C][C]0.3089[/C][C]0.7196[/C][C]0.6336[/C][C]0.5791[/C][/ROW]
[ROW][C]83[/C][C]146.5[/C][C]127.2934[/C][C]94.4064[/C][C]170.1543[/C][C]0.1899[/C][C]0.2279[/C][C]0.702[/C][C]0.1371[/C][/ROW]
[ROW][C]84[/C][C]200.7[/C][C]132.0732[/C][C]97.3842[/C][C]177.5119[/C][C]0.0015[/C][C]0.2669[/C][C]0.3793[/C][C]0.2047[/C][/ROW]
[ROW][C]85[/C][C]196.2[/C][C]152.8621[/C][C]112.4693[/C][C]205.8724[/C][C]0.0545[/C][C]0.0385[/C][C]0.5245[/C][C]0.5245[/C][/ROW]
[/TABLE]
Source: https://freestatistics.org/blog/index.php?pk=33746&T=1

Globally Unique Identifier (entire table): ba.freestatistics.org/blog/index.php?pk=33746&T=1

As an alternative you can also use a QR Code:  

The GUIDs for individual cells are displayed in the table below:

Univariate ARIMA Extrapolation Forecast
timeY[t]F[t]95% LB95% UBp-value(H0: Y[t] = F[t])P(F[t]>Y[t-1])P(F[t]>Y[t-s])P(F[t]>Y[73])
61127.3-------
62117.7-------
63108-------
6489.4-------
65137.400000000000-------
66142-------
67137.3-------
68122.8-------
69126.1-------
70147.6-------
71115.7-------
72139.2-------
73151.2-------
74123.8130.3123107.0201158.07170.32280.07010.81340.0701
75109121.257298.895148.07160.18510.42630.83370.0143
76112.1112.397390.5952138.8130.49120.59950.9560.002
77136.4133.9206105.3481169.28780.44540.88670.42350.1691
78135.5138.5556108.1718176.41560.43720.54440.42920.2564
79138.7146.6209113.4291188.31180.35480.69950.66940.4148
80137.5124.385994.562162.42340.24960.23040.53260.0835
81141.5125.530694.675165.1590.21480.27690.48880.1021
82143.6156.2707117.5909206.0470.30890.71960.63360.5791
83146.5127.293494.4064170.15430.18990.22790.7020.1371
84200.7132.073297.3842177.51190.00150.26690.37930.2047
85196.2152.8621112.4693205.87240.05450.03850.52450.5245


Univariate ARIMA Extrapolation Forecast Performance
time% S.E.PEMAPESq.EMSERMSE
740.1087-0.050.004242.41013.53421.8799
750.1128-0.10110.0084150.238812.51993.5383
760.1199-0.00262e-040.08840.00740.0858
770.13470.01850.00156.14750.51230.7157
780.1394-0.02210.00189.33670.77810.8821
790.1451-0.0540.004562.74075.22842.2866
800.1560.10540.0088171.980614.33173.7857
810.16110.12720.0106255.021721.25184.61
820.1625-0.08110.0068160.547813.3793.6577
830.17180.15090.0126368.893930.74125.5445
840.17550.51960.04334709.643392.470319.8109
850.17690.28350.02361878.1697156.514112.5106

\begin{tabular}{lllllllll}
\hline
Univariate ARIMA Extrapolation Forecast Performance \tabularnewline
time & % S.E. & PE & MAPE & Sq.E & MSE & RMSE \tabularnewline
74 & 0.1087 & -0.05 & 0.0042 & 42.4101 & 3.5342 & 1.8799 \tabularnewline
75 & 0.1128 & -0.1011 & 0.0084 & 150.2388 & 12.5199 & 3.5383 \tabularnewline
76 & 0.1199 & -0.0026 & 2e-04 & 0.0884 & 0.0074 & 0.0858 \tabularnewline
77 & 0.1347 & 0.0185 & 0.0015 & 6.1475 & 0.5123 & 0.7157 \tabularnewline
78 & 0.1394 & -0.0221 & 0.0018 & 9.3367 & 0.7781 & 0.8821 \tabularnewline
79 & 0.1451 & -0.054 & 0.0045 & 62.7407 & 5.2284 & 2.2866 \tabularnewline
80 & 0.156 & 0.1054 & 0.0088 & 171.9806 & 14.3317 & 3.7857 \tabularnewline
81 & 0.1611 & 0.1272 & 0.0106 & 255.0217 & 21.2518 & 4.61 \tabularnewline
82 & 0.1625 & -0.0811 & 0.0068 & 160.5478 & 13.379 & 3.6577 \tabularnewline
83 & 0.1718 & 0.1509 & 0.0126 & 368.8939 & 30.7412 & 5.5445 \tabularnewline
84 & 0.1755 & 0.5196 & 0.0433 & 4709.643 & 392.4703 & 19.8109 \tabularnewline
85 & 0.1769 & 0.2835 & 0.0236 & 1878.1697 & 156.5141 & 12.5106 \tabularnewline
\hline
\end{tabular}
%Source: https://freestatistics.org/blog/index.php?pk=33746&T=2

[TABLE]
[ROW][C]Univariate ARIMA Extrapolation Forecast Performance[/C][/ROW]
[ROW][C]time[/C][C]% S.E.[/C][C]PE[/C][C]MAPE[/C][C]Sq.E[/C][C]MSE[/C][C]RMSE[/C][/ROW]
[ROW][C]74[/C][C]0.1087[/C][C]-0.05[/C][C]0.0042[/C][C]42.4101[/C][C]3.5342[/C][C]1.8799[/C][/ROW]
[ROW][C]75[/C][C]0.1128[/C][C]-0.1011[/C][C]0.0084[/C][C]150.2388[/C][C]12.5199[/C][C]3.5383[/C][/ROW]
[ROW][C]76[/C][C]0.1199[/C][C]-0.0026[/C][C]2e-04[/C][C]0.0884[/C][C]0.0074[/C][C]0.0858[/C][/ROW]
[ROW][C]77[/C][C]0.1347[/C][C]0.0185[/C][C]0.0015[/C][C]6.1475[/C][C]0.5123[/C][C]0.7157[/C][/ROW]
[ROW][C]78[/C][C]0.1394[/C][C]-0.0221[/C][C]0.0018[/C][C]9.3367[/C][C]0.7781[/C][C]0.8821[/C][/ROW]
[ROW][C]79[/C][C]0.1451[/C][C]-0.054[/C][C]0.0045[/C][C]62.7407[/C][C]5.2284[/C][C]2.2866[/C][/ROW]
[ROW][C]80[/C][C]0.156[/C][C]0.1054[/C][C]0.0088[/C][C]171.9806[/C][C]14.3317[/C][C]3.7857[/C][/ROW]
[ROW][C]81[/C][C]0.1611[/C][C]0.1272[/C][C]0.0106[/C][C]255.0217[/C][C]21.2518[/C][C]4.61[/C][/ROW]
[ROW][C]82[/C][C]0.1625[/C][C]-0.0811[/C][C]0.0068[/C][C]160.5478[/C][C]13.379[/C][C]3.6577[/C][/ROW]
[ROW][C]83[/C][C]0.1718[/C][C]0.1509[/C][C]0.0126[/C][C]368.8939[/C][C]30.7412[/C][C]5.5445[/C][/ROW]
[ROW][C]84[/C][C]0.1755[/C][C]0.5196[/C][C]0.0433[/C][C]4709.643[/C][C]392.4703[/C][C]19.8109[/C][/ROW]
[ROW][C]85[/C][C]0.1769[/C][C]0.2835[/C][C]0.0236[/C][C]1878.1697[/C][C]156.5141[/C][C]12.5106[/C][/ROW]
[/TABLE]
Source: https://freestatistics.org/blog/index.php?pk=33746&T=2

Globally Unique Identifier (entire table): ba.freestatistics.org/blog/index.php?pk=33746&T=2

As an alternative you can also use a QR Code:  

The GUIDs for individual cells are displayed in the table below:

Univariate ARIMA Extrapolation Forecast Performance
time% S.E.PEMAPESq.EMSERMSE
740.1087-0.050.004242.41013.53421.8799
750.1128-0.10110.0084150.238812.51993.5383
760.1199-0.00262e-040.08840.00740.0858
770.13470.01850.00156.14750.51230.7157
780.1394-0.02210.00189.33670.77810.8821
790.1451-0.0540.004562.74075.22842.2866
800.1560.10540.0088171.980614.33173.7857
810.16110.12720.0106255.021721.25184.61
820.1625-0.08110.0068160.547813.3793.6577
830.17180.15090.0126368.893930.74125.5445
840.17550.51960.04334709.643392.470319.8109
850.17690.28350.02361878.1697156.514112.5106


Parameters (Session):
par1 = 12 ; par2 = 0.1 ; par3 = 0 ; par4 = 1 ; par5 = 12 ; par6 = 3 ; par7 = 0 ; par8 = 2 ; par9 = 0 ; par10 = FALSE ;
Parameters (R input):
par1 = 12 ; par2 = 0.1 ; par3 = 0 ; par4 = 1 ; par5 = 12 ; par6 = 3 ; par7 = 0 ; par8 = 2 ; par9 = 0 ; par10 = FALSE ;
R code (references can be found in the software module):
par1 <- as.numeric(par1) #cut off periods
par2 <- as.numeric(par2) #lambda
par3 <- as.numeric(par3) #degree of non-seasonal differencing
par4 <- as.numeric(par4) #degree of seasonal differencing
par5 <- as.numeric(par5) #seasonal period
par6 <- as.numeric(par6) #p
par7 <- as.numeric(par7) #q
par8 <- as.numeric(par8) #P
par9 <- as.numeric(par9) #Q
if (par10 == 'TRUE') par10 <- TRUE
if (par10 == 'FALSE') par10 <- FALSE
if (par2 == 0) x <- log(x)
if (par2 != 0) x <- x^par2
lx <- length(x)
first <- lx - 2*par1
nx <- lx - par1
nx1 <- nx + 1
fx <- lx - nx
if (fx < 1) {
fx <- par5
nx1 <- lx + fx - 1
first <- lx - 2*fx
}
first <- 1
if (fx < 3) fx <- round(lx/10,0)
(arima.out <- arima(x[1:nx], order=c(par6,par3,par7), seasonal=list(order=c(par8,par4,par9), period=par5), include.mean=par10, method='ML'))
(forecast <- predict(arima.out,fx))
(lb <- forecast$pred - 1.96 * forecast$se)
(ub <- forecast$pred + 1.96 * forecast$se)
if (par2 == 0) {
x <- exp(x)
forecast$pred <- exp(forecast$pred)
lb <- exp(lb)
ub <- exp(ub)
}
if (par2 != 0) {
x <- x^(1/par2)
forecast$pred <- forecast$pred^(1/par2)
lb <- lb^(1/par2)
ub <- ub^(1/par2)
}
if (par2 < 0) {
olb <- lb
lb <- ub
ub <- olb
}
(actandfor <- c(x[1:nx], forecast$pred))
(perc.se <- (ub-forecast$pred)/1.96/forecast$pred)
bitmap(file='test1.png')
opar <- par(mar=c(4,4,2,2),las=1)
ylim <- c( min(x[first:nx],lb), max(x[first:nx],ub))
plot(x,ylim=ylim,type='n',xlim=c(first,lx))
usr <- par('usr')
rect(usr[1],usr[3],nx+1,usr[4],border=NA,col='lemonchiffon')
rect(nx1,usr[3],usr[2],usr[4],border=NA,col='lavender')
abline(h= (-3:3)*2 , col ='gray', lty =3)
polygon( c(nx1:lx,lx:nx1), c(lb,rev(ub)), col = 'orange', lty=2,border=NA)
lines(nx1:lx, lb , lty=2)
lines(nx1:lx, ub , lty=2)
lines(x, lwd=2)
lines(nx1:lx, forecast$pred , lwd=2 , col ='white')
box()
par(opar)
dev.off()
prob.dec <- array(NA, dim=fx)
prob.sdec <- array(NA, dim=fx)
prob.ldec <- array(NA, dim=fx)
prob.pval <- array(NA, dim=fx)
perf.pe <- array(0, dim=fx)
perf.mape <- array(0, dim=fx)
perf.se <- array(0, dim=fx)
perf.mse <- array(0, dim=fx)
perf.rmse <- array(0, dim=fx)
for (i in 1:fx) {
locSD <- (ub[i] - forecast$pred[i]) / 1.96
perf.pe[i] = (x[nx+i] - forecast$pred[i]) / forecast$pred[i]
perf.mape[i] = perf.mape[i] + abs(perf.pe[i])
perf.se[i] = (x[nx+i] - forecast$pred[i])^2
perf.mse[i] = perf.mse[i] + perf.se[i]
prob.dec[i] = pnorm((x[nx+i-1] - forecast$pred[i]) / locSD)
prob.sdec[i] = pnorm((x[nx+i-par5] - forecast$pred[i]) / locSD)
prob.ldec[i] = pnorm((x[nx] - forecast$pred[i]) / locSD)
prob.pval[i] = pnorm(abs(x[nx+i] - forecast$pred[i]) / locSD)
}
perf.mape = perf.mape / fx
perf.mse = perf.mse / fx
perf.rmse = sqrt(perf.mse)
bitmap(file='test2.png')
plot(forecast$pred, pch=19, type='b',main='ARIMA Extrapolation Forecast', ylab='Forecast and 95% CI', xlab='time',ylim=c(min(lb),max(ub)))
dum <- forecast$pred
dum[1:12] <- x[(nx+1):lx]
lines(dum, lty=1)
lines(ub,lty=3)
lines(lb,lty=3)
dev.off()
load(file='createtable')
a<-table.start()
a<-table.row.start(a)
a<-table.element(a,'Univariate ARIMA Extrapolation Forecast',9,TRUE)
a<-table.row.end(a)
a<-table.row.start(a)
a<-table.element(a,'time',1,header=TRUE)
a<-table.element(a,'Y[t]',1,header=TRUE)
a<-table.element(a,'F[t]',1,header=TRUE)
a<-table.element(a,'95% LB',1,header=TRUE)
a<-table.element(a,'95% UB',1,header=TRUE)
a<-table.element(a,'p-value
(H0: Y[t] = F[t])',1,header=TRUE)
a<-table.element(a,'P(F[t]>Y[t-1])',1,header=TRUE)
a<-table.element(a,'P(F[t]>Y[t-s])',1,header=TRUE)
mylab <- paste('P(F[t]>Y[',nx,sep='')
mylab <- paste(mylab,'])',sep='')
a<-table.element(a,mylab,1,header=TRUE)
a<-table.row.end(a)
for (i in (nx-par5):nx) {
a<-table.row.start(a)
a<-table.element(a,i,header=TRUE)
a<-table.element(a,x[i])
a<-table.element(a,'-')
a<-table.row.end(a)
}
for (i in 1:fx) {
a<-table.row.start(a)
a<-table.element(a,nx+i,header=TRUE)
a<-table.element(a,round(x[nx+i],4))
a<-table.element(a,round(forecast$pred[i],4))
a<-table.element(a,round(lb[i],4))
a<-table.element(a,round(ub[i],4))
a<-table.element(a,round((1-prob.pval[i]),4))
a<-table.element(a,round((1-prob.dec[i]),4))
a<-table.element(a,round((1-prob.sdec[i]),4))
a<-table.element(a,round((1-prob.ldec[i]),4))
a<-table.row.end(a)
}
a<-table.end(a)
table.save(a,file='mytable.tab')
a<-table.start()
a<-table.row.start(a)
a<-table.element(a,'Univariate ARIMA Extrapolation Forecast Performance',7,TRUE)
a<-table.row.end(a)
a<-table.row.start(a)
a<-table.element(a,'time',1,header=TRUE)
a<-table.element(a,'% S.E.',1,header=TRUE)
a<-table.element(a,'PE',1,header=TRUE)
a<-table.element(a,'MAPE',1,header=TRUE)
a<-table.element(a,'Sq.E',1,header=TRUE)
a<-table.element(a,'MSE',1,header=TRUE)
a<-table.element(a,'RMSE',1,header=TRUE)
a<-table.row.end(a)
for (i in 1:fx) {
a<-table.row.start(a)
a<-table.element(a,nx+i,header=TRUE)
a<-table.element(a,round(perc.se[i],4))
a<-table.element(a,round(perf.pe[i],4))
a<-table.element(a,round(perf.mape[i],4))
a<-table.element(a,round(perf.se[i],4))
a<-table.element(a,round(perf.mse[i],4))
a<-table.element(a,round(perf.rmse[i],4))
a<-table.row.end(a)
}
a<-table.end(a)
table.save(a,file='mytable1.tab')