Free Statistics

of Irreproducible Research!

Author's title

Author*The author of this computation has been verified*
R Software Modulerwasp_arimaforecasting.wasp
Title produced by softwareARIMA Forecasting
Date of computationMon, 15 Dec 2008 10:32:42 -0700
Cite this page as followsStatistical Computations at FreeStatistics.org, Office for Research Development and Education, URL https://freestatistics.org/blog/index.php?v=date/2008/Dec/15/t1229362411pppd50xij4y66gu.htm/, Retrieved Thu, 16 May 2024 00:39:34 +0000
Statistical Computations at FreeStatistics.org, Office for Research Development and Education, URL https://freestatistics.org/blog/index.php?pk=33745, Retrieved Thu, 16 May 2024 00:39:34 +0000
QR Codes:

Original text written by user:
IsPrivate?No (this computation is public)
User-defined keywords
Estimated Impact210
Family? (F = Feedback message, R = changed R code, M = changed R Module, P = changed Parameters, D = changed Data)
-     [ARIMA Backward Selection] [foutmelding arima...] [2008-12-12 15:06:09] [e43247bc0ab243a5af99ac7f55ba0b41]
F RMP     [ARIMA Forecasting] [stap 1 forecast] [2008-12-15 17:32:42] [f24298b2e4c2a19d76cf4460ec5d2246] [Current]
-    D      [ARIMA Forecasting] [voorspelling met ...] [2008-12-15 21:12:42] [e43247bc0ab243a5af99ac7f55ba0b41]
-   P       [ARIMA Forecasting] [arima forecast ma...] [2008-12-17 16:52:00] [e43247bc0ab243a5af99ac7f55ba0b41]
-   P         [ARIMA Forecasting] [forecast mannen j...] [2008-12-18 15:37:02] [e43247bc0ab243a5af99ac7f55ba0b41]
Feedback Forum
2008-12-22 16:37:35 [Lindsay Heyndrickx] [reply
Stap 1:
Hier werden de foute waarden gekozen. Deze forecast klopt dus totaal niet. Op de meeste vragen werd fout geantwoord. Stap 1 is de blog verkeerd. Dit had moeten geblogged worden: http://www.freestatistics.org/blog/date/2008/Dec/18/t1229614694yku8k4aoqbd6yvz.htm
De foute parameters werden ingevuld en de stepsize was nul ipv 12.
Stap2: Hier werd weer fout geantwoord. Hier is wel een trend en seizonaltiteit want anders hadden we geen AR of MA proces moeten toepassen. Het gaat hier over werkloosheid dus hier kunnen we een conjunctuurcyclus vaststellen.
Stap 3: Dit was correct.
Stap 4: Bij de interpretatie moet men rekening houden met de grootste waarde. Als de probability op een stijging groter is dan de probability op een daling, dan zal de waarde van P(F[t]>Y[t-1]) het grootst zijn. De waarden van P(F[t]>Y[t-1]) is altijd groter dan 0.5 dus we kunnen hier zeggen dat er meer kans is op een stijging dan op een daling.
Hier hadden we naar de P- waarde moeten kijken. Als we naar de juiste blog kijken (zie hierboven) zien we dat de P-waarde overal ( behalve in de eerste twee maanden van de voorspelling) groter is dan 5%..
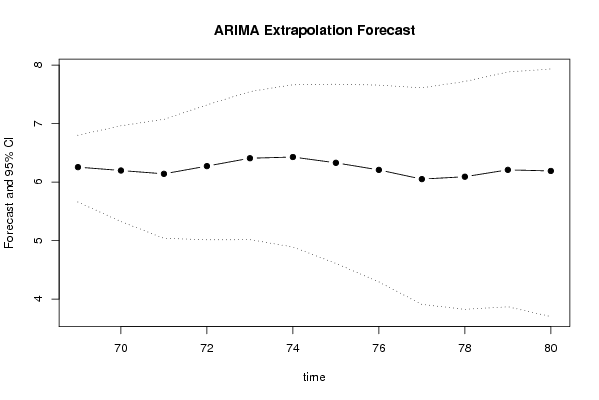
Stap 5: Deze vraag werd volledig fout begrepen. Dit komt ook door de foute grafiek. Als we naar de juiste grafieken kijken zien we dat de zwarte lijn en de witte lijn binnen het betrouwbaarheidsinterval liggen. Het betrouwbaarheidsinterval is wel zeer groot dus er is meer kans dat er fouten worden gemaakt.
De werkelijke waarden bevinden zich op elk ogenblik bij een seasonal period van 12 onder de geschatte waarden. Meestal ligt hier de absolute waarde van de werkelijke voorspellingsfout onder de verwachte voorspellingsfout.

De eerste tabel 'Univariate ARIMA Extrapolation Forecast' dienen we als volgt te interpreteren.
Time: de maanden, (vb. Time:50: 50e observatie = 50ste maand van de tijdreeks)
Y(t): de werkelijke waarde van onze tijdreeks
F(t)= de voorspelling van de werkelijke waarden door de software (deze begint pas van Time 49 aangezien de testing period 12 maanden omvat)
95% LB & UB (lower en upper bound): dit is het alomgekende betrouwbaarheidsinterval. Met een zekerheid van 95% ligt de waarde van F(t) tussen deze 2 grenzen. Cf. wetmatigheid economie ceteris paribus.
p-value (H0: Y[t] = F[t]): de 0 Hypothese stelt hier dat Y(t) = F(t) (werkelijke waarde = voorspelde waarde). In de realiteit is dat zo goed als onmogelijk, verschil zal er altijd zijn. De software toetst hier echter of het verschil significant is of aan het toeval toe te wijzen is. Indien p-value onder de 5% dan is de voorspelde waarde significant verschillend van de werkelijke waarde. Onder de ceteris paribus voorwaarde impliceert dit dat bij een significant verschil, er een verklaring moet zijn.
P(F[t]>Y[t-1]): In deze kolom vinden we de kans dat er een stijging is wanneer we 1 periode vooruit gaan. (We werken hier dus met maanden).
P(F[t]>Y[t-s]): In deze kolom vinden we de kans dat er een stijging is t.o.v. dezelfde maand maar dan van het vorige jaar. Bij deze observaties zien we dat er over het algemeen de kans bestaat dat er een stijging is t.o.v. het vorige jaar.


Post a new message
Dataseries X:
7.8
7.6
7.5
7.6
7.5
7.3
7.6
7.5
7.6
7.9
7.9
8.1
8.2
8.0
7.5
6.8
6.5
6.6
7.6
8.0
8.0
7.7
7.5
7.6
7.7
7.9
7.8
7.5
7.5
7.1
7.5
7.5
7.6
7.7
7.7
7.9
8.1
8.2
8.2
8.1
7.9
7.3
6.9
6.6
6.7
6.9
7.0
7.1
7.2
7.1
6.9
7.0
6.8
6.4
6.7
6.7
6.4
6.3
6.2
6.5
6.8
6.8
6.5
6.3
5.9
5.9
6.4
6.4


Summary of computational transaction
Raw Inputview raw input (R code)
Raw Outputview raw output of R engine
Computing time1 seconds
R Server'Gwilym Jenkins' @ 72.249.127.135

\begin{tabular}{lllllllll}
\hline
Summary of computational transaction \tabularnewline
Raw Input & view raw input (R code)  \tabularnewline
Raw Output & view raw output of R engine  \tabularnewline
Computing time & 1 seconds \tabularnewline
R Server & 'Gwilym Jenkins' @ 72.249.127.135 \tabularnewline
\hline
\end{tabular}
%Source: https://freestatistics.org/blog/index.php?pk=33745&T=0

[TABLE]
[ROW][C]Summary of computational transaction[/C][/ROW]
[ROW][C]Raw Input[/C][C]view raw input (R code) [/C][/ROW]
[ROW][C]Raw Output[/C][C]view raw output of R engine [/C][/ROW]
[ROW][C]Computing time[/C][C]1 seconds[/C][/ROW]
[ROW][C]R Server[/C][C]'Gwilym Jenkins' @ 72.249.127.135[/C][/ROW]
[/TABLE]
Source: https://freestatistics.org/blog/index.php?pk=33745&T=0

Globally Unique Identifier (entire table): ba.freestatistics.org/blog/index.php?pk=33745&T=0

As an alternative you can also use a QR Code:  

The GUIDs for individual cells are displayed in the table below:

Summary of computational transaction
Raw Inputview raw input (R code)
Raw Outputview raw output of R engine
Computing time1 seconds
R Server'Gwilym Jenkins' @ 72.249.127.135


Univariate ARIMA Extrapolation Forecast
timeY[t]F[t]95% LB95% UBp-value(H0: Y[t] = F[t])P(F[t]>Y[t-1])P(F[t]>Y[t-s])P(F[t]>Y[68])
566.7-------
576.4-------
586.3-------
596.2-------
606.5-------
616.8-------
626.8-------
636.5-------
646.3-------
655.9-------
665.9-------
676.4-------
686.4-------
69NA6.25545.65856.8002NA0.30150.30150.3015
70NA6.19755.32456.9618NANA0.39630.3018
71NA6.14035.03837.0726NANA0.450.2925
72NA6.27295.01257.3194NANA0.33530.4059
73NA6.40755.01527.5471NANA0.24980.5051
74NA6.4284.88877.6642NANA0.27770.5177
75NA6.32894.60867.6728NANA0.40150.4587
76NA6.20774.29187.6584NANA0.45040.3975
77NA6.05033.90777.612NANA0.57480.3304
78NA6.09133.82287.7197NANA0.5910.3551
79NA6.20883.8687.8826NANA0.41140.4114
80NA6.18993.69847.9342NANA0.40670.4067

\begin{tabular}{lllllllll}
\hline
Univariate ARIMA Extrapolation Forecast \tabularnewline
time & Y[t] & F[t] & 95% LB & 95% UB & p-value(H0: Y[t] = F[t]) & P(F[t]>Y[t-1]) & P(F[t]>Y[t-s]) & P(F[t]>Y[68]) \tabularnewline
56 & 6.7 & - & - & - & - & - & - & - \tabularnewline
57 & 6.4 & - & - & - & - & - & - & - \tabularnewline
58 & 6.3 & - & - & - & - & - & - & - \tabularnewline
59 & 6.2 & - & - & - & - & - & - & - \tabularnewline
60 & 6.5 & - & - & - & - & - & - & - \tabularnewline
61 & 6.8 & - & - & - & - & - & - & - \tabularnewline
62 & 6.8 & - & - & - & - & - & - & - \tabularnewline
63 & 6.5 & - & - & - & - & - & - & - \tabularnewline
64 & 6.3 & - & - & - & - & - & - & - \tabularnewline
65 & 5.9 & - & - & - & - & - & - & - \tabularnewline
66 & 5.9 & - & - & - & - & - & - & - \tabularnewline
67 & 6.4 & - & - & - & - & - & - & - \tabularnewline
68 & 6.4 & - & - & - & - & - & - & - \tabularnewline
69 & NA & 6.2554 & 5.6585 & 6.8002 & NA & 0.3015 & 0.3015 & 0.3015 \tabularnewline
70 & NA & 6.1975 & 5.3245 & 6.9618 & NA & NA & 0.3963 & 0.3018 \tabularnewline
71 & NA & 6.1403 & 5.0383 & 7.0726 & NA & NA & 0.45 & 0.2925 \tabularnewline
72 & NA & 6.2729 & 5.0125 & 7.3194 & NA & NA & 0.3353 & 0.4059 \tabularnewline
73 & NA & 6.4075 & 5.0152 & 7.5471 & NA & NA & 0.2498 & 0.5051 \tabularnewline
74 & NA & 6.428 & 4.8887 & 7.6642 & NA & NA & 0.2777 & 0.5177 \tabularnewline
75 & NA & 6.3289 & 4.6086 & 7.6728 & NA & NA & 0.4015 & 0.4587 \tabularnewline
76 & NA & 6.2077 & 4.2918 & 7.6584 & NA & NA & 0.4504 & 0.3975 \tabularnewline
77 & NA & 6.0503 & 3.9077 & 7.612 & NA & NA & 0.5748 & 0.3304 \tabularnewline
78 & NA & 6.0913 & 3.8228 & 7.7197 & NA & NA & 0.591 & 0.3551 \tabularnewline
79 & NA & 6.2088 & 3.868 & 7.8826 & NA & NA & 0.4114 & 0.4114 \tabularnewline
80 & NA & 6.1899 & 3.6984 & 7.9342 & NA & NA & 0.4067 & 0.4067 \tabularnewline
\hline
\end{tabular}
%Source: https://freestatistics.org/blog/index.php?pk=33745&T=1

[TABLE]
[ROW][C]Univariate ARIMA Extrapolation Forecast[/C][/ROW]
[ROW][C]time[/C][C]Y[t][/C][C]F[t][/C][C]95% LB[/C][C]95% UB[/C][C]p-value(H0: Y[t] = F[t])[/C][C]P(F[t]>Y[t-1])[/C][C]P(F[t]>Y[t-s])[/C][C]P(F[t]>Y[68])[/C][/ROW]
[ROW][C]56[/C][C]6.7[/C][C]-[/C][C]-[/C][C]-[/C][C]-[/C][C]-[/C][C]-[/C][C]-[/C][/ROW]
[ROW][C]57[/C][C]6.4[/C][C]-[/C][C]-[/C][C]-[/C][C]-[/C][C]-[/C][C]-[/C][C]-[/C][/ROW]
[ROW][C]58[/C][C]6.3[/C][C]-[/C][C]-[/C][C]-[/C][C]-[/C][C]-[/C][C]-[/C][C]-[/C][/ROW]
[ROW][C]59[/C][C]6.2[/C][C]-[/C][C]-[/C][C]-[/C][C]-[/C][C]-[/C][C]-[/C][C]-[/C][/ROW]
[ROW][C]60[/C][C]6.5[/C][C]-[/C][C]-[/C][C]-[/C][C]-[/C][C]-[/C][C]-[/C][C]-[/C][/ROW]
[ROW][C]61[/C][C]6.8[/C][C]-[/C][C]-[/C][C]-[/C][C]-[/C][C]-[/C][C]-[/C][C]-[/C][/ROW]
[ROW][C]62[/C][C]6.8[/C][C]-[/C][C]-[/C][C]-[/C][C]-[/C][C]-[/C][C]-[/C][C]-[/C][/ROW]
[ROW][C]63[/C][C]6.5[/C][C]-[/C][C]-[/C][C]-[/C][C]-[/C][C]-[/C][C]-[/C][C]-[/C][/ROW]
[ROW][C]64[/C][C]6.3[/C][C]-[/C][C]-[/C][C]-[/C][C]-[/C][C]-[/C][C]-[/C][C]-[/C][/ROW]
[ROW][C]65[/C][C]5.9[/C][C]-[/C][C]-[/C][C]-[/C][C]-[/C][C]-[/C][C]-[/C][C]-[/C][/ROW]
[ROW][C]66[/C][C]5.9[/C][C]-[/C][C]-[/C][C]-[/C][C]-[/C][C]-[/C][C]-[/C][C]-[/C][/ROW]
[ROW][C]67[/C][C]6.4[/C][C]-[/C][C]-[/C][C]-[/C][C]-[/C][C]-[/C][C]-[/C][C]-[/C][/ROW]
[ROW][C]68[/C][C]6.4[/C][C]-[/C][C]-[/C][C]-[/C][C]-[/C][C]-[/C][C]-[/C][C]-[/C][/ROW]
[ROW][C]69[/C][C]NA[/C][C]6.2554[/C][C]5.6585[/C][C]6.8002[/C][C]NA[/C][C]0.3015[/C][C]0.3015[/C][C]0.3015[/C][/ROW]
[ROW][C]70[/C][C]NA[/C][C]6.1975[/C][C]5.3245[/C][C]6.9618[/C][C]NA[/C][C]NA[/C][C]0.3963[/C][C]0.3018[/C][/ROW]
[ROW][C]71[/C][C]NA[/C][C]6.1403[/C][C]5.0383[/C][C]7.0726[/C][C]NA[/C][C]NA[/C][C]0.45[/C][C]0.2925[/C][/ROW]
[ROW][C]72[/C][C]NA[/C][C]6.2729[/C][C]5.0125[/C][C]7.3194[/C][C]NA[/C][C]NA[/C][C]0.3353[/C][C]0.4059[/C][/ROW]
[ROW][C]73[/C][C]NA[/C][C]6.4075[/C][C]5.0152[/C][C]7.5471[/C][C]NA[/C][C]NA[/C][C]0.2498[/C][C]0.5051[/C][/ROW]
[ROW][C]74[/C][C]NA[/C][C]6.428[/C][C]4.8887[/C][C]7.6642[/C][C]NA[/C][C]NA[/C][C]0.2777[/C][C]0.5177[/C][/ROW]
[ROW][C]75[/C][C]NA[/C][C]6.3289[/C][C]4.6086[/C][C]7.6728[/C][C]NA[/C][C]NA[/C][C]0.4015[/C][C]0.4587[/C][/ROW]
[ROW][C]76[/C][C]NA[/C][C]6.2077[/C][C]4.2918[/C][C]7.6584[/C][C]NA[/C][C]NA[/C][C]0.4504[/C][C]0.3975[/C][/ROW]
[ROW][C]77[/C][C]NA[/C][C]6.0503[/C][C]3.9077[/C][C]7.612[/C][C]NA[/C][C]NA[/C][C]0.5748[/C][C]0.3304[/C][/ROW]
[ROW][C]78[/C][C]NA[/C][C]6.0913[/C][C]3.8228[/C][C]7.7197[/C][C]NA[/C][C]NA[/C][C]0.591[/C][C]0.3551[/C][/ROW]
[ROW][C]79[/C][C]NA[/C][C]6.2088[/C][C]3.868[/C][C]7.8826[/C][C]NA[/C][C]NA[/C][C]0.4114[/C][C]0.4114[/C][/ROW]
[ROW][C]80[/C][C]NA[/C][C]6.1899[/C][C]3.6984[/C][C]7.9342[/C][C]NA[/C][C]NA[/C][C]0.4067[/C][C]0.4067[/C][/ROW]
[/TABLE]
Source: https://freestatistics.org/blog/index.php?pk=33745&T=1

Globally Unique Identifier (entire table): ba.freestatistics.org/blog/index.php?pk=33745&T=1

As an alternative you can also use a QR Code:  

The GUIDs for individual cells are displayed in the table below:

Univariate ARIMA Extrapolation Forecast
timeY[t]F[t]95% LB95% UBp-value(H0: Y[t] = F[t])P(F[t]>Y[t-1])P(F[t]>Y[t-s])P(F[t]>Y[68])
566.7-------
576.4-------
586.3-------
596.2-------
606.5-------
616.8-------
626.8-------
636.5-------
646.3-------
655.9-------
665.9-------
676.4-------
686.4-------
69NA6.25545.65856.8002NA0.30150.30150.3015
70NA6.19755.32456.9618NANA0.39630.3018
71NA6.14035.03837.0726NANA0.450.2925
72NA6.27295.01257.3194NANA0.33530.4059
73NA6.40755.01527.5471NANA0.24980.5051
74NA6.4284.88877.6642NANA0.27770.5177
75NA6.32894.60867.6728NANA0.40150.4587
76NA6.20774.29187.6584NANA0.45040.3975
77NA6.05033.90777.612NANA0.57480.3304
78NA6.09133.82287.7197NANA0.5910.3551
79NA6.20883.8687.8826NANA0.41140.4114
80NA6.18993.69847.9342NANA0.40670.4067


Univariate ARIMA Extrapolation Forecast Performance
time% S.E.PEMAPESq.EMSERMSE
690.0444NANANANANA
700.0629NANANANANA
710.0775NANANANANA
720.0851NANANANANA
730.0907NANANANANA
740.0981NANANANANA
750.1083NANANANANA
760.1192NANANANANA
770.1317NANANANANA
780.1364NANANANANA
790.1376NANANANANA
800.1438NANANANANA

\begin{tabular}{lllllllll}
\hline
Univariate ARIMA Extrapolation Forecast Performance \tabularnewline
time & % S.E. & PE & MAPE & Sq.E & MSE & RMSE \tabularnewline
69 & 0.0444 & NA & NA & NA & NA & NA \tabularnewline
70 & 0.0629 & NA & NA & NA & NA & NA \tabularnewline
71 & 0.0775 & NA & NA & NA & NA & NA \tabularnewline
72 & 0.0851 & NA & NA & NA & NA & NA \tabularnewline
73 & 0.0907 & NA & NA & NA & NA & NA \tabularnewline
74 & 0.0981 & NA & NA & NA & NA & NA \tabularnewline
75 & 0.1083 & NA & NA & NA & NA & NA \tabularnewline
76 & 0.1192 & NA & NA & NA & NA & NA \tabularnewline
77 & 0.1317 & NA & NA & NA & NA & NA \tabularnewline
78 & 0.1364 & NA & NA & NA & NA & NA \tabularnewline
79 & 0.1376 & NA & NA & NA & NA & NA \tabularnewline
80 & 0.1438 & NA & NA & NA & NA & NA \tabularnewline
\hline
\end{tabular}
%Source: https://freestatistics.org/blog/index.php?pk=33745&T=2

[TABLE]
[ROW][C]Univariate ARIMA Extrapolation Forecast Performance[/C][/ROW]
[ROW][C]time[/C][C]% S.E.[/C][C]PE[/C][C]MAPE[/C][C]Sq.E[/C][C]MSE[/C][C]RMSE[/C][/ROW]
[ROW][C]69[/C][C]0.0444[/C][C]NA[/C][C]NA[/C][C]NA[/C][C]NA[/C][C]NA[/C][/ROW]
[ROW][C]70[/C][C]0.0629[/C][C]NA[/C][C]NA[/C][C]NA[/C][C]NA[/C][C]NA[/C][/ROW]
[ROW][C]71[/C][C]0.0775[/C][C]NA[/C][C]NA[/C][C]NA[/C][C]NA[/C][C]NA[/C][/ROW]
[ROW][C]72[/C][C]0.0851[/C][C]NA[/C][C]NA[/C][C]NA[/C][C]NA[/C][C]NA[/C][/ROW]
[ROW][C]73[/C][C]0.0907[/C][C]NA[/C][C]NA[/C][C]NA[/C][C]NA[/C][C]NA[/C][/ROW]
[ROW][C]74[/C][C]0.0981[/C][C]NA[/C][C]NA[/C][C]NA[/C][C]NA[/C][C]NA[/C][/ROW]
[ROW][C]75[/C][C]0.1083[/C][C]NA[/C][C]NA[/C][C]NA[/C][C]NA[/C][C]NA[/C][/ROW]
[ROW][C]76[/C][C]0.1192[/C][C]NA[/C][C]NA[/C][C]NA[/C][C]NA[/C][C]NA[/C][/ROW]
[ROW][C]77[/C][C]0.1317[/C][C]NA[/C][C]NA[/C][C]NA[/C][C]NA[/C][C]NA[/C][/ROW]
[ROW][C]78[/C][C]0.1364[/C][C]NA[/C][C]NA[/C][C]NA[/C][C]NA[/C][C]NA[/C][/ROW]
[ROW][C]79[/C][C]0.1376[/C][C]NA[/C][C]NA[/C][C]NA[/C][C]NA[/C][C]NA[/C][/ROW]
[ROW][C]80[/C][C]0.1438[/C][C]NA[/C][C]NA[/C][C]NA[/C][C]NA[/C][C]NA[/C][/ROW]
[/TABLE]
Source: https://freestatistics.org/blog/index.php?pk=33745&T=2

Globally Unique Identifier (entire table): ba.freestatistics.org/blog/index.php?pk=33745&T=2

As an alternative you can also use a QR Code:  

The GUIDs for individual cells are displayed in the table below:

Univariate ARIMA Extrapolation Forecast Performance
time% S.E.PEMAPESq.EMSERMSE
690.0444NANANANANA
700.0629NANANANANA
710.0775NANANANANA
720.0851NANANANANA
730.0907NANANANANA
740.0981NANANANANA
750.1083NANANANANA
760.1192NANANANANA
770.1317NANANANANA
780.1364NANANANANA
790.1376NANANANANA
800.1438NANANANANA


Parameters (Session):
par1 = 0 ; par2 = 2.0 ; par3 = 1 ; par4 = 0 ; par5 = 12 ; par6 = 0 ; par7 = 0 ; par8 = 0 ; par9 = 1 ; par10 = FALSE ;
Parameters (R input):
par1 = 0 ; par2 = 2.0 ; par3 = 1 ; par4 = 0 ; par5 = 12 ; par6 = 0 ; par7 = 0 ; par8 = 0 ; par9 = 1 ; par10 = FALSE ;
R code (references can be found in the software module):
par1 <- as.numeric(par1) #cut off periods
par2 <- as.numeric(par2) #lambda
par3 <- as.numeric(par3) #degree of non-seasonal differencing
par4 <- as.numeric(par4) #degree of seasonal differencing
par5 <- as.numeric(par5) #seasonal period
par6 <- as.numeric(par6) #p
par7 <- as.numeric(par7) #q
par8 <- as.numeric(par8) #P
par9 <- as.numeric(par9) #Q
if (par10 == 'TRUE') par10 <- TRUE
if (par10 == 'FALSE') par10 <- FALSE
if (par2 == 0) x <- log(x)
if (par2 != 0) x <- x^par2
lx <- length(x)
first <- lx - 2*par1
nx <- lx - par1
nx1 <- nx + 1
fx <- lx - nx
if (fx < 1) {
fx <- par5
nx1 <- lx + fx - 1
first <- lx - 2*fx
}
first <- 1
if (fx < 3) fx <- round(lx/10,0)
(arima.out <- arima(x[1:nx], order=c(par6,par3,par7), seasonal=list(order=c(par8,par4,par9), period=par5), include.mean=par10, method='ML'))
(forecast <- predict(arima.out,fx))
(lb <- forecast$pred - 1.96 * forecast$se)
(ub <- forecast$pred + 1.96 * forecast$se)
if (par2 == 0) {
x <- exp(x)
forecast$pred <- exp(forecast$pred)
lb <- exp(lb)
ub <- exp(ub)
}
if (par2 != 0) {
x <- x^(1/par2)
forecast$pred <- forecast$pred^(1/par2)
lb <- lb^(1/par2)
ub <- ub^(1/par2)
}
if (par2 < 0) {
olb <- lb
lb <- ub
ub <- olb
}
(actandfor <- c(x[1:nx], forecast$pred))
(perc.se <- (ub-forecast$pred)/1.96/forecast$pred)
bitmap(file='test1.png')
opar <- par(mar=c(4,4,2,2),las=1)
ylim <- c( min(x[first:nx],lb), max(x[first:nx],ub))
plot(x,ylim=ylim,type='n',xlim=c(first,lx))
usr <- par('usr')
rect(usr[1],usr[3],nx+1,usr[4],border=NA,col='lemonchiffon')
rect(nx1,usr[3],usr[2],usr[4],border=NA,col='lavender')
abline(h= (-3:3)*2 , col ='gray', lty =3)
polygon( c(nx1:lx,lx:nx1), c(lb,rev(ub)), col = 'orange', lty=2,border=NA)
lines(nx1:lx, lb , lty=2)
lines(nx1:lx, ub , lty=2)
lines(x, lwd=2)
lines(nx1:lx, forecast$pred , lwd=2 , col ='white')
box()
par(opar)
dev.off()
prob.dec <- array(NA, dim=fx)
prob.sdec <- array(NA, dim=fx)
prob.ldec <- array(NA, dim=fx)
prob.pval <- array(NA, dim=fx)
perf.pe <- array(0, dim=fx)
perf.mape <- array(0, dim=fx)
perf.se <- array(0, dim=fx)
perf.mse <- array(0, dim=fx)
perf.rmse <- array(0, dim=fx)
for (i in 1:fx) {
locSD <- (ub[i] - forecast$pred[i]) / 1.96
perf.pe[i] = (x[nx+i] - forecast$pred[i]) / forecast$pred[i]
perf.mape[i] = perf.mape[i] + abs(perf.pe[i])
perf.se[i] = (x[nx+i] - forecast$pred[i])^2
perf.mse[i] = perf.mse[i] + perf.se[i]
prob.dec[i] = pnorm((x[nx+i-1] - forecast$pred[i]) / locSD)
prob.sdec[i] = pnorm((x[nx+i-par5] - forecast$pred[i]) / locSD)
prob.ldec[i] = pnorm((x[nx] - forecast$pred[i]) / locSD)
prob.pval[i] = pnorm(abs(x[nx+i] - forecast$pred[i]) / locSD)
}
perf.mape = perf.mape / fx
perf.mse = perf.mse / fx
perf.rmse = sqrt(perf.mse)
bitmap(file='test2.png')
plot(forecast$pred, pch=19, type='b',main='ARIMA Extrapolation Forecast', ylab='Forecast and 95% CI', xlab='time',ylim=c(min(lb),max(ub)))
dum <- forecast$pred
dum[1:12] <- x[(nx+1):lx]
lines(dum, lty=1)
lines(ub,lty=3)
lines(lb,lty=3)
dev.off()
load(file='createtable')
a<-table.start()
a<-table.row.start(a)
a<-table.element(a,'Univariate ARIMA Extrapolation Forecast',9,TRUE)
a<-table.row.end(a)
a<-table.row.start(a)
a<-table.element(a,'time',1,header=TRUE)
a<-table.element(a,'Y[t]',1,header=TRUE)
a<-table.element(a,'F[t]',1,header=TRUE)
a<-table.element(a,'95% LB',1,header=TRUE)
a<-table.element(a,'95% UB',1,header=TRUE)
a<-table.element(a,'p-value
(H0: Y[t] = F[t])',1,header=TRUE)
a<-table.element(a,'P(F[t]>Y[t-1])',1,header=TRUE)
a<-table.element(a,'P(F[t]>Y[t-s])',1,header=TRUE)
mylab <- paste('P(F[t]>Y[',nx,sep='')
mylab <- paste(mylab,'])',sep='')
a<-table.element(a,mylab,1,header=TRUE)
a<-table.row.end(a)
for (i in (nx-par5):nx) {
a<-table.row.start(a)
a<-table.element(a,i,header=TRUE)
a<-table.element(a,x[i])
a<-table.element(a,'-')
a<-table.row.end(a)
}
for (i in 1:fx) {
a<-table.row.start(a)
a<-table.element(a,nx+i,header=TRUE)
a<-table.element(a,round(x[nx+i],4))
a<-table.element(a,round(forecast$pred[i],4))
a<-table.element(a,round(lb[i],4))
a<-table.element(a,round(ub[i],4))
a<-table.element(a,round((1-prob.pval[i]),4))
a<-table.element(a,round((1-prob.dec[i]),4))
a<-table.element(a,round((1-prob.sdec[i]),4))
a<-table.element(a,round((1-prob.ldec[i]),4))
a<-table.row.end(a)
}
a<-table.end(a)
table.save(a,file='mytable.tab')
a<-table.start()
a<-table.row.start(a)
a<-table.element(a,'Univariate ARIMA Extrapolation Forecast Performance',7,TRUE)
a<-table.row.end(a)
a<-table.row.start(a)
a<-table.element(a,'time',1,header=TRUE)
a<-table.element(a,'% S.E.',1,header=TRUE)
a<-table.element(a,'PE',1,header=TRUE)
a<-table.element(a,'MAPE',1,header=TRUE)
a<-table.element(a,'Sq.E',1,header=TRUE)
a<-table.element(a,'MSE',1,header=TRUE)
a<-table.element(a,'RMSE',1,header=TRUE)
a<-table.row.end(a)
for (i in 1:fx) {
a<-table.row.start(a)
a<-table.element(a,nx+i,header=TRUE)
a<-table.element(a,round(perc.se[i],4))
a<-table.element(a,round(perf.pe[i],4))
a<-table.element(a,round(perf.mape[i],4))
a<-table.element(a,round(perf.se[i],4))
a<-table.element(a,round(perf.mse[i],4))
a<-table.element(a,round(perf.rmse[i],4))
a<-table.row.end(a)
}
a<-table.end(a)
table.save(a,file='mytable1.tab')