Free Statistics

of Irreproducible Research!

Author's title

Author*Unverified author*
R Software Modulerwasp_autocorrelation.wasp
Title produced by software(Partial) Autocorrelation Function
Date of computationMon, 15 Dec 2008 09:03:01 -0700
Cite this page as followsStatistical Computations at FreeStatistics.org, Office for Research Development and Education, URL https://freestatistics.org/blog/index.php?v=date/2008/Dec/15/t122935727573x7tsomxuf4p8x.htm/, Retrieved Wed, 15 May 2024 22:37:46 +0000
Statistical Computations at FreeStatistics.org, Office for Research Development and Education, URL https://freestatistics.org/blog/index.php?pk=33722, Retrieved Wed, 15 May 2024 22:37:46 +0000
QR Codes:

Original text written by user:
IsPrivate?No (this computation is public)
User-defined keywords
Estimated Impact154
Family? (F = Feedback message, R = changed R code, M = changed R Module, P = changed Parameters, D = changed Data)
F     [Law of Averages] [Random Walk Simul...] [2008-11-25 18:05:16] [b98453cac15ba1066b407e146608df68]
- RMPD    [(Partial) Autocorrelation Function] [] [2008-12-15 16:03:01] [86e877ba38171644c8ca01af8044e645] [Current]
Feedback Forum

Post a new message
Dataseries X:
118.3
127.3
112.3
114.9
108.2
105.4
122.1
113.5
110
125.3
114.3
115.6
127.1
123
122.2
126.4
112.7
105.8
120.9
116.3
115.7
127.9
108.3
121.1
128.6
123.1
127.7
126.6
118.4
110
129.6
115.8
125.9
128.4
114
125.6
128.5
136.6
133.1
124.6
123.5
117.2
135.5
124.8
127.8
133.1
125.7
128.4
131.9
146.3
140.6
129.5
132.4
125.9
126.9
135.8
129.5
130.2
133.8
123.3
140.6


Summary of computational transaction
Raw Inputview raw input (R code)
Raw Outputview raw output of R engine
Computing time4 seconds
R Server'Herman Ole Andreas Wold' @ 193.190.124.10:1001

\begin{tabular}{lllllllll}
\hline
Summary of computational transaction \tabularnewline
Raw Input & view raw input (R code)  \tabularnewline
Raw Output & view raw output of R engine  \tabularnewline
Computing time & 4 seconds \tabularnewline
R Server & 'Herman Ole Andreas Wold' @ 193.190.124.10:1001 \tabularnewline
\hline
\end{tabular}
%Source: https://freestatistics.org/blog/index.php?pk=33722&T=0

[TABLE]
[ROW][C]Summary of computational transaction[/C][/ROW]
[ROW][C]Raw Input[/C][C]view raw input (R code) [/C][/ROW]
[ROW][C]Raw Output[/C][C]view raw output of R engine [/C][/ROW]
[ROW][C]Computing time[/C][C]4 seconds[/C][/ROW]
[ROW][C]R Server[/C][C]'Herman Ole Andreas Wold' @ 193.190.124.10:1001[/C][/ROW]
[/TABLE]
Source: https://freestatistics.org/blog/index.php?pk=33722&T=0

Globally Unique Identifier (entire table): ba.freestatistics.org/blog/index.php?pk=33722&T=0

As an alternative you can also use a QR Code:  

The GUIDs for individual cells are displayed in the table below:

Summary of computational transaction
Raw Inputview raw input (R code)
Raw Outputview raw output of R engine
Computing time4 seconds
R Server'Herman Ole Andreas Wold' @ 193.190.124.10:1001


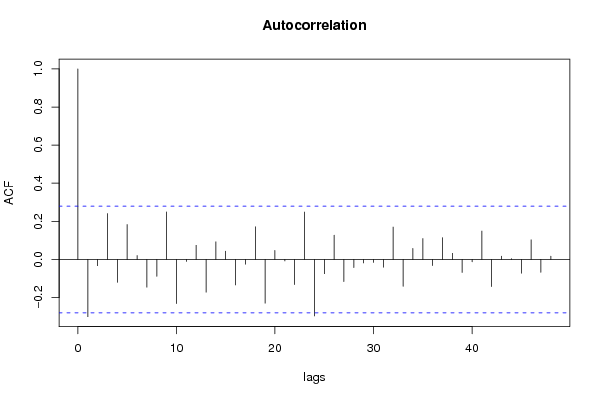
Autocorrelation Function
Time lag kACF(k)T-STATP-value
1-0.300328-2.10230.020345
2-0.032801-0.22960.409676
30.2407411.68520.049156
4-0.120291-0.8420.20193
50.1833651.28360.102667
60.0207030.14490.442683
7-0.146003-1.0220.155895
8-0.088697-0.62090.268777
90.2491781.74420.043693
10-0.231791-1.62250.055553
11-0.01079-0.07550.470051
120.0739930.5180.303411
13-0.171798-1.20260.117457
140.0924150.64690.260357
150.0432550.30280.381669
16-0.133617-0.93530.177106
17-0.02481-0.17370.43142
180.1713371.19940.118078
19-0.22964-1.60750.057187
200.0469790.32890.371835
21-0.007545-0.05280.479048
22-0.131826-0.92280.180322
230.2484731.73930.04413
24-0.296426-2.0750.02163
25-0.075083-0.52560.300775
260.1275920.89310.188073
27-0.116414-0.81490.209537
28-0.042881-0.30020.382659
29-0.018588-0.13010.448503
30-0.015528-0.10870.456945
31-0.040342-0.28240.389414
320.1698641.18910.120075
33-0.141315-0.98920.163712
340.0575820.40310.344324
350.1097580.76830.222995
36-0.032374-0.22660.410831
370.1145320.80170.213292
380.0319110.22340.412084
39-0.067944-0.47560.318234
40-0.012373-0.08660.465667
410.1489671.04280.151086
42-0.142644-0.99850.16147
430.0172730.12090.452129
440.003850.0270.489304
45-0.07219-0.50530.307797
460.1029160.72040.237348
47-0.067743-0.47420.318731
480.0170950.11970.452618
49NANANA
50NANANA
51NANANA
52NANANA
53NANANA
54NANANA
55NANANA
56NANANA
57NANANA
58NANANA
59NANANA
60NANANA

\begin{tabular}{lllllllll}
\hline
Autocorrelation Function \tabularnewline
Time lag k & ACF(k) & T-STAT & P-value \tabularnewline
1 & -0.300328 & -2.1023 & 0.020345 \tabularnewline
2 & -0.032801 & -0.2296 & 0.409676 \tabularnewline
3 & 0.240741 & 1.6852 & 0.049156 \tabularnewline
4 & -0.120291 & -0.842 & 0.20193 \tabularnewline
5 & 0.183365 & 1.2836 & 0.102667 \tabularnewline
6 & 0.020703 & 0.1449 & 0.442683 \tabularnewline
7 & -0.146003 & -1.022 & 0.155895 \tabularnewline
8 & -0.088697 & -0.6209 & 0.268777 \tabularnewline
9 & 0.249178 & 1.7442 & 0.043693 \tabularnewline
10 & -0.231791 & -1.6225 & 0.055553 \tabularnewline
11 & -0.01079 & -0.0755 & 0.470051 \tabularnewline
12 & 0.073993 & 0.518 & 0.303411 \tabularnewline
13 & -0.171798 & -1.2026 & 0.117457 \tabularnewline
14 & 0.092415 & 0.6469 & 0.260357 \tabularnewline
15 & 0.043255 & 0.3028 & 0.381669 \tabularnewline
16 & -0.133617 & -0.9353 & 0.177106 \tabularnewline
17 & -0.02481 & -0.1737 & 0.43142 \tabularnewline
18 & 0.171337 & 1.1994 & 0.118078 \tabularnewline
19 & -0.22964 & -1.6075 & 0.057187 \tabularnewline
20 & 0.046979 & 0.3289 & 0.371835 \tabularnewline
21 & -0.007545 & -0.0528 & 0.479048 \tabularnewline
22 & -0.131826 & -0.9228 & 0.180322 \tabularnewline
23 & 0.248473 & 1.7393 & 0.04413 \tabularnewline
24 & -0.296426 & -2.075 & 0.02163 \tabularnewline
25 & -0.075083 & -0.5256 & 0.300775 \tabularnewline
26 & 0.127592 & 0.8931 & 0.188073 \tabularnewline
27 & -0.116414 & -0.8149 & 0.209537 \tabularnewline
28 & -0.042881 & -0.3002 & 0.382659 \tabularnewline
29 & -0.018588 & -0.1301 & 0.448503 \tabularnewline
30 & -0.015528 & -0.1087 & 0.456945 \tabularnewline
31 & -0.040342 & -0.2824 & 0.389414 \tabularnewline
32 & 0.169864 & 1.1891 & 0.120075 \tabularnewline
33 & -0.141315 & -0.9892 & 0.163712 \tabularnewline
34 & 0.057582 & 0.4031 & 0.344324 \tabularnewline
35 & 0.109758 & 0.7683 & 0.222995 \tabularnewline
36 & -0.032374 & -0.2266 & 0.410831 \tabularnewline
37 & 0.114532 & 0.8017 & 0.213292 \tabularnewline
38 & 0.031911 & 0.2234 & 0.412084 \tabularnewline
39 & -0.067944 & -0.4756 & 0.318234 \tabularnewline
40 & -0.012373 & -0.0866 & 0.465667 \tabularnewline
41 & 0.148967 & 1.0428 & 0.151086 \tabularnewline
42 & -0.142644 & -0.9985 & 0.16147 \tabularnewline
43 & 0.017273 & 0.1209 & 0.452129 \tabularnewline
44 & 0.00385 & 0.027 & 0.489304 \tabularnewline
45 & -0.07219 & -0.5053 & 0.307797 \tabularnewline
46 & 0.102916 & 0.7204 & 0.237348 \tabularnewline
47 & -0.067743 & -0.4742 & 0.318731 \tabularnewline
48 & 0.017095 & 0.1197 & 0.452618 \tabularnewline
49 & NA & NA & NA \tabularnewline
50 & NA & NA & NA \tabularnewline
51 & NA & NA & NA \tabularnewline
52 & NA & NA & NA \tabularnewline
53 & NA & NA & NA \tabularnewline
54 & NA & NA & NA \tabularnewline
55 & NA & NA & NA \tabularnewline
56 & NA & NA & NA \tabularnewline
57 & NA & NA & NA \tabularnewline
58 & NA & NA & NA \tabularnewline
59 & NA & NA & NA \tabularnewline
60 & NA & NA & NA \tabularnewline
\hline
\end{tabular}
%Source: https://freestatistics.org/blog/index.php?pk=33722&T=1

[TABLE]
[ROW][C]Autocorrelation Function[/C][/ROW]
[ROW][C]Time lag k[/C][C]ACF(k)[/C][C]T-STAT[/C][C]P-value[/C][/ROW]
[ROW][C]1[/C][C]-0.300328[/C][C]-2.1023[/C][C]0.020345[/C][/ROW]
[ROW][C]2[/C][C]-0.032801[/C][C]-0.2296[/C][C]0.409676[/C][/ROW]
[ROW][C]3[/C][C]0.240741[/C][C]1.6852[/C][C]0.049156[/C][/ROW]
[ROW][C]4[/C][C]-0.120291[/C][C]-0.842[/C][C]0.20193[/C][/ROW]
[ROW][C]5[/C][C]0.183365[/C][C]1.2836[/C][C]0.102667[/C][/ROW]
[ROW][C]6[/C][C]0.020703[/C][C]0.1449[/C][C]0.442683[/C][/ROW]
[ROW][C]7[/C][C]-0.146003[/C][C]-1.022[/C][C]0.155895[/C][/ROW]
[ROW][C]8[/C][C]-0.088697[/C][C]-0.6209[/C][C]0.268777[/C][/ROW]
[ROW][C]9[/C][C]0.249178[/C][C]1.7442[/C][C]0.043693[/C][/ROW]
[ROW][C]10[/C][C]-0.231791[/C][C]-1.6225[/C][C]0.055553[/C][/ROW]
[ROW][C]11[/C][C]-0.01079[/C][C]-0.0755[/C][C]0.470051[/C][/ROW]
[ROW][C]12[/C][C]0.073993[/C][C]0.518[/C][C]0.303411[/C][/ROW]
[ROW][C]13[/C][C]-0.171798[/C][C]-1.2026[/C][C]0.117457[/C][/ROW]
[ROW][C]14[/C][C]0.092415[/C][C]0.6469[/C][C]0.260357[/C][/ROW]
[ROW][C]15[/C][C]0.043255[/C][C]0.3028[/C][C]0.381669[/C][/ROW]
[ROW][C]16[/C][C]-0.133617[/C][C]-0.9353[/C][C]0.177106[/C][/ROW]
[ROW][C]17[/C][C]-0.02481[/C][C]-0.1737[/C][C]0.43142[/C][/ROW]
[ROW][C]18[/C][C]0.171337[/C][C]1.1994[/C][C]0.118078[/C][/ROW]
[ROW][C]19[/C][C]-0.22964[/C][C]-1.6075[/C][C]0.057187[/C][/ROW]
[ROW][C]20[/C][C]0.046979[/C][C]0.3289[/C][C]0.371835[/C][/ROW]
[ROW][C]21[/C][C]-0.007545[/C][C]-0.0528[/C][C]0.479048[/C][/ROW]
[ROW][C]22[/C][C]-0.131826[/C][C]-0.9228[/C][C]0.180322[/C][/ROW]
[ROW][C]23[/C][C]0.248473[/C][C]1.7393[/C][C]0.04413[/C][/ROW]
[ROW][C]24[/C][C]-0.296426[/C][C]-2.075[/C][C]0.02163[/C][/ROW]
[ROW][C]25[/C][C]-0.075083[/C][C]-0.5256[/C][C]0.300775[/C][/ROW]
[ROW][C]26[/C][C]0.127592[/C][C]0.8931[/C][C]0.188073[/C][/ROW]
[ROW][C]27[/C][C]-0.116414[/C][C]-0.8149[/C][C]0.209537[/C][/ROW]
[ROW][C]28[/C][C]-0.042881[/C][C]-0.3002[/C][C]0.382659[/C][/ROW]
[ROW][C]29[/C][C]-0.018588[/C][C]-0.1301[/C][C]0.448503[/C][/ROW]
[ROW][C]30[/C][C]-0.015528[/C][C]-0.1087[/C][C]0.456945[/C][/ROW]
[ROW][C]31[/C][C]-0.040342[/C][C]-0.2824[/C][C]0.389414[/C][/ROW]
[ROW][C]32[/C][C]0.169864[/C][C]1.1891[/C][C]0.120075[/C][/ROW]
[ROW][C]33[/C][C]-0.141315[/C][C]-0.9892[/C][C]0.163712[/C][/ROW]
[ROW][C]34[/C][C]0.057582[/C][C]0.4031[/C][C]0.344324[/C][/ROW]
[ROW][C]35[/C][C]0.109758[/C][C]0.7683[/C][C]0.222995[/C][/ROW]
[ROW][C]36[/C][C]-0.032374[/C][C]-0.2266[/C][C]0.410831[/C][/ROW]
[ROW][C]37[/C][C]0.114532[/C][C]0.8017[/C][C]0.213292[/C][/ROW]
[ROW][C]38[/C][C]0.031911[/C][C]0.2234[/C][C]0.412084[/C][/ROW]
[ROW][C]39[/C][C]-0.067944[/C][C]-0.4756[/C][C]0.318234[/C][/ROW]
[ROW][C]40[/C][C]-0.012373[/C][C]-0.0866[/C][C]0.465667[/C][/ROW]
[ROW][C]41[/C][C]0.148967[/C][C]1.0428[/C][C]0.151086[/C][/ROW]
[ROW][C]42[/C][C]-0.142644[/C][C]-0.9985[/C][C]0.16147[/C][/ROW]
[ROW][C]43[/C][C]0.017273[/C][C]0.1209[/C][C]0.452129[/C][/ROW]
[ROW][C]44[/C][C]0.00385[/C][C]0.027[/C][C]0.489304[/C][/ROW]
[ROW][C]45[/C][C]-0.07219[/C][C]-0.5053[/C][C]0.307797[/C][/ROW]
[ROW][C]46[/C][C]0.102916[/C][C]0.7204[/C][C]0.237348[/C][/ROW]
[ROW][C]47[/C][C]-0.067743[/C][C]-0.4742[/C][C]0.318731[/C][/ROW]
[ROW][C]48[/C][C]0.017095[/C][C]0.1197[/C][C]0.452618[/C][/ROW]
[ROW][C]49[/C][C]NA[/C][C]NA[/C][C]NA[/C][/ROW]
[ROW][C]50[/C][C]NA[/C][C]NA[/C][C]NA[/C][/ROW]
[ROW][C]51[/C][C]NA[/C][C]NA[/C][C]NA[/C][/ROW]
[ROW][C]52[/C][C]NA[/C][C]NA[/C][C]NA[/C][/ROW]
[ROW][C]53[/C][C]NA[/C][C]NA[/C][C]NA[/C][/ROW]
[ROW][C]54[/C][C]NA[/C][C]NA[/C][C]NA[/C][/ROW]
[ROW][C]55[/C][C]NA[/C][C]NA[/C][C]NA[/C][/ROW]
[ROW][C]56[/C][C]NA[/C][C]NA[/C][C]NA[/C][/ROW]
[ROW][C]57[/C][C]NA[/C][C]NA[/C][C]NA[/C][/ROW]
[ROW][C]58[/C][C]NA[/C][C]NA[/C][C]NA[/C][/ROW]
[ROW][C]59[/C][C]NA[/C][C]NA[/C][C]NA[/C][/ROW]
[ROW][C]60[/C][C]NA[/C][C]NA[/C][C]NA[/C][/ROW]
[/TABLE]
Source: https://freestatistics.org/blog/index.php?pk=33722&T=1

Globally Unique Identifier (entire table): ba.freestatistics.org/blog/index.php?pk=33722&T=1

As an alternative you can also use a QR Code:  

The GUIDs for individual cells are displayed in the table below:

Autocorrelation Function
Time lag kACF(k)T-STATP-value
1-0.300328-2.10230.020345
2-0.032801-0.22960.409676
30.2407411.68520.049156
4-0.120291-0.8420.20193
50.1833651.28360.102667
60.0207030.14490.442683
7-0.146003-1.0220.155895
8-0.088697-0.62090.268777
90.2491781.74420.043693
10-0.231791-1.62250.055553
11-0.01079-0.07550.470051
120.0739930.5180.303411
13-0.171798-1.20260.117457
140.0924150.64690.260357
150.0432550.30280.381669
16-0.133617-0.93530.177106
17-0.02481-0.17370.43142
180.1713371.19940.118078
19-0.22964-1.60750.057187
200.0469790.32890.371835
21-0.007545-0.05280.479048
22-0.131826-0.92280.180322
230.2484731.73930.04413
24-0.296426-2.0750.02163
25-0.075083-0.52560.300775
260.1275920.89310.188073
27-0.116414-0.81490.209537
28-0.042881-0.30020.382659
29-0.018588-0.13010.448503
30-0.015528-0.10870.456945
31-0.040342-0.28240.389414
320.1698641.18910.120075
33-0.141315-0.98920.163712
340.0575820.40310.344324
350.1097580.76830.222995
36-0.032374-0.22660.410831
370.1145320.80170.213292
380.0319110.22340.412084
39-0.067944-0.47560.318234
40-0.012373-0.08660.465667
410.1489671.04280.151086
42-0.142644-0.99850.16147
430.0172730.12090.452129
440.003850.0270.489304
45-0.07219-0.50530.307797
460.1029160.72040.237348
47-0.067743-0.47420.318731
480.0170950.11970.452618
49NANANA
50NANANA
51NANANA
52NANANA
53NANANA
54NANANA
55NANANA
56NANANA
57NANANA
58NANANA
59NANANA
60NANANA


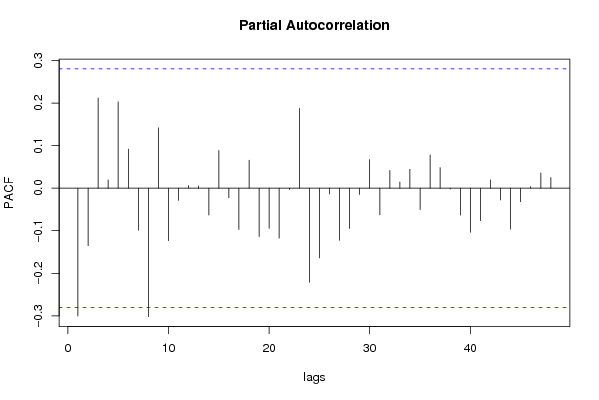
Partial Autocorrelation Function
Time lag kPACF(k)T-STATP-value
1-0.300328-2.10230.020345
2-0.135192-0.94630.174308
30.2115561.48090.072519
40.0191840.13430.446863
50.2029531.42070.080873
60.0916820.64180.262006
7-0.098987-0.69290.245818
8-0.301818-2.11270.019872
90.1418010.99260.16289
10-0.123527-0.86470.195711
11-0.028755-0.20130.420655
120.0062810.0440.482555
130.0053170.03720.485232
14-0.063203-0.44240.330065
150.0882540.61780.269791
16-0.0226-0.15820.437474
17-0.096885-0.67820.250418
180.065790.46050.323587
19-0.113676-0.79570.215013
20-0.094324-0.66030.256087
21-0.117521-0.82260.207347
22-0.003328-0.02330.490754
230.1871141.30980.098185
24-0.22091-1.54640.064225
25-0.163894-1.14730.128424
26-0.01384-0.09690.461609
27-0.122526-0.85770.197621
28-0.094816-0.66370.254992
29-0.015195-0.10640.457864
300.0672110.47050.32005
31-0.062749-0.43920.331208
320.0415870.29110.386099
330.0146460.10250.459382
340.0441690.30920.379246
35-0.050406-0.35280.36286
360.0779850.54590.293808
370.0482410.33770.36852
38-0.002248-0.01570.493754
39-0.063182-0.44230.33012
40-0.103729-0.72610.235614
41-0.076364-0.53450.29769
420.0192280.13460.446742
43-0.027683-0.19380.423574
44-0.09634-0.67440.25162
45-0.032133-0.22490.411484
460.0038460.02690.489315
470.035790.25050.401613
480.0248520.1740.431306
49NANANA
50NANANA
51NANANA
52NANANA
53NANANA
54NANANA
55NANANA
56NANANA
57NANANA
58NANANA
59NANANA
60NANANA

\begin{tabular}{lllllllll}
\hline
Partial Autocorrelation Function \tabularnewline
Time lag k & PACF(k) & T-STAT & P-value \tabularnewline
1 & -0.300328 & -2.1023 & 0.020345 \tabularnewline
2 & -0.135192 & -0.9463 & 0.174308 \tabularnewline
3 & 0.211556 & 1.4809 & 0.072519 \tabularnewline
4 & 0.019184 & 0.1343 & 0.446863 \tabularnewline
5 & 0.202953 & 1.4207 & 0.080873 \tabularnewline
6 & 0.091682 & 0.6418 & 0.262006 \tabularnewline
7 & -0.098987 & -0.6929 & 0.245818 \tabularnewline
8 & -0.301818 & -2.1127 & 0.019872 \tabularnewline
9 & 0.141801 & 0.9926 & 0.16289 \tabularnewline
10 & -0.123527 & -0.8647 & 0.195711 \tabularnewline
11 & -0.028755 & -0.2013 & 0.420655 \tabularnewline
12 & 0.006281 & 0.044 & 0.482555 \tabularnewline
13 & 0.005317 & 0.0372 & 0.485232 \tabularnewline
14 & -0.063203 & -0.4424 & 0.330065 \tabularnewline
15 & 0.088254 & 0.6178 & 0.269791 \tabularnewline
16 & -0.0226 & -0.1582 & 0.437474 \tabularnewline
17 & -0.096885 & -0.6782 & 0.250418 \tabularnewline
18 & 0.06579 & 0.4605 & 0.323587 \tabularnewline
19 & -0.113676 & -0.7957 & 0.215013 \tabularnewline
20 & -0.094324 & -0.6603 & 0.256087 \tabularnewline
21 & -0.117521 & -0.8226 & 0.207347 \tabularnewline
22 & -0.003328 & -0.0233 & 0.490754 \tabularnewline
23 & 0.187114 & 1.3098 & 0.098185 \tabularnewline
24 & -0.22091 & -1.5464 & 0.064225 \tabularnewline
25 & -0.163894 & -1.1473 & 0.128424 \tabularnewline
26 & -0.01384 & -0.0969 & 0.461609 \tabularnewline
27 & -0.122526 & -0.8577 & 0.197621 \tabularnewline
28 & -0.094816 & -0.6637 & 0.254992 \tabularnewline
29 & -0.015195 & -0.1064 & 0.457864 \tabularnewline
30 & 0.067211 & 0.4705 & 0.32005 \tabularnewline
31 & -0.062749 & -0.4392 & 0.331208 \tabularnewline
32 & 0.041587 & 0.2911 & 0.386099 \tabularnewline
33 & 0.014646 & 0.1025 & 0.459382 \tabularnewline
34 & 0.044169 & 0.3092 & 0.379246 \tabularnewline
35 & -0.050406 & -0.3528 & 0.36286 \tabularnewline
36 & 0.077985 & 0.5459 & 0.293808 \tabularnewline
37 & 0.048241 & 0.3377 & 0.36852 \tabularnewline
38 & -0.002248 & -0.0157 & 0.493754 \tabularnewline
39 & -0.063182 & -0.4423 & 0.33012 \tabularnewline
40 & -0.103729 & -0.7261 & 0.235614 \tabularnewline
41 & -0.076364 & -0.5345 & 0.29769 \tabularnewline
42 & 0.019228 & 0.1346 & 0.446742 \tabularnewline
43 & -0.027683 & -0.1938 & 0.423574 \tabularnewline
44 & -0.09634 & -0.6744 & 0.25162 \tabularnewline
45 & -0.032133 & -0.2249 & 0.411484 \tabularnewline
46 & 0.003846 & 0.0269 & 0.489315 \tabularnewline
47 & 0.03579 & 0.2505 & 0.401613 \tabularnewline
48 & 0.024852 & 0.174 & 0.431306 \tabularnewline
49 & NA & NA & NA \tabularnewline
50 & NA & NA & NA \tabularnewline
51 & NA & NA & NA \tabularnewline
52 & NA & NA & NA \tabularnewline
53 & NA & NA & NA \tabularnewline
54 & NA & NA & NA \tabularnewline
55 & NA & NA & NA \tabularnewline
56 & NA & NA & NA \tabularnewline
57 & NA & NA & NA \tabularnewline
58 & NA & NA & NA \tabularnewline
59 & NA & NA & NA \tabularnewline
60 & NA & NA & NA \tabularnewline
\hline
\end{tabular}
%Source: https://freestatistics.org/blog/index.php?pk=33722&T=2

[TABLE]
[ROW][C]Partial Autocorrelation Function[/C][/ROW]
[ROW][C]Time lag k[/C][C]PACF(k)[/C][C]T-STAT[/C][C]P-value[/C][/ROW]
[ROW][C]1[/C][C]-0.300328[/C][C]-2.1023[/C][C]0.020345[/C][/ROW]
[ROW][C]2[/C][C]-0.135192[/C][C]-0.9463[/C][C]0.174308[/C][/ROW]
[ROW][C]3[/C][C]0.211556[/C][C]1.4809[/C][C]0.072519[/C][/ROW]
[ROW][C]4[/C][C]0.019184[/C][C]0.1343[/C][C]0.446863[/C][/ROW]
[ROW][C]5[/C][C]0.202953[/C][C]1.4207[/C][C]0.080873[/C][/ROW]
[ROW][C]6[/C][C]0.091682[/C][C]0.6418[/C][C]0.262006[/C][/ROW]
[ROW][C]7[/C][C]-0.098987[/C][C]-0.6929[/C][C]0.245818[/C][/ROW]
[ROW][C]8[/C][C]-0.301818[/C][C]-2.1127[/C][C]0.019872[/C][/ROW]
[ROW][C]9[/C][C]0.141801[/C][C]0.9926[/C][C]0.16289[/C][/ROW]
[ROW][C]10[/C][C]-0.123527[/C][C]-0.8647[/C][C]0.195711[/C][/ROW]
[ROW][C]11[/C][C]-0.028755[/C][C]-0.2013[/C][C]0.420655[/C][/ROW]
[ROW][C]12[/C][C]0.006281[/C][C]0.044[/C][C]0.482555[/C][/ROW]
[ROW][C]13[/C][C]0.005317[/C][C]0.0372[/C][C]0.485232[/C][/ROW]
[ROW][C]14[/C][C]-0.063203[/C][C]-0.4424[/C][C]0.330065[/C][/ROW]
[ROW][C]15[/C][C]0.088254[/C][C]0.6178[/C][C]0.269791[/C][/ROW]
[ROW][C]16[/C][C]-0.0226[/C][C]-0.1582[/C][C]0.437474[/C][/ROW]
[ROW][C]17[/C][C]-0.096885[/C][C]-0.6782[/C][C]0.250418[/C][/ROW]
[ROW][C]18[/C][C]0.06579[/C][C]0.4605[/C][C]0.323587[/C][/ROW]
[ROW][C]19[/C][C]-0.113676[/C][C]-0.7957[/C][C]0.215013[/C][/ROW]
[ROW][C]20[/C][C]-0.094324[/C][C]-0.6603[/C][C]0.256087[/C][/ROW]
[ROW][C]21[/C][C]-0.117521[/C][C]-0.8226[/C][C]0.207347[/C][/ROW]
[ROW][C]22[/C][C]-0.003328[/C][C]-0.0233[/C][C]0.490754[/C][/ROW]
[ROW][C]23[/C][C]0.187114[/C][C]1.3098[/C][C]0.098185[/C][/ROW]
[ROW][C]24[/C][C]-0.22091[/C][C]-1.5464[/C][C]0.064225[/C][/ROW]
[ROW][C]25[/C][C]-0.163894[/C][C]-1.1473[/C][C]0.128424[/C][/ROW]
[ROW][C]26[/C][C]-0.01384[/C][C]-0.0969[/C][C]0.461609[/C][/ROW]
[ROW][C]27[/C][C]-0.122526[/C][C]-0.8577[/C][C]0.197621[/C][/ROW]
[ROW][C]28[/C][C]-0.094816[/C][C]-0.6637[/C][C]0.254992[/C][/ROW]
[ROW][C]29[/C][C]-0.015195[/C][C]-0.1064[/C][C]0.457864[/C][/ROW]
[ROW][C]30[/C][C]0.067211[/C][C]0.4705[/C][C]0.32005[/C][/ROW]
[ROW][C]31[/C][C]-0.062749[/C][C]-0.4392[/C][C]0.331208[/C][/ROW]
[ROW][C]32[/C][C]0.041587[/C][C]0.2911[/C][C]0.386099[/C][/ROW]
[ROW][C]33[/C][C]0.014646[/C][C]0.1025[/C][C]0.459382[/C][/ROW]
[ROW][C]34[/C][C]0.044169[/C][C]0.3092[/C][C]0.379246[/C][/ROW]
[ROW][C]35[/C][C]-0.050406[/C][C]-0.3528[/C][C]0.36286[/C][/ROW]
[ROW][C]36[/C][C]0.077985[/C][C]0.5459[/C][C]0.293808[/C][/ROW]
[ROW][C]37[/C][C]0.048241[/C][C]0.3377[/C][C]0.36852[/C][/ROW]
[ROW][C]38[/C][C]-0.002248[/C][C]-0.0157[/C][C]0.493754[/C][/ROW]
[ROW][C]39[/C][C]-0.063182[/C][C]-0.4423[/C][C]0.33012[/C][/ROW]
[ROW][C]40[/C][C]-0.103729[/C][C]-0.7261[/C][C]0.235614[/C][/ROW]
[ROW][C]41[/C][C]-0.076364[/C][C]-0.5345[/C][C]0.29769[/C][/ROW]
[ROW][C]42[/C][C]0.019228[/C][C]0.1346[/C][C]0.446742[/C][/ROW]
[ROW][C]43[/C][C]-0.027683[/C][C]-0.1938[/C][C]0.423574[/C][/ROW]
[ROW][C]44[/C][C]-0.09634[/C][C]-0.6744[/C][C]0.25162[/C][/ROW]
[ROW][C]45[/C][C]-0.032133[/C][C]-0.2249[/C][C]0.411484[/C][/ROW]
[ROW][C]46[/C][C]0.003846[/C][C]0.0269[/C][C]0.489315[/C][/ROW]
[ROW][C]47[/C][C]0.03579[/C][C]0.2505[/C][C]0.401613[/C][/ROW]
[ROW][C]48[/C][C]0.024852[/C][C]0.174[/C][C]0.431306[/C][/ROW]
[ROW][C]49[/C][C]NA[/C][C]NA[/C][C]NA[/C][/ROW]
[ROW][C]50[/C][C]NA[/C][C]NA[/C][C]NA[/C][/ROW]
[ROW][C]51[/C][C]NA[/C][C]NA[/C][C]NA[/C][/ROW]
[ROW][C]52[/C][C]NA[/C][C]NA[/C][C]NA[/C][/ROW]
[ROW][C]53[/C][C]NA[/C][C]NA[/C][C]NA[/C][/ROW]
[ROW][C]54[/C][C]NA[/C][C]NA[/C][C]NA[/C][/ROW]
[ROW][C]55[/C][C]NA[/C][C]NA[/C][C]NA[/C][/ROW]
[ROW][C]56[/C][C]NA[/C][C]NA[/C][C]NA[/C][/ROW]
[ROW][C]57[/C][C]NA[/C][C]NA[/C][C]NA[/C][/ROW]
[ROW][C]58[/C][C]NA[/C][C]NA[/C][C]NA[/C][/ROW]
[ROW][C]59[/C][C]NA[/C][C]NA[/C][C]NA[/C][/ROW]
[ROW][C]60[/C][C]NA[/C][C]NA[/C][C]NA[/C][/ROW]
[/TABLE]
Source: https://freestatistics.org/blog/index.php?pk=33722&T=2

Globally Unique Identifier (entire table): ba.freestatistics.org/blog/index.php?pk=33722&T=2

As an alternative you can also use a QR Code:  

The GUIDs for individual cells are displayed in the table below:

Partial Autocorrelation Function
Time lag kPACF(k)T-STATP-value
1-0.300328-2.10230.020345
2-0.135192-0.94630.174308
30.2115561.48090.072519
40.0191840.13430.446863
50.2029531.42070.080873
60.0916820.64180.262006
7-0.098987-0.69290.245818
8-0.301818-2.11270.019872
90.1418010.99260.16289
10-0.123527-0.86470.195711
11-0.028755-0.20130.420655
120.0062810.0440.482555
130.0053170.03720.485232
14-0.063203-0.44240.330065
150.0882540.61780.269791
16-0.0226-0.15820.437474
17-0.096885-0.67820.250418
180.065790.46050.323587
19-0.113676-0.79570.215013
20-0.094324-0.66030.256087
21-0.117521-0.82260.207347
22-0.003328-0.02330.490754
230.1871141.30980.098185
24-0.22091-1.54640.064225
25-0.163894-1.14730.128424
26-0.01384-0.09690.461609
27-0.122526-0.85770.197621
28-0.094816-0.66370.254992
29-0.015195-0.10640.457864
300.0672110.47050.32005
31-0.062749-0.43920.331208
320.0415870.29110.386099
330.0146460.10250.459382
340.0441690.30920.379246
35-0.050406-0.35280.36286
360.0779850.54590.293808
370.0482410.33770.36852
38-0.002248-0.01570.493754
39-0.063182-0.44230.33012
40-0.103729-0.72610.235614
41-0.076364-0.53450.29769
420.0192280.13460.446742
43-0.027683-0.19380.423574
44-0.09634-0.67440.25162
45-0.032133-0.22490.411484
460.0038460.02690.489315
470.035790.25050.401613
480.0248520.1740.431306
49NANANA
50NANANA
51NANANA
52NANANA
53NANANA
54NANANA
55NANANA
56NANANA
57NANANA
58NANANA
59NANANA
60NANANA


Parameters (Session):
par1 = 60 ; par2 = 1 ; par3 = 0 ; par4 = 1 ; par5 = 12 ;
Parameters (R input):
par1 = 60 ; par2 = 1 ; par3 = 0 ; par4 = 1 ; par5 = 12 ;
R code (references can be found in the software module):
if (par1 == 'Default') {
par1 = 10*log10(length(x))
} else {
par1 <- as.numeric(par1)
}
par2 <- as.numeric(par2)
par3 <- as.numeric(par3)
par4 <- as.numeric(par4)
par5 <- as.numeric(par5)
if (par2 == 0) {
x <- log(x)
} else {
x <- (x ^ par2 - 1) / par2
}
if (par3 > 0) x <- diff(x,lag=1,difference=par3)
if (par4 > 0) x <- diff(x,lag=par5,difference=par4)
bitmap(file='pic1.png')
racf <- acf(x,par1,main='Autocorrelation',xlab='lags',ylab='ACF')
dev.off()
bitmap(file='pic2.png')
rpacf <- pacf(x,par1,main='Partial Autocorrelation',xlab='lags',ylab='PACF')
dev.off()
(myacf <- c(racf$acf))
(mypacf <- c(rpacf$acf))
lengthx <- length(x)
sqrtn <- sqrt(lengthx)
load(file='createtable')
a<-table.start()
a<-table.row.start(a)
a<-table.element(a,'Autocorrelation Function',4,TRUE)
a<-table.row.end(a)
a<-table.row.start(a)
a<-table.element(a,'Time lag k',header=TRUE)
a<-table.element(a,hyperlink('basics.htm','ACF(k)','click here for more information about the Autocorrelation Function'),header=TRUE)
a<-table.element(a,'T-STAT',header=TRUE)
a<-table.element(a,'P-value',header=TRUE)
a<-table.row.end(a)
for (i in 2:(par1+1)) {
a<-table.row.start(a)
a<-table.element(a,i-1,header=TRUE)
a<-table.element(a,round(myacf[i],6))
mytstat <- myacf[i]*sqrtn
a<-table.element(a,round(mytstat,4))
a<-table.element(a,round(1-pt(abs(mytstat),lengthx),6))
a<-table.row.end(a)
}
a<-table.end(a)
table.save(a,file='mytable.tab')
a<-table.start()
a<-table.row.start(a)
a<-table.element(a,'Partial Autocorrelation Function',4,TRUE)
a<-table.row.end(a)
a<-table.row.start(a)
a<-table.element(a,'Time lag k',header=TRUE)
a<-table.element(a,hyperlink('basics.htm','PACF(k)','click here for more information about the Partial Autocorrelation Function'),header=TRUE)
a<-table.element(a,'T-STAT',header=TRUE)
a<-table.element(a,'P-value',header=TRUE)
a<-table.row.end(a)
for (i in 1:par1) {
a<-table.row.start(a)
a<-table.element(a,i,header=TRUE)
a<-table.element(a,round(mypacf[i],6))
mytstat <- mypacf[i]*sqrtn
a<-table.element(a,round(mytstat,4))
a<-table.element(a,round(1-pt(abs(mytstat),lengthx),6))
a<-table.row.end(a)
}
a<-table.end(a)
table.save(a,file='mytable1.tab')