Free Statistics

of Irreproducible Research!

Author's title

Author*Unverified author*
R Software Modulerwasp_autocorrelation.wasp
Title produced by software(Partial) Autocorrelation Function
Date of computationMon, 15 Dec 2008 08:56:41 -0700
Cite this page as followsStatistical Computations at FreeStatistics.org, Office for Research Development and Education, URL https://freestatistics.org/blog/index.php?v=date/2008/Dec/15/t12293566992spnjfix4wboooh.htm/, Retrieved Wed, 15 May 2024 02:19:51 +0000
Statistical Computations at FreeStatistics.org, Office for Research Development and Education, URL https://freestatistics.org/blog/index.php?pk=33718, Retrieved Wed, 15 May 2024 02:19:51 +0000
QR Codes:

Original text written by user:
IsPrivate?No (this computation is public)
User-defined keywords
Estimated Impact138
Family? (F = Feedback message, R = changed R code, M = changed R Module, P = changed Parameters, D = changed Data)
F     [Law of Averages] [Random Walk Simul...] [2008-11-25 18:05:16] [b98453cac15ba1066b407e146608df68]
- RMPD    [(Partial) Autocorrelation Function] [] [2008-12-15 15:56:41] [86e877ba38171644c8ca01af8044e645] [Current]
Feedback Forum

Post a new message
Dataseries X:
118.3
127.3
112.3
114.9
108.2
105.4
122.1
113.5
110
125.3
114.3
115.6
127.1
123
122.2
126.4
112.7
105.8
120.9
116.3
115.7
127.9
108.3
121.1
128.6
123.1
127.7
126.6
118.4
110
129.6
115.8
125.9
128.4
114
125.6
128.5
136.6
133.1
124.6
123.5
117.2
135.5
124.8
127.8
133.1
125.7
128.4
131.9
146.3
140.6
129.5
132.4
125.9
126.9
135.8
129.5
130.2
133.8
123.3
140.6


Summary of computational transaction
Raw Inputview raw input (R code)
Raw Outputview raw output of R engine
Computing time2 seconds
R Server'George Udny Yule' @ 72.249.76.132

\begin{tabular}{lllllllll}
\hline
Summary of computational transaction \tabularnewline
Raw Input & view raw input (R code)  \tabularnewline
Raw Output & view raw output of R engine  \tabularnewline
Computing time & 2 seconds \tabularnewline
R Server & 'George Udny Yule' @ 72.249.76.132 \tabularnewline
\hline
\end{tabular}
%Source: https://freestatistics.org/blog/index.php?pk=33718&T=0

[TABLE]
[ROW][C]Summary of computational transaction[/C][/ROW]
[ROW][C]Raw Input[/C][C]view raw input (R code) [/C][/ROW]
[ROW][C]Raw Output[/C][C]view raw output of R engine [/C][/ROW]
[ROW][C]Computing time[/C][C]2 seconds[/C][/ROW]
[ROW][C]R Server[/C][C]'George Udny Yule' @ 72.249.76.132[/C][/ROW]
[/TABLE]
Source: https://freestatistics.org/blog/index.php?pk=33718&T=0

Globally Unique Identifier (entire table): ba.freestatistics.org/blog/index.php?pk=33718&T=0

As an alternative you can also use a QR Code:  

The GUIDs for individual cells are displayed in the table below:

Summary of computational transaction
Raw Inputview raw input (R code)
Raw Outputview raw output of R engine
Computing time2 seconds
R Server'George Udny Yule' @ 72.249.76.132


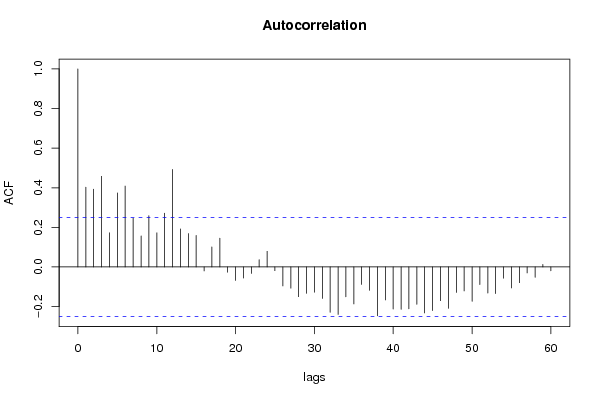
Autocorrelation Function
Time lag kACF(k)T-STATP-value
10.4027963.14590.00128
20.3925863.06620.001615
30.4576123.57410.000347
40.1724241.34670.091534
50.3737682.91920.002455
60.4087463.19240.001116
70.2457761.91960.029796
80.1565011.22230.113146
90.2590932.02360.0237
100.1723721.34630.091599
110.2718492.12320.018901
120.4925583.8470.000144
130.1921771.5010.069263
140.1685291.31630.096507
150.1590771.24240.109416
16-0.019854-0.15510.438643
170.1014170.79210.215688
180.1453181.1350.130414
19-0.026576-0.20760.418131
20-0.068001-0.53110.298637
21-0.056138-0.43850.331303
22-0.033001-0.25770.398734
230.0366040.28590.387965
240.0787520.61510.270398
25-0.018866-0.14740.44167
26-0.09601-0.74990.228111
27-0.106971-0.83550.203357
28-0.150427-1.17490.122305
29-0.132993-1.03870.151519
30-0.127158-0.99310.162283
31-0.158945-1.24140.109606
32-0.229198-1.79010.039201
33-0.240017-1.87460.032819
34-0.150548-1.17580.122118
35-0.18682-1.45910.074832
36-0.088558-0.69170.245888
37-0.117964-0.92130.180254
38-0.246985-1.9290.029192
39-0.166792-1.30270.098789
40-0.212433-1.65920.051109
41-0.213817-1.670.050025
42-0.211325-1.65050.05199
43-0.188451-1.47180.073101
44-0.232024-1.81220.037441
45-0.219998-1.71820.045412
46-0.17005-1.32810.094542
47-0.208978-1.63220.053898
48-0.128393-1.00280.159963
49-0.121311-0.94750.173568
50-0.173451-1.35470.090255
51-0.088801-0.69360.245295
52-0.131628-1.0280.153993
53-0.134306-1.0490.149166
54-0.056793-0.44360.329461
55-0.106142-0.8290.20517
56-0.079453-0.62050.268605
57-0.030046-0.23470.407626
58-0.05213-0.40720.342661
590.0127190.09930.460599
60-0.019316-0.15090.440291

\begin{tabular}{lllllllll}
\hline
Autocorrelation Function \tabularnewline
Time lag k & ACF(k) & T-STAT & P-value \tabularnewline
1 & 0.402796 & 3.1459 & 0.00128 \tabularnewline
2 & 0.392586 & 3.0662 & 0.001615 \tabularnewline
3 & 0.457612 & 3.5741 & 0.000347 \tabularnewline
4 & 0.172424 & 1.3467 & 0.091534 \tabularnewline
5 & 0.373768 & 2.9192 & 0.002455 \tabularnewline
6 & 0.408746 & 3.1924 & 0.001116 \tabularnewline
7 & 0.245776 & 1.9196 & 0.029796 \tabularnewline
8 & 0.156501 & 1.2223 & 0.113146 \tabularnewline
9 & 0.259093 & 2.0236 & 0.0237 \tabularnewline
10 & 0.172372 & 1.3463 & 0.091599 \tabularnewline
11 & 0.271849 & 2.1232 & 0.018901 \tabularnewline
12 & 0.492558 & 3.847 & 0.000144 \tabularnewline
13 & 0.192177 & 1.501 & 0.069263 \tabularnewline
14 & 0.168529 & 1.3163 & 0.096507 \tabularnewline
15 & 0.159077 & 1.2424 & 0.109416 \tabularnewline
16 & -0.019854 & -0.1551 & 0.438643 \tabularnewline
17 & 0.101417 & 0.7921 & 0.215688 \tabularnewline
18 & 0.145318 & 1.135 & 0.130414 \tabularnewline
19 & -0.026576 & -0.2076 & 0.418131 \tabularnewline
20 & -0.068001 & -0.5311 & 0.298637 \tabularnewline
21 & -0.056138 & -0.4385 & 0.331303 \tabularnewline
22 & -0.033001 & -0.2577 & 0.398734 \tabularnewline
23 & 0.036604 & 0.2859 & 0.387965 \tabularnewline
24 & 0.078752 & 0.6151 & 0.270398 \tabularnewline
25 & -0.018866 & -0.1474 & 0.44167 \tabularnewline
26 & -0.09601 & -0.7499 & 0.228111 \tabularnewline
27 & -0.106971 & -0.8355 & 0.203357 \tabularnewline
28 & -0.150427 & -1.1749 & 0.122305 \tabularnewline
29 & -0.132993 & -1.0387 & 0.151519 \tabularnewline
30 & -0.127158 & -0.9931 & 0.162283 \tabularnewline
31 & -0.158945 & -1.2414 & 0.109606 \tabularnewline
32 & -0.229198 & -1.7901 & 0.039201 \tabularnewline
33 & -0.240017 & -1.8746 & 0.032819 \tabularnewline
34 & -0.150548 & -1.1758 & 0.122118 \tabularnewline
35 & -0.18682 & -1.4591 & 0.074832 \tabularnewline
36 & -0.088558 & -0.6917 & 0.245888 \tabularnewline
37 & -0.117964 & -0.9213 & 0.180254 \tabularnewline
38 & -0.246985 & -1.929 & 0.029192 \tabularnewline
39 & -0.166792 & -1.3027 & 0.098789 \tabularnewline
40 & -0.212433 & -1.6592 & 0.051109 \tabularnewline
41 & -0.213817 & -1.67 & 0.050025 \tabularnewline
42 & -0.211325 & -1.6505 & 0.05199 \tabularnewline
43 & -0.188451 & -1.4718 & 0.073101 \tabularnewline
44 & -0.232024 & -1.8122 & 0.037441 \tabularnewline
45 & -0.219998 & -1.7182 & 0.045412 \tabularnewline
46 & -0.17005 & -1.3281 & 0.094542 \tabularnewline
47 & -0.208978 & -1.6322 & 0.053898 \tabularnewline
48 & -0.128393 & -1.0028 & 0.159963 \tabularnewline
49 & -0.121311 & -0.9475 & 0.173568 \tabularnewline
50 & -0.173451 & -1.3547 & 0.090255 \tabularnewline
51 & -0.088801 & -0.6936 & 0.245295 \tabularnewline
52 & -0.131628 & -1.028 & 0.153993 \tabularnewline
53 & -0.134306 & -1.049 & 0.149166 \tabularnewline
54 & -0.056793 & -0.4436 & 0.329461 \tabularnewline
55 & -0.106142 & -0.829 & 0.20517 \tabularnewline
56 & -0.079453 & -0.6205 & 0.268605 \tabularnewline
57 & -0.030046 & -0.2347 & 0.407626 \tabularnewline
58 & -0.05213 & -0.4072 & 0.342661 \tabularnewline
59 & 0.012719 & 0.0993 & 0.460599 \tabularnewline
60 & -0.019316 & -0.1509 & 0.440291 \tabularnewline
\hline
\end{tabular}
%Source: https://freestatistics.org/blog/index.php?pk=33718&T=1

[TABLE]
[ROW][C]Autocorrelation Function[/C][/ROW]
[ROW][C]Time lag k[/C][C]ACF(k)[/C][C]T-STAT[/C][C]P-value[/C][/ROW]
[ROW][C]1[/C][C]0.402796[/C][C]3.1459[/C][C]0.00128[/C][/ROW]
[ROW][C]2[/C][C]0.392586[/C][C]3.0662[/C][C]0.001615[/C][/ROW]
[ROW][C]3[/C][C]0.457612[/C][C]3.5741[/C][C]0.000347[/C][/ROW]
[ROW][C]4[/C][C]0.172424[/C][C]1.3467[/C][C]0.091534[/C][/ROW]
[ROW][C]5[/C][C]0.373768[/C][C]2.9192[/C][C]0.002455[/C][/ROW]
[ROW][C]6[/C][C]0.408746[/C][C]3.1924[/C][C]0.001116[/C][/ROW]
[ROW][C]7[/C][C]0.245776[/C][C]1.9196[/C][C]0.029796[/C][/ROW]
[ROW][C]8[/C][C]0.156501[/C][C]1.2223[/C][C]0.113146[/C][/ROW]
[ROW][C]9[/C][C]0.259093[/C][C]2.0236[/C][C]0.0237[/C][/ROW]
[ROW][C]10[/C][C]0.172372[/C][C]1.3463[/C][C]0.091599[/C][/ROW]
[ROW][C]11[/C][C]0.271849[/C][C]2.1232[/C][C]0.018901[/C][/ROW]
[ROW][C]12[/C][C]0.492558[/C][C]3.847[/C][C]0.000144[/C][/ROW]
[ROW][C]13[/C][C]0.192177[/C][C]1.501[/C][C]0.069263[/C][/ROW]
[ROW][C]14[/C][C]0.168529[/C][C]1.3163[/C][C]0.096507[/C][/ROW]
[ROW][C]15[/C][C]0.159077[/C][C]1.2424[/C][C]0.109416[/C][/ROW]
[ROW][C]16[/C][C]-0.019854[/C][C]-0.1551[/C][C]0.438643[/C][/ROW]
[ROW][C]17[/C][C]0.101417[/C][C]0.7921[/C][C]0.215688[/C][/ROW]
[ROW][C]18[/C][C]0.145318[/C][C]1.135[/C][C]0.130414[/C][/ROW]
[ROW][C]19[/C][C]-0.026576[/C][C]-0.2076[/C][C]0.418131[/C][/ROW]
[ROW][C]20[/C][C]-0.068001[/C][C]-0.5311[/C][C]0.298637[/C][/ROW]
[ROW][C]21[/C][C]-0.056138[/C][C]-0.4385[/C][C]0.331303[/C][/ROW]
[ROW][C]22[/C][C]-0.033001[/C][C]-0.2577[/C][C]0.398734[/C][/ROW]
[ROW][C]23[/C][C]0.036604[/C][C]0.2859[/C][C]0.387965[/C][/ROW]
[ROW][C]24[/C][C]0.078752[/C][C]0.6151[/C][C]0.270398[/C][/ROW]
[ROW][C]25[/C][C]-0.018866[/C][C]-0.1474[/C][C]0.44167[/C][/ROW]
[ROW][C]26[/C][C]-0.09601[/C][C]-0.7499[/C][C]0.228111[/C][/ROW]
[ROW][C]27[/C][C]-0.106971[/C][C]-0.8355[/C][C]0.203357[/C][/ROW]
[ROW][C]28[/C][C]-0.150427[/C][C]-1.1749[/C][C]0.122305[/C][/ROW]
[ROW][C]29[/C][C]-0.132993[/C][C]-1.0387[/C][C]0.151519[/C][/ROW]
[ROW][C]30[/C][C]-0.127158[/C][C]-0.9931[/C][C]0.162283[/C][/ROW]
[ROW][C]31[/C][C]-0.158945[/C][C]-1.2414[/C][C]0.109606[/C][/ROW]
[ROW][C]32[/C][C]-0.229198[/C][C]-1.7901[/C][C]0.039201[/C][/ROW]
[ROW][C]33[/C][C]-0.240017[/C][C]-1.8746[/C][C]0.032819[/C][/ROW]
[ROW][C]34[/C][C]-0.150548[/C][C]-1.1758[/C][C]0.122118[/C][/ROW]
[ROW][C]35[/C][C]-0.18682[/C][C]-1.4591[/C][C]0.074832[/C][/ROW]
[ROW][C]36[/C][C]-0.088558[/C][C]-0.6917[/C][C]0.245888[/C][/ROW]
[ROW][C]37[/C][C]-0.117964[/C][C]-0.9213[/C][C]0.180254[/C][/ROW]
[ROW][C]38[/C][C]-0.246985[/C][C]-1.929[/C][C]0.029192[/C][/ROW]
[ROW][C]39[/C][C]-0.166792[/C][C]-1.3027[/C][C]0.098789[/C][/ROW]
[ROW][C]40[/C][C]-0.212433[/C][C]-1.6592[/C][C]0.051109[/C][/ROW]
[ROW][C]41[/C][C]-0.213817[/C][C]-1.67[/C][C]0.050025[/C][/ROW]
[ROW][C]42[/C][C]-0.211325[/C][C]-1.6505[/C][C]0.05199[/C][/ROW]
[ROW][C]43[/C][C]-0.188451[/C][C]-1.4718[/C][C]0.073101[/C][/ROW]
[ROW][C]44[/C][C]-0.232024[/C][C]-1.8122[/C][C]0.037441[/C][/ROW]
[ROW][C]45[/C][C]-0.219998[/C][C]-1.7182[/C][C]0.045412[/C][/ROW]
[ROW][C]46[/C][C]-0.17005[/C][C]-1.3281[/C][C]0.094542[/C][/ROW]
[ROW][C]47[/C][C]-0.208978[/C][C]-1.6322[/C][C]0.053898[/C][/ROW]
[ROW][C]48[/C][C]-0.128393[/C][C]-1.0028[/C][C]0.159963[/C][/ROW]
[ROW][C]49[/C][C]-0.121311[/C][C]-0.9475[/C][C]0.173568[/C][/ROW]
[ROW][C]50[/C][C]-0.173451[/C][C]-1.3547[/C][C]0.090255[/C][/ROW]
[ROW][C]51[/C][C]-0.088801[/C][C]-0.6936[/C][C]0.245295[/C][/ROW]
[ROW][C]52[/C][C]-0.131628[/C][C]-1.028[/C][C]0.153993[/C][/ROW]
[ROW][C]53[/C][C]-0.134306[/C][C]-1.049[/C][C]0.149166[/C][/ROW]
[ROW][C]54[/C][C]-0.056793[/C][C]-0.4436[/C][C]0.329461[/C][/ROW]
[ROW][C]55[/C][C]-0.106142[/C][C]-0.829[/C][C]0.20517[/C][/ROW]
[ROW][C]56[/C][C]-0.079453[/C][C]-0.6205[/C][C]0.268605[/C][/ROW]
[ROW][C]57[/C][C]-0.030046[/C][C]-0.2347[/C][C]0.407626[/C][/ROW]
[ROW][C]58[/C][C]-0.05213[/C][C]-0.4072[/C][C]0.342661[/C][/ROW]
[ROW][C]59[/C][C]0.012719[/C][C]0.0993[/C][C]0.460599[/C][/ROW]
[ROW][C]60[/C][C]-0.019316[/C][C]-0.1509[/C][C]0.440291[/C][/ROW]
[/TABLE]
Source: https://freestatistics.org/blog/index.php?pk=33718&T=1

Globally Unique Identifier (entire table): ba.freestatistics.org/blog/index.php?pk=33718&T=1

As an alternative you can also use a QR Code:  

The GUIDs for individual cells are displayed in the table below:

Autocorrelation Function
Time lag kACF(k)T-STATP-value
10.4027963.14590.00128
20.3925863.06620.001615
30.4576123.57410.000347
40.1724241.34670.091534
50.3737682.91920.002455
60.4087463.19240.001116
70.2457761.91960.029796
80.1565011.22230.113146
90.2590932.02360.0237
100.1723721.34630.091599
110.2718492.12320.018901
120.4925583.8470.000144
130.1921771.5010.069263
140.1685291.31630.096507
150.1590771.24240.109416
16-0.019854-0.15510.438643
170.1014170.79210.215688
180.1453181.1350.130414
19-0.026576-0.20760.418131
20-0.068001-0.53110.298637
21-0.056138-0.43850.331303
22-0.033001-0.25770.398734
230.0366040.28590.387965
240.0787520.61510.270398
25-0.018866-0.14740.44167
26-0.09601-0.74990.228111
27-0.106971-0.83550.203357
28-0.150427-1.17490.122305
29-0.132993-1.03870.151519
30-0.127158-0.99310.162283
31-0.158945-1.24140.109606
32-0.229198-1.79010.039201
33-0.240017-1.87460.032819
34-0.150548-1.17580.122118
35-0.18682-1.45910.074832
36-0.088558-0.69170.245888
37-0.117964-0.92130.180254
38-0.246985-1.9290.029192
39-0.166792-1.30270.098789
40-0.212433-1.65920.051109
41-0.213817-1.670.050025
42-0.211325-1.65050.05199
43-0.188451-1.47180.073101
44-0.232024-1.81220.037441
45-0.219998-1.71820.045412
46-0.17005-1.32810.094542
47-0.208978-1.63220.053898
48-0.128393-1.00280.159963
49-0.121311-0.94750.173568
50-0.173451-1.35470.090255
51-0.088801-0.69360.245295
52-0.131628-1.0280.153993
53-0.134306-1.0490.149166
54-0.056793-0.44360.329461
55-0.106142-0.8290.20517
56-0.079453-0.62050.268605
57-0.030046-0.23470.407626
58-0.05213-0.40720.342661
590.0127190.09930.460599
60-0.019316-0.15090.440291


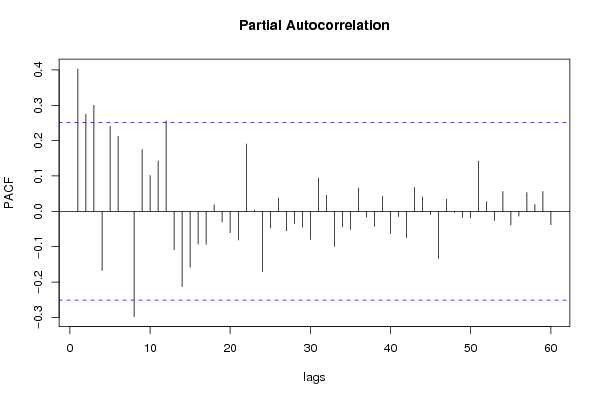
Partial Autocorrelation Function
Time lag kPACF(k)T-STATP-value
10.4027963.14590.00128
20.2749512.14740.01787
30.2998492.34190.011234
4-0.167189-1.30580.098264
50.2405051.87840.032554
60.2121241.65670.051353
7-0.000891-0.0070.497236
8-0.297892-2.32660.011662
90.1751521.3680.088169
100.1011610.79010.216267
110.142751.11490.134631
120.2553661.99450.025288
13-0.108932-0.85080.199107
14-0.212695-1.66120.050903
15-0.157944-1.23360.111045
16-0.092493-0.72240.236406
17-0.092977-0.72620.235255
180.0185840.14510.442538
19-0.030455-0.23790.406392
20-0.060457-0.47220.31924
21-0.080759-0.63070.26528
220.1903811.48690.071093
230.0038330.02990.488106
24-0.17067-1.3330.093748
25-0.047061-0.36760.357237
260.0377680.2950.384505
27-0.054579-0.42630.335705
28-0.034924-0.27280.392977
29-0.044339-0.34630.365154
30-0.079889-0.62390.267494
310.0942780.73630.232174
320.0454880.35530.361805
33-0.099194-0.77470.220746
34-0.043782-0.34190.366783
35-0.051045-0.39870.345762
360.0657170.51330.304811
37-0.016083-0.12560.450225
38-0.042284-0.33020.371173
390.0420240.32820.371934
40-0.062877-0.49110.312565
41-0.014758-0.11530.454307
42-0.074362-0.58080.281763
430.0671120.52420.301033
440.0404250.31570.376644
45-0.009166-0.07160.47158
46-0.133396-1.04190.150795
470.0342490.26750.394997
48-0.003628-0.02830.488745
49-0.017742-0.13860.445123
50-0.01798-0.14040.444392
510.1420011.10910.135877
520.0271170.21180.416489
53-0.025864-0.2020.420293
540.0558260.4360.332183
55-0.038654-0.30190.381878
56-0.013522-0.10560.45812
570.0532860.41620.33937
580.0190470.14880.441116
590.0563290.43990.330768
60-0.037609-0.29370.384979

\begin{tabular}{lllllllll}
\hline
Partial Autocorrelation Function \tabularnewline
Time lag k & PACF(k) & T-STAT & P-value \tabularnewline
1 & 0.402796 & 3.1459 & 0.00128 \tabularnewline
2 & 0.274951 & 2.1474 & 0.01787 \tabularnewline
3 & 0.299849 & 2.3419 & 0.011234 \tabularnewline
4 & -0.167189 & -1.3058 & 0.098264 \tabularnewline
5 & 0.240505 & 1.8784 & 0.032554 \tabularnewline
6 & 0.212124 & 1.6567 & 0.051353 \tabularnewline
7 & -0.000891 & -0.007 & 0.497236 \tabularnewline
8 & -0.297892 & -2.3266 & 0.011662 \tabularnewline
9 & 0.175152 & 1.368 & 0.088169 \tabularnewline
10 & 0.101161 & 0.7901 & 0.216267 \tabularnewline
11 & 0.14275 & 1.1149 & 0.134631 \tabularnewline
12 & 0.255366 & 1.9945 & 0.025288 \tabularnewline
13 & -0.108932 & -0.8508 & 0.199107 \tabularnewline
14 & -0.212695 & -1.6612 & 0.050903 \tabularnewline
15 & -0.157944 & -1.2336 & 0.111045 \tabularnewline
16 & -0.092493 & -0.7224 & 0.236406 \tabularnewline
17 & -0.092977 & -0.7262 & 0.235255 \tabularnewline
18 & 0.018584 & 0.1451 & 0.442538 \tabularnewline
19 & -0.030455 & -0.2379 & 0.406392 \tabularnewline
20 & -0.060457 & -0.4722 & 0.31924 \tabularnewline
21 & -0.080759 & -0.6307 & 0.26528 \tabularnewline
22 & 0.190381 & 1.4869 & 0.071093 \tabularnewline
23 & 0.003833 & 0.0299 & 0.488106 \tabularnewline
24 & -0.17067 & -1.333 & 0.093748 \tabularnewline
25 & -0.047061 & -0.3676 & 0.357237 \tabularnewline
26 & 0.037768 & 0.295 & 0.384505 \tabularnewline
27 & -0.054579 & -0.4263 & 0.335705 \tabularnewline
28 & -0.034924 & -0.2728 & 0.392977 \tabularnewline
29 & -0.044339 & -0.3463 & 0.365154 \tabularnewline
30 & -0.079889 & -0.6239 & 0.267494 \tabularnewline
31 & 0.094278 & 0.7363 & 0.232174 \tabularnewline
32 & 0.045488 & 0.3553 & 0.361805 \tabularnewline
33 & -0.099194 & -0.7747 & 0.220746 \tabularnewline
34 & -0.043782 & -0.3419 & 0.366783 \tabularnewline
35 & -0.051045 & -0.3987 & 0.345762 \tabularnewline
36 & 0.065717 & 0.5133 & 0.304811 \tabularnewline
37 & -0.016083 & -0.1256 & 0.450225 \tabularnewline
38 & -0.042284 & -0.3302 & 0.371173 \tabularnewline
39 & 0.042024 & 0.3282 & 0.371934 \tabularnewline
40 & -0.062877 & -0.4911 & 0.312565 \tabularnewline
41 & -0.014758 & -0.1153 & 0.454307 \tabularnewline
42 & -0.074362 & -0.5808 & 0.281763 \tabularnewline
43 & 0.067112 & 0.5242 & 0.301033 \tabularnewline
44 & 0.040425 & 0.3157 & 0.376644 \tabularnewline
45 & -0.009166 & -0.0716 & 0.47158 \tabularnewline
46 & -0.133396 & -1.0419 & 0.150795 \tabularnewline
47 & 0.034249 & 0.2675 & 0.394997 \tabularnewline
48 & -0.003628 & -0.0283 & 0.488745 \tabularnewline
49 & -0.017742 & -0.1386 & 0.445123 \tabularnewline
50 & -0.01798 & -0.1404 & 0.444392 \tabularnewline
51 & 0.142001 & 1.1091 & 0.135877 \tabularnewline
52 & 0.027117 & 0.2118 & 0.416489 \tabularnewline
53 & -0.025864 & -0.202 & 0.420293 \tabularnewline
54 & 0.055826 & 0.436 & 0.332183 \tabularnewline
55 & -0.038654 & -0.3019 & 0.381878 \tabularnewline
56 & -0.013522 & -0.1056 & 0.45812 \tabularnewline
57 & 0.053286 & 0.4162 & 0.33937 \tabularnewline
58 & 0.019047 & 0.1488 & 0.441116 \tabularnewline
59 & 0.056329 & 0.4399 & 0.330768 \tabularnewline
60 & -0.037609 & -0.2937 & 0.384979 \tabularnewline
\hline
\end{tabular}
%Source: https://freestatistics.org/blog/index.php?pk=33718&T=2

[TABLE]
[ROW][C]Partial Autocorrelation Function[/C][/ROW]
[ROW][C]Time lag k[/C][C]PACF(k)[/C][C]T-STAT[/C][C]P-value[/C][/ROW]
[ROW][C]1[/C][C]0.402796[/C][C]3.1459[/C][C]0.00128[/C][/ROW]
[ROW][C]2[/C][C]0.274951[/C][C]2.1474[/C][C]0.01787[/C][/ROW]
[ROW][C]3[/C][C]0.299849[/C][C]2.3419[/C][C]0.011234[/C][/ROW]
[ROW][C]4[/C][C]-0.167189[/C][C]-1.3058[/C][C]0.098264[/C][/ROW]
[ROW][C]5[/C][C]0.240505[/C][C]1.8784[/C][C]0.032554[/C][/ROW]
[ROW][C]6[/C][C]0.212124[/C][C]1.6567[/C][C]0.051353[/C][/ROW]
[ROW][C]7[/C][C]-0.000891[/C][C]-0.007[/C][C]0.497236[/C][/ROW]
[ROW][C]8[/C][C]-0.297892[/C][C]-2.3266[/C][C]0.011662[/C][/ROW]
[ROW][C]9[/C][C]0.175152[/C][C]1.368[/C][C]0.088169[/C][/ROW]
[ROW][C]10[/C][C]0.101161[/C][C]0.7901[/C][C]0.216267[/C][/ROW]
[ROW][C]11[/C][C]0.14275[/C][C]1.1149[/C][C]0.134631[/C][/ROW]
[ROW][C]12[/C][C]0.255366[/C][C]1.9945[/C][C]0.025288[/C][/ROW]
[ROW][C]13[/C][C]-0.108932[/C][C]-0.8508[/C][C]0.199107[/C][/ROW]
[ROW][C]14[/C][C]-0.212695[/C][C]-1.6612[/C][C]0.050903[/C][/ROW]
[ROW][C]15[/C][C]-0.157944[/C][C]-1.2336[/C][C]0.111045[/C][/ROW]
[ROW][C]16[/C][C]-0.092493[/C][C]-0.7224[/C][C]0.236406[/C][/ROW]
[ROW][C]17[/C][C]-0.092977[/C][C]-0.7262[/C][C]0.235255[/C][/ROW]
[ROW][C]18[/C][C]0.018584[/C][C]0.1451[/C][C]0.442538[/C][/ROW]
[ROW][C]19[/C][C]-0.030455[/C][C]-0.2379[/C][C]0.406392[/C][/ROW]
[ROW][C]20[/C][C]-0.060457[/C][C]-0.4722[/C][C]0.31924[/C][/ROW]
[ROW][C]21[/C][C]-0.080759[/C][C]-0.6307[/C][C]0.26528[/C][/ROW]
[ROW][C]22[/C][C]0.190381[/C][C]1.4869[/C][C]0.071093[/C][/ROW]
[ROW][C]23[/C][C]0.003833[/C][C]0.0299[/C][C]0.488106[/C][/ROW]
[ROW][C]24[/C][C]-0.17067[/C][C]-1.333[/C][C]0.093748[/C][/ROW]
[ROW][C]25[/C][C]-0.047061[/C][C]-0.3676[/C][C]0.357237[/C][/ROW]
[ROW][C]26[/C][C]0.037768[/C][C]0.295[/C][C]0.384505[/C][/ROW]
[ROW][C]27[/C][C]-0.054579[/C][C]-0.4263[/C][C]0.335705[/C][/ROW]
[ROW][C]28[/C][C]-0.034924[/C][C]-0.2728[/C][C]0.392977[/C][/ROW]
[ROW][C]29[/C][C]-0.044339[/C][C]-0.3463[/C][C]0.365154[/C][/ROW]
[ROW][C]30[/C][C]-0.079889[/C][C]-0.6239[/C][C]0.267494[/C][/ROW]
[ROW][C]31[/C][C]0.094278[/C][C]0.7363[/C][C]0.232174[/C][/ROW]
[ROW][C]32[/C][C]0.045488[/C][C]0.3553[/C][C]0.361805[/C][/ROW]
[ROW][C]33[/C][C]-0.099194[/C][C]-0.7747[/C][C]0.220746[/C][/ROW]
[ROW][C]34[/C][C]-0.043782[/C][C]-0.3419[/C][C]0.366783[/C][/ROW]
[ROW][C]35[/C][C]-0.051045[/C][C]-0.3987[/C][C]0.345762[/C][/ROW]
[ROW][C]36[/C][C]0.065717[/C][C]0.5133[/C][C]0.304811[/C][/ROW]
[ROW][C]37[/C][C]-0.016083[/C][C]-0.1256[/C][C]0.450225[/C][/ROW]
[ROW][C]38[/C][C]-0.042284[/C][C]-0.3302[/C][C]0.371173[/C][/ROW]
[ROW][C]39[/C][C]0.042024[/C][C]0.3282[/C][C]0.371934[/C][/ROW]
[ROW][C]40[/C][C]-0.062877[/C][C]-0.4911[/C][C]0.312565[/C][/ROW]
[ROW][C]41[/C][C]-0.014758[/C][C]-0.1153[/C][C]0.454307[/C][/ROW]
[ROW][C]42[/C][C]-0.074362[/C][C]-0.5808[/C][C]0.281763[/C][/ROW]
[ROW][C]43[/C][C]0.067112[/C][C]0.5242[/C][C]0.301033[/C][/ROW]
[ROW][C]44[/C][C]0.040425[/C][C]0.3157[/C][C]0.376644[/C][/ROW]
[ROW][C]45[/C][C]-0.009166[/C][C]-0.0716[/C][C]0.47158[/C][/ROW]
[ROW][C]46[/C][C]-0.133396[/C][C]-1.0419[/C][C]0.150795[/C][/ROW]
[ROW][C]47[/C][C]0.034249[/C][C]0.2675[/C][C]0.394997[/C][/ROW]
[ROW][C]48[/C][C]-0.003628[/C][C]-0.0283[/C][C]0.488745[/C][/ROW]
[ROW][C]49[/C][C]-0.017742[/C][C]-0.1386[/C][C]0.445123[/C][/ROW]
[ROW][C]50[/C][C]-0.01798[/C][C]-0.1404[/C][C]0.444392[/C][/ROW]
[ROW][C]51[/C][C]0.142001[/C][C]1.1091[/C][C]0.135877[/C][/ROW]
[ROW][C]52[/C][C]0.027117[/C][C]0.2118[/C][C]0.416489[/C][/ROW]
[ROW][C]53[/C][C]-0.025864[/C][C]-0.202[/C][C]0.420293[/C][/ROW]
[ROW][C]54[/C][C]0.055826[/C][C]0.436[/C][C]0.332183[/C][/ROW]
[ROW][C]55[/C][C]-0.038654[/C][C]-0.3019[/C][C]0.381878[/C][/ROW]
[ROW][C]56[/C][C]-0.013522[/C][C]-0.1056[/C][C]0.45812[/C][/ROW]
[ROW][C]57[/C][C]0.053286[/C][C]0.4162[/C][C]0.33937[/C][/ROW]
[ROW][C]58[/C][C]0.019047[/C][C]0.1488[/C][C]0.441116[/C][/ROW]
[ROW][C]59[/C][C]0.056329[/C][C]0.4399[/C][C]0.330768[/C][/ROW]
[ROW][C]60[/C][C]-0.037609[/C][C]-0.2937[/C][C]0.384979[/C][/ROW]
[/TABLE]
Source: https://freestatistics.org/blog/index.php?pk=33718&T=2

Globally Unique Identifier (entire table): ba.freestatistics.org/blog/index.php?pk=33718&T=2

As an alternative you can also use a QR Code:  

The GUIDs for individual cells are displayed in the table below:

Partial Autocorrelation Function
Time lag kPACF(k)T-STATP-value
10.4027963.14590.00128
20.2749512.14740.01787
30.2998492.34190.011234
4-0.167189-1.30580.098264
50.2405051.87840.032554
60.2121241.65670.051353
7-0.000891-0.0070.497236
8-0.297892-2.32660.011662
90.1751521.3680.088169
100.1011610.79010.216267
110.142751.11490.134631
120.2553661.99450.025288
13-0.108932-0.85080.199107
14-0.212695-1.66120.050903
15-0.157944-1.23360.111045
16-0.092493-0.72240.236406
17-0.092977-0.72620.235255
180.0185840.14510.442538
19-0.030455-0.23790.406392
20-0.060457-0.47220.31924
21-0.080759-0.63070.26528
220.1903811.48690.071093
230.0038330.02990.488106
24-0.17067-1.3330.093748
25-0.047061-0.36760.357237
260.0377680.2950.384505
27-0.054579-0.42630.335705
28-0.034924-0.27280.392977
29-0.044339-0.34630.365154
30-0.079889-0.62390.267494
310.0942780.73630.232174
320.0454880.35530.361805
33-0.099194-0.77470.220746
34-0.043782-0.34190.366783
35-0.051045-0.39870.345762
360.0657170.51330.304811
37-0.016083-0.12560.450225
38-0.042284-0.33020.371173
390.0420240.32820.371934
40-0.062877-0.49110.312565
41-0.014758-0.11530.454307
42-0.074362-0.58080.281763
430.0671120.52420.301033
440.0404250.31570.376644
45-0.009166-0.07160.47158
46-0.133396-1.04190.150795
470.0342490.26750.394997
48-0.003628-0.02830.488745
49-0.017742-0.13860.445123
50-0.01798-0.14040.444392
510.1420011.10910.135877
520.0271170.21180.416489
53-0.025864-0.2020.420293
540.0558260.4360.332183
55-0.038654-0.30190.381878
56-0.013522-0.10560.45812
570.0532860.41620.33937
580.0190470.14880.441116
590.0563290.43990.330768
60-0.037609-0.29370.384979


Parameters (Session):
par1 = 60 ; par2 = 1 ; par3 = 0 ; par4 = 0 ; par5 = 12 ;
Parameters (R input):
par1 = 60 ; par2 = 1 ; par3 = 0 ; par4 = 0 ; par5 = 12 ;
R code (references can be found in the software module):
if (par1 == 'Default') {
par1 = 10*log10(length(x))
} else {
par1 <- as.numeric(par1)
}
par2 <- as.numeric(par2)
par3 <- as.numeric(par3)
par4 <- as.numeric(par4)
par5 <- as.numeric(par5)
if (par2 == 0) {
x <- log(x)
} else {
x <- (x ^ par2 - 1) / par2
}
if (par3 > 0) x <- diff(x,lag=1,difference=par3)
if (par4 > 0) x <- diff(x,lag=par5,difference=par4)
bitmap(file='pic1.png')
racf <- acf(x,par1,main='Autocorrelation',xlab='lags',ylab='ACF')
dev.off()
bitmap(file='pic2.png')
rpacf <- pacf(x,par1,main='Partial Autocorrelation',xlab='lags',ylab='PACF')
dev.off()
(myacf <- c(racf$acf))
(mypacf <- c(rpacf$acf))
lengthx <- length(x)
sqrtn <- sqrt(lengthx)
load(file='createtable')
a<-table.start()
a<-table.row.start(a)
a<-table.element(a,'Autocorrelation Function',4,TRUE)
a<-table.row.end(a)
a<-table.row.start(a)
a<-table.element(a,'Time lag k',header=TRUE)
a<-table.element(a,hyperlink('basics.htm','ACF(k)','click here for more information about the Autocorrelation Function'),header=TRUE)
a<-table.element(a,'T-STAT',header=TRUE)
a<-table.element(a,'P-value',header=TRUE)
a<-table.row.end(a)
for (i in 2:(par1+1)) {
a<-table.row.start(a)
a<-table.element(a,i-1,header=TRUE)
a<-table.element(a,round(myacf[i],6))
mytstat <- myacf[i]*sqrtn
a<-table.element(a,round(mytstat,4))
a<-table.element(a,round(1-pt(abs(mytstat),lengthx),6))
a<-table.row.end(a)
}
a<-table.end(a)
table.save(a,file='mytable.tab')
a<-table.start()
a<-table.row.start(a)
a<-table.element(a,'Partial Autocorrelation Function',4,TRUE)
a<-table.row.end(a)
a<-table.row.start(a)
a<-table.element(a,'Time lag k',header=TRUE)
a<-table.element(a,hyperlink('basics.htm','PACF(k)','click here for more information about the Partial Autocorrelation Function'),header=TRUE)
a<-table.element(a,'T-STAT',header=TRUE)
a<-table.element(a,'P-value',header=TRUE)
a<-table.row.end(a)
for (i in 1:par1) {
a<-table.row.start(a)
a<-table.element(a,i,header=TRUE)
a<-table.element(a,round(mypacf[i],6))
mytstat <- mypacf[i]*sqrtn
a<-table.element(a,round(mytstat,4))
a<-table.element(a,round(1-pt(abs(mytstat),lengthx),6))
a<-table.row.end(a)
}
a<-table.end(a)
table.save(a,file='mytable1.tab')