Free Statistics

of Irreproducible Research!

Author's title

Author*The author of this computation has been verified*
R Software Modulerwasp_autocorrelation.wasp
Title produced by software(Partial) Autocorrelation Function
Date of computationMon, 15 Dec 2008 07:12:30 -0700
Cite this page as followsStatistical Computations at FreeStatistics.org, Office for Research Development and Education, URL https://freestatistics.org/blog/index.php?v=date/2008/Dec/15/t1229350400ux9w6wterxq7tub.htm/, Retrieved Wed, 15 May 2024 06:23:05 +0000
Statistical Computations at FreeStatistics.org, Office for Research Development and Education, URL https://freestatistics.org/blog/index.php?pk=33691, Retrieved Wed, 15 May 2024 06:23:05 +0000
QR Codes:

Original text written by user:
IsPrivate?No (this computation is public)
User-defined keywords
Estimated Impact158
Family? (F = Feedback message, R = changed R code, M = changed R Module, P = changed Parameters, D = changed Data)
-       [(Partial) Autocorrelation Function] [] [2008-12-15 14:12:30] [56fd94b954e08a6655cb7790b21ee404] [Current]
Feedback Forum

Post a new message
Dataseries X:
6392.3
8686.4
9244.7
8182.7
7451.4
7988.8
8243.5
8843
9092.7
8246.7
9311.7
8341.2
7116.7
9635.7
9815.4
8611.3
8297.8
8715.1
8919.9
10085.8
9511.7
8991.3
10311.2
8895.4
7449.8
10084
9859.4
9100.1
8920.8
8502.7
8599.6
10394.4
9290.4
8742.2
10217.3
8639
8139.6
10779.1
10427.7
10349.1
10036.4
9492.1
10638.8
12054.5
10324.7
11817.3
11008.9
9996.6
9419.5
11958.8
12594.6
11890.6
10871.7
11835.7
11542.2
13093.7
11180.2
12035.7
12112
10875.2
9897.3
11672.1
12385.7
11405.6
9830.9
11025.1
10853.8
12252.6
11839.4
11669.1
11601.4
11178.4
9516.4
12102.8
12989
11610.2
10205.5
11356.2
11307.1
12648.6
11947.2
11714.1
12192.5
11268.8
9097.4
12639.8
13040.1
11687.3
11191.7
11391.9
11793.1
13933.2
12778.1
11810.3
13698.4
11956.6
10723.8
13938.9
13979.8
13807.4
12973.9
12509.8
12934.1
14908.3
13772.1
13012.6
14049.9
11816.5
11593.2
14466.2
13615.9
14733.9
13880.7
13527.5
13584
16170.2
13260.6
14741.9
15486.5
13154.5
12621.2


Summary of computational transaction
Raw Inputview raw input (R code)
Raw Outputview raw output of R engine
Computing time1 seconds
R Server'Gwilym Jenkins' @ 72.249.127.135

\begin{tabular}{lllllllll}
\hline
Summary of computational transaction \tabularnewline
Raw Input & view raw input (R code)  \tabularnewline
Raw Output & view raw output of R engine  \tabularnewline
Computing time & 1 seconds \tabularnewline
R Server & 'Gwilym Jenkins' @ 72.249.127.135 \tabularnewline
\hline
\end{tabular}
%Source: https://freestatistics.org/blog/index.php?pk=33691&T=0

[TABLE]
[ROW][C]Summary of computational transaction[/C][/ROW]
[ROW][C]Raw Input[/C][C]view raw input (R code) [/C][/ROW]
[ROW][C]Raw Output[/C][C]view raw output of R engine [/C][/ROW]
[ROW][C]Computing time[/C][C]1 seconds[/C][/ROW]
[ROW][C]R Server[/C][C]'Gwilym Jenkins' @ 72.249.127.135[/C][/ROW]
[/TABLE]
Source: https://freestatistics.org/blog/index.php?pk=33691&T=0

Globally Unique Identifier (entire table): ba.freestatistics.org/blog/index.php?pk=33691&T=0

As an alternative you can also use a QR Code:  

The GUIDs for individual cells are displayed in the table below:

Summary of computational transaction
Raw Inputview raw input (R code)
Raw Outputview raw output of R engine
Computing time1 seconds
R Server'Gwilym Jenkins' @ 72.249.127.135


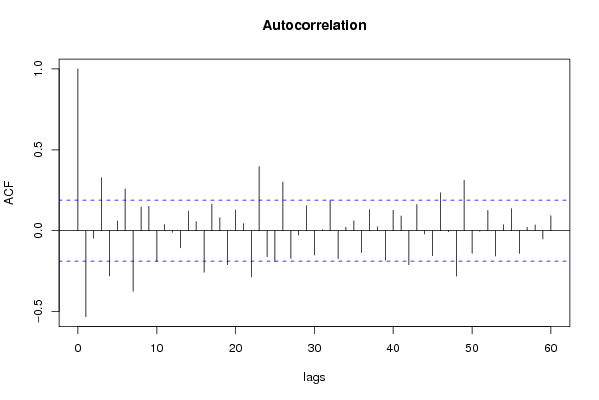
Autocorrelation Function
Time lag kACF(k)T-STATP-value
1-0.531843-5.52710
2-0.046275-0.48090.315779
30.3275573.40410.000466
4-0.280207-2.9120.002182
50.0601110.62470.266746
60.2579992.68120.004243
7-0.375075-3.89798.4e-05
80.1461121.51840.065913
90.1503361.56230.060566
10-0.190516-1.97990.025129
110.0376740.39150.348093
12-0.009661-0.10040.460108
13-0.106133-1.1030.136246
140.1209291.25670.105781
150.0563350.58550.279733
16-0.25696-2.67040.004373
170.1648061.71270.044818
180.0803560.83510.202757
19-0.210748-2.19020.015332
200.1272521.32240.094408
210.0430180.44710.327865
22-0.286375-2.97610.001802
230.3961234.11663.8e-05
24-0.161227-1.67550.048362
25-0.190878-1.98370.024916
260.3014893.13320.001113
27-0.171573-1.7830.038694
28-0.027528-0.28610.387683
290.1540681.60110.056135
30-0.150432-1.56330.06045
310.0050930.05290.478945
320.1896941.97140.02562
33-0.171695-1.78430.038591
340.0212620.2210.412768
350.061250.63650.262888
36-0.135509-1.40830.080964
370.1308151.35950.088414
380.0241180.25060.401284
39-0.18236-1.89510.030374
400.1265411.31510.095639
410.0903460.93890.174939
42-0.21086-2.19130.015288
430.1614221.67750.048163
44-0.020154-0.20940.417249
45-0.154681-1.60750.055433
460.234292.43480.008269
47-0.006675-0.06940.472413
48-0.280731-2.91740.002147
490.3116983.23930.000796
50-0.139988-1.45480.074313
51-0.004178-0.04340.482723
520.1246681.29560.09894
53-0.157218-1.63390.0526
540.0372620.38720.349669
550.1355421.40860.080915
56-0.140703-1.46220.073291
570.0205930.2140.415474
580.0350370.36410.358242
59-0.051554-0.53580.296611
600.0921830.9580.170102

\begin{tabular}{lllllllll}
\hline
Autocorrelation Function \tabularnewline
Time lag k & ACF(k) & T-STAT & P-value \tabularnewline
1 & -0.531843 & -5.5271 & 0 \tabularnewline
2 & -0.046275 & -0.4809 & 0.315779 \tabularnewline
3 & 0.327557 & 3.4041 & 0.000466 \tabularnewline
4 & -0.280207 & -2.912 & 0.002182 \tabularnewline
5 & 0.060111 & 0.6247 & 0.266746 \tabularnewline
6 & 0.257999 & 2.6812 & 0.004243 \tabularnewline
7 & -0.375075 & -3.8979 & 8.4e-05 \tabularnewline
8 & 0.146112 & 1.5184 & 0.065913 \tabularnewline
9 & 0.150336 & 1.5623 & 0.060566 \tabularnewline
10 & -0.190516 & -1.9799 & 0.025129 \tabularnewline
11 & 0.037674 & 0.3915 & 0.348093 \tabularnewline
12 & -0.009661 & -0.1004 & 0.460108 \tabularnewline
13 & -0.106133 & -1.103 & 0.136246 \tabularnewline
14 & 0.120929 & 1.2567 & 0.105781 \tabularnewline
15 & 0.056335 & 0.5855 & 0.279733 \tabularnewline
16 & -0.25696 & -2.6704 & 0.004373 \tabularnewline
17 & 0.164806 & 1.7127 & 0.044818 \tabularnewline
18 & 0.080356 & 0.8351 & 0.202757 \tabularnewline
19 & -0.210748 & -2.1902 & 0.015332 \tabularnewline
20 & 0.127252 & 1.3224 & 0.094408 \tabularnewline
21 & 0.043018 & 0.4471 & 0.327865 \tabularnewline
22 & -0.286375 & -2.9761 & 0.001802 \tabularnewline
23 & 0.396123 & 4.1166 & 3.8e-05 \tabularnewline
24 & -0.161227 & -1.6755 & 0.048362 \tabularnewline
25 & -0.190878 & -1.9837 & 0.024916 \tabularnewline
26 & 0.301489 & 3.1332 & 0.001113 \tabularnewline
27 & -0.171573 & -1.783 & 0.038694 \tabularnewline
28 & -0.027528 & -0.2861 & 0.387683 \tabularnewline
29 & 0.154068 & 1.6011 & 0.056135 \tabularnewline
30 & -0.150432 & -1.5633 & 0.06045 \tabularnewline
31 & 0.005093 & 0.0529 & 0.478945 \tabularnewline
32 & 0.189694 & 1.9714 & 0.02562 \tabularnewline
33 & -0.171695 & -1.7843 & 0.038591 \tabularnewline
34 & 0.021262 & 0.221 & 0.412768 \tabularnewline
35 & 0.06125 & 0.6365 & 0.262888 \tabularnewline
36 & -0.135509 & -1.4083 & 0.080964 \tabularnewline
37 & 0.130815 & 1.3595 & 0.088414 \tabularnewline
38 & 0.024118 & 0.2506 & 0.401284 \tabularnewline
39 & -0.18236 & -1.8951 & 0.030374 \tabularnewline
40 & 0.126541 & 1.3151 & 0.095639 \tabularnewline
41 & 0.090346 & 0.9389 & 0.174939 \tabularnewline
42 & -0.21086 & -2.1913 & 0.015288 \tabularnewline
43 & 0.161422 & 1.6775 & 0.048163 \tabularnewline
44 & -0.020154 & -0.2094 & 0.417249 \tabularnewline
45 & -0.154681 & -1.6075 & 0.055433 \tabularnewline
46 & 0.23429 & 2.4348 & 0.008269 \tabularnewline
47 & -0.006675 & -0.0694 & 0.472413 \tabularnewline
48 & -0.280731 & -2.9174 & 0.002147 \tabularnewline
49 & 0.311698 & 3.2393 & 0.000796 \tabularnewline
50 & -0.139988 & -1.4548 & 0.074313 \tabularnewline
51 & -0.004178 & -0.0434 & 0.482723 \tabularnewline
52 & 0.124668 & 1.2956 & 0.09894 \tabularnewline
53 & -0.157218 & -1.6339 & 0.0526 \tabularnewline
54 & 0.037262 & 0.3872 & 0.349669 \tabularnewline
55 & 0.135542 & 1.4086 & 0.080915 \tabularnewline
56 & -0.140703 & -1.4622 & 0.073291 \tabularnewline
57 & 0.020593 & 0.214 & 0.415474 \tabularnewline
58 & 0.035037 & 0.3641 & 0.358242 \tabularnewline
59 & -0.051554 & -0.5358 & 0.296611 \tabularnewline
60 & 0.092183 & 0.958 & 0.170102 \tabularnewline
\hline
\end{tabular}
%Source: https://freestatistics.org/blog/index.php?pk=33691&T=1

[TABLE]
[ROW][C]Autocorrelation Function[/C][/ROW]
[ROW][C]Time lag k[/C][C]ACF(k)[/C][C]T-STAT[/C][C]P-value[/C][/ROW]
[ROW][C]1[/C][C]-0.531843[/C][C]-5.5271[/C][C]0[/C][/ROW]
[ROW][C]2[/C][C]-0.046275[/C][C]-0.4809[/C][C]0.315779[/C][/ROW]
[ROW][C]3[/C][C]0.327557[/C][C]3.4041[/C][C]0.000466[/C][/ROW]
[ROW][C]4[/C][C]-0.280207[/C][C]-2.912[/C][C]0.002182[/C][/ROW]
[ROW][C]5[/C][C]0.060111[/C][C]0.6247[/C][C]0.266746[/C][/ROW]
[ROW][C]6[/C][C]0.257999[/C][C]2.6812[/C][C]0.004243[/C][/ROW]
[ROW][C]7[/C][C]-0.375075[/C][C]-3.8979[/C][C]8.4e-05[/C][/ROW]
[ROW][C]8[/C][C]0.146112[/C][C]1.5184[/C][C]0.065913[/C][/ROW]
[ROW][C]9[/C][C]0.150336[/C][C]1.5623[/C][C]0.060566[/C][/ROW]
[ROW][C]10[/C][C]-0.190516[/C][C]-1.9799[/C][C]0.025129[/C][/ROW]
[ROW][C]11[/C][C]0.037674[/C][C]0.3915[/C][C]0.348093[/C][/ROW]
[ROW][C]12[/C][C]-0.009661[/C][C]-0.1004[/C][C]0.460108[/C][/ROW]
[ROW][C]13[/C][C]-0.106133[/C][C]-1.103[/C][C]0.136246[/C][/ROW]
[ROW][C]14[/C][C]0.120929[/C][C]1.2567[/C][C]0.105781[/C][/ROW]
[ROW][C]15[/C][C]0.056335[/C][C]0.5855[/C][C]0.279733[/C][/ROW]
[ROW][C]16[/C][C]-0.25696[/C][C]-2.6704[/C][C]0.004373[/C][/ROW]
[ROW][C]17[/C][C]0.164806[/C][C]1.7127[/C][C]0.044818[/C][/ROW]
[ROW][C]18[/C][C]0.080356[/C][C]0.8351[/C][C]0.202757[/C][/ROW]
[ROW][C]19[/C][C]-0.210748[/C][C]-2.1902[/C][C]0.015332[/C][/ROW]
[ROW][C]20[/C][C]0.127252[/C][C]1.3224[/C][C]0.094408[/C][/ROW]
[ROW][C]21[/C][C]0.043018[/C][C]0.4471[/C][C]0.327865[/C][/ROW]
[ROW][C]22[/C][C]-0.286375[/C][C]-2.9761[/C][C]0.001802[/C][/ROW]
[ROW][C]23[/C][C]0.396123[/C][C]4.1166[/C][C]3.8e-05[/C][/ROW]
[ROW][C]24[/C][C]-0.161227[/C][C]-1.6755[/C][C]0.048362[/C][/ROW]
[ROW][C]25[/C][C]-0.190878[/C][C]-1.9837[/C][C]0.024916[/C][/ROW]
[ROW][C]26[/C][C]0.301489[/C][C]3.1332[/C][C]0.001113[/C][/ROW]
[ROW][C]27[/C][C]-0.171573[/C][C]-1.783[/C][C]0.038694[/C][/ROW]
[ROW][C]28[/C][C]-0.027528[/C][C]-0.2861[/C][C]0.387683[/C][/ROW]
[ROW][C]29[/C][C]0.154068[/C][C]1.6011[/C][C]0.056135[/C][/ROW]
[ROW][C]30[/C][C]-0.150432[/C][C]-1.5633[/C][C]0.06045[/C][/ROW]
[ROW][C]31[/C][C]0.005093[/C][C]0.0529[/C][C]0.478945[/C][/ROW]
[ROW][C]32[/C][C]0.189694[/C][C]1.9714[/C][C]0.02562[/C][/ROW]
[ROW][C]33[/C][C]-0.171695[/C][C]-1.7843[/C][C]0.038591[/C][/ROW]
[ROW][C]34[/C][C]0.021262[/C][C]0.221[/C][C]0.412768[/C][/ROW]
[ROW][C]35[/C][C]0.06125[/C][C]0.6365[/C][C]0.262888[/C][/ROW]
[ROW][C]36[/C][C]-0.135509[/C][C]-1.4083[/C][C]0.080964[/C][/ROW]
[ROW][C]37[/C][C]0.130815[/C][C]1.3595[/C][C]0.088414[/C][/ROW]
[ROW][C]38[/C][C]0.024118[/C][C]0.2506[/C][C]0.401284[/C][/ROW]
[ROW][C]39[/C][C]-0.18236[/C][C]-1.8951[/C][C]0.030374[/C][/ROW]
[ROW][C]40[/C][C]0.126541[/C][C]1.3151[/C][C]0.095639[/C][/ROW]
[ROW][C]41[/C][C]0.090346[/C][C]0.9389[/C][C]0.174939[/C][/ROW]
[ROW][C]42[/C][C]-0.21086[/C][C]-2.1913[/C][C]0.015288[/C][/ROW]
[ROW][C]43[/C][C]0.161422[/C][C]1.6775[/C][C]0.048163[/C][/ROW]
[ROW][C]44[/C][C]-0.020154[/C][C]-0.2094[/C][C]0.417249[/C][/ROW]
[ROW][C]45[/C][C]-0.154681[/C][C]-1.6075[/C][C]0.055433[/C][/ROW]
[ROW][C]46[/C][C]0.23429[/C][C]2.4348[/C][C]0.008269[/C][/ROW]
[ROW][C]47[/C][C]-0.006675[/C][C]-0.0694[/C][C]0.472413[/C][/ROW]
[ROW][C]48[/C][C]-0.280731[/C][C]-2.9174[/C][C]0.002147[/C][/ROW]
[ROW][C]49[/C][C]0.311698[/C][C]3.2393[/C][C]0.000796[/C][/ROW]
[ROW][C]50[/C][C]-0.139988[/C][C]-1.4548[/C][C]0.074313[/C][/ROW]
[ROW][C]51[/C][C]-0.004178[/C][C]-0.0434[/C][C]0.482723[/C][/ROW]
[ROW][C]52[/C][C]0.124668[/C][C]1.2956[/C][C]0.09894[/C][/ROW]
[ROW][C]53[/C][C]-0.157218[/C][C]-1.6339[/C][C]0.0526[/C][/ROW]
[ROW][C]54[/C][C]0.037262[/C][C]0.3872[/C][C]0.349669[/C][/ROW]
[ROW][C]55[/C][C]0.135542[/C][C]1.4086[/C][C]0.080915[/C][/ROW]
[ROW][C]56[/C][C]-0.140703[/C][C]-1.4622[/C][C]0.073291[/C][/ROW]
[ROW][C]57[/C][C]0.020593[/C][C]0.214[/C][C]0.415474[/C][/ROW]
[ROW][C]58[/C][C]0.035037[/C][C]0.3641[/C][C]0.358242[/C][/ROW]
[ROW][C]59[/C][C]-0.051554[/C][C]-0.5358[/C][C]0.296611[/C][/ROW]
[ROW][C]60[/C][C]0.092183[/C][C]0.958[/C][C]0.170102[/C][/ROW]
[/TABLE]
Source: https://freestatistics.org/blog/index.php?pk=33691&T=1

Globally Unique Identifier (entire table): ba.freestatistics.org/blog/index.php?pk=33691&T=1

As an alternative you can also use a QR Code:  

The GUIDs for individual cells are displayed in the table below:

Autocorrelation Function
Time lag kACF(k)T-STATP-value
1-0.531843-5.52710
2-0.046275-0.48090.315779
30.3275573.40410.000466
4-0.280207-2.9120.002182
50.0601110.62470.266746
60.2579992.68120.004243
7-0.375075-3.89798.4e-05
80.1461121.51840.065913
90.1503361.56230.060566
10-0.190516-1.97990.025129
110.0376740.39150.348093
12-0.009661-0.10040.460108
13-0.106133-1.1030.136246
140.1209291.25670.105781
150.0563350.58550.279733
16-0.25696-2.67040.004373
170.1648061.71270.044818
180.0803560.83510.202757
19-0.210748-2.19020.015332
200.1272521.32240.094408
210.0430180.44710.327865
22-0.286375-2.97610.001802
230.3961234.11663.8e-05
24-0.161227-1.67550.048362
25-0.190878-1.98370.024916
260.3014893.13320.001113
27-0.171573-1.7830.038694
28-0.027528-0.28610.387683
290.1540681.60110.056135
30-0.150432-1.56330.06045
310.0050930.05290.478945
320.1896941.97140.02562
33-0.171695-1.78430.038591
340.0212620.2210.412768
350.061250.63650.262888
36-0.135509-1.40830.080964
370.1308151.35950.088414
380.0241180.25060.401284
39-0.18236-1.89510.030374
400.1265411.31510.095639
410.0903460.93890.174939
42-0.21086-2.19130.015288
430.1614221.67750.048163
44-0.020154-0.20940.417249
45-0.154681-1.60750.055433
460.234292.43480.008269
47-0.006675-0.06940.472413
48-0.280731-2.91740.002147
490.3116983.23930.000796
50-0.139988-1.45480.074313
51-0.004178-0.04340.482723
520.1246681.29560.09894
53-0.157218-1.63390.0526
540.0372620.38720.349669
550.1355421.40860.080915
56-0.140703-1.46220.073291
570.0205930.2140.415474
580.0350370.36410.358242
59-0.051554-0.53580.296611
600.0921830.9580.170102


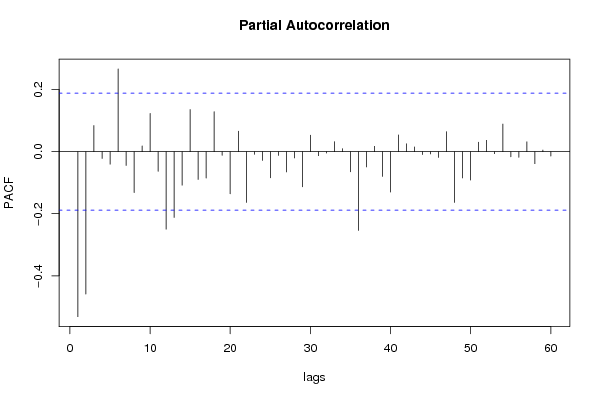
Partial Autocorrelation Function
Time lag kPACF(k)T-STATP-value
1-0.531843-5.52710
2-0.45895-4.76953e-06
30.0840180.87310.192261
4-0.021726-0.22580.410899
5-0.040266-0.41850.33822
60.2666072.77070.003294
7-0.044275-0.46010.323177
8-0.131899-1.37070.086649
90.0183440.19060.424585
100.1232541.28090.101488
11-0.063428-0.65920.255598
12-0.250125-2.59940.005322
13-0.21223-2.20560.014767
14-0.108007-1.12240.132082
150.1356141.40930.080803
16-0.089733-0.93250.176571
17-0.08514-0.88480.189115
180.128951.34010.091514
19-0.01193-0.1240.450781
20-0.136023-1.41360.080178
210.0659780.68570.247198
22-0.16357-1.69990.046017
23-0.008588-0.08930.464523
24-0.028439-0.29560.38407
25-0.084236-0.87540.191648
26-0.012121-0.1260.449995
27-0.06546-0.68030.248892
28-0.020247-0.21040.416869
29-0.113147-1.17590.121119
300.0532440.55330.290593
31-0.012905-0.13410.44678
32-0.004611-0.04790.480935
330.0320790.33340.369748
340.0096990.10080.459952
35-0.065003-0.67550.25039
36-0.253998-2.63960.004764
37-0.04929-0.51220.304766
380.0173530.18030.428613
39-0.079879-0.83010.204149
40-0.130205-1.35310.089421
410.0540410.56160.287771
420.0252730.26260.396663
430.0150940.15690.437825
44-0.009553-0.09930.460551
45-0.007355-0.07640.469607
46-0.018659-0.19390.423305
470.0644920.67020.252075
48-0.163884-1.70310.04571
49-0.084724-0.88050.190277
50-0.091497-0.95090.171899
510.0306940.3190.375177
520.0365570.37990.352377
53-0.006582-0.06840.472796
540.0890860.92580.178306
55-0.016466-0.17110.432227
56-0.018195-0.18910.425189
570.0316310.32870.371504
58-0.038848-0.40370.343609
590.0052760.05480.47819
60-0.014096-0.14650.441905

\begin{tabular}{lllllllll}
\hline
Partial Autocorrelation Function \tabularnewline
Time lag k & PACF(k) & T-STAT & P-value \tabularnewline
1 & -0.531843 & -5.5271 & 0 \tabularnewline
2 & -0.45895 & -4.7695 & 3e-06 \tabularnewline
3 & 0.084018 & 0.8731 & 0.192261 \tabularnewline
4 & -0.021726 & -0.2258 & 0.410899 \tabularnewline
5 & -0.040266 & -0.4185 & 0.33822 \tabularnewline
6 & 0.266607 & 2.7707 & 0.003294 \tabularnewline
7 & -0.044275 & -0.4601 & 0.323177 \tabularnewline
8 & -0.131899 & -1.3707 & 0.086649 \tabularnewline
9 & 0.018344 & 0.1906 & 0.424585 \tabularnewline
10 & 0.123254 & 1.2809 & 0.101488 \tabularnewline
11 & -0.063428 & -0.6592 & 0.255598 \tabularnewline
12 & -0.250125 & -2.5994 & 0.005322 \tabularnewline
13 & -0.21223 & -2.2056 & 0.014767 \tabularnewline
14 & -0.108007 & -1.1224 & 0.132082 \tabularnewline
15 & 0.135614 & 1.4093 & 0.080803 \tabularnewline
16 & -0.089733 & -0.9325 & 0.176571 \tabularnewline
17 & -0.08514 & -0.8848 & 0.189115 \tabularnewline
18 & 0.12895 & 1.3401 & 0.091514 \tabularnewline
19 & -0.01193 & -0.124 & 0.450781 \tabularnewline
20 & -0.136023 & -1.4136 & 0.080178 \tabularnewline
21 & 0.065978 & 0.6857 & 0.247198 \tabularnewline
22 & -0.16357 & -1.6999 & 0.046017 \tabularnewline
23 & -0.008588 & -0.0893 & 0.464523 \tabularnewline
24 & -0.028439 & -0.2956 & 0.38407 \tabularnewline
25 & -0.084236 & -0.8754 & 0.191648 \tabularnewline
26 & -0.012121 & -0.126 & 0.449995 \tabularnewline
27 & -0.06546 & -0.6803 & 0.248892 \tabularnewline
28 & -0.020247 & -0.2104 & 0.416869 \tabularnewline
29 & -0.113147 & -1.1759 & 0.121119 \tabularnewline
30 & 0.053244 & 0.5533 & 0.290593 \tabularnewline
31 & -0.012905 & -0.1341 & 0.44678 \tabularnewline
32 & -0.004611 & -0.0479 & 0.480935 \tabularnewline
33 & 0.032079 & 0.3334 & 0.369748 \tabularnewline
34 & 0.009699 & 0.1008 & 0.459952 \tabularnewline
35 & -0.065003 & -0.6755 & 0.25039 \tabularnewline
36 & -0.253998 & -2.6396 & 0.004764 \tabularnewline
37 & -0.04929 & -0.5122 & 0.304766 \tabularnewline
38 & 0.017353 & 0.1803 & 0.428613 \tabularnewline
39 & -0.079879 & -0.8301 & 0.204149 \tabularnewline
40 & -0.130205 & -1.3531 & 0.089421 \tabularnewline
41 & 0.054041 & 0.5616 & 0.287771 \tabularnewline
42 & 0.025273 & 0.2626 & 0.396663 \tabularnewline
43 & 0.015094 & 0.1569 & 0.437825 \tabularnewline
44 & -0.009553 & -0.0993 & 0.460551 \tabularnewline
45 & -0.007355 & -0.0764 & 0.469607 \tabularnewline
46 & -0.018659 & -0.1939 & 0.423305 \tabularnewline
47 & 0.064492 & 0.6702 & 0.252075 \tabularnewline
48 & -0.163884 & -1.7031 & 0.04571 \tabularnewline
49 & -0.084724 & -0.8805 & 0.190277 \tabularnewline
50 & -0.091497 & -0.9509 & 0.171899 \tabularnewline
51 & 0.030694 & 0.319 & 0.375177 \tabularnewline
52 & 0.036557 & 0.3799 & 0.352377 \tabularnewline
53 & -0.006582 & -0.0684 & 0.472796 \tabularnewline
54 & 0.089086 & 0.9258 & 0.178306 \tabularnewline
55 & -0.016466 & -0.1711 & 0.432227 \tabularnewline
56 & -0.018195 & -0.1891 & 0.425189 \tabularnewline
57 & 0.031631 & 0.3287 & 0.371504 \tabularnewline
58 & -0.038848 & -0.4037 & 0.343609 \tabularnewline
59 & 0.005276 & 0.0548 & 0.47819 \tabularnewline
60 & -0.014096 & -0.1465 & 0.441905 \tabularnewline
\hline
\end{tabular}
%Source: https://freestatistics.org/blog/index.php?pk=33691&T=2

[TABLE]
[ROW][C]Partial Autocorrelation Function[/C][/ROW]
[ROW][C]Time lag k[/C][C]PACF(k)[/C][C]T-STAT[/C][C]P-value[/C][/ROW]
[ROW][C]1[/C][C]-0.531843[/C][C]-5.5271[/C][C]0[/C][/ROW]
[ROW][C]2[/C][C]-0.45895[/C][C]-4.7695[/C][C]3e-06[/C][/ROW]
[ROW][C]3[/C][C]0.084018[/C][C]0.8731[/C][C]0.192261[/C][/ROW]
[ROW][C]4[/C][C]-0.021726[/C][C]-0.2258[/C][C]0.410899[/C][/ROW]
[ROW][C]5[/C][C]-0.040266[/C][C]-0.4185[/C][C]0.33822[/C][/ROW]
[ROW][C]6[/C][C]0.266607[/C][C]2.7707[/C][C]0.003294[/C][/ROW]
[ROW][C]7[/C][C]-0.044275[/C][C]-0.4601[/C][C]0.323177[/C][/ROW]
[ROW][C]8[/C][C]-0.131899[/C][C]-1.3707[/C][C]0.086649[/C][/ROW]
[ROW][C]9[/C][C]0.018344[/C][C]0.1906[/C][C]0.424585[/C][/ROW]
[ROW][C]10[/C][C]0.123254[/C][C]1.2809[/C][C]0.101488[/C][/ROW]
[ROW][C]11[/C][C]-0.063428[/C][C]-0.6592[/C][C]0.255598[/C][/ROW]
[ROW][C]12[/C][C]-0.250125[/C][C]-2.5994[/C][C]0.005322[/C][/ROW]
[ROW][C]13[/C][C]-0.21223[/C][C]-2.2056[/C][C]0.014767[/C][/ROW]
[ROW][C]14[/C][C]-0.108007[/C][C]-1.1224[/C][C]0.132082[/C][/ROW]
[ROW][C]15[/C][C]0.135614[/C][C]1.4093[/C][C]0.080803[/C][/ROW]
[ROW][C]16[/C][C]-0.089733[/C][C]-0.9325[/C][C]0.176571[/C][/ROW]
[ROW][C]17[/C][C]-0.08514[/C][C]-0.8848[/C][C]0.189115[/C][/ROW]
[ROW][C]18[/C][C]0.12895[/C][C]1.3401[/C][C]0.091514[/C][/ROW]
[ROW][C]19[/C][C]-0.01193[/C][C]-0.124[/C][C]0.450781[/C][/ROW]
[ROW][C]20[/C][C]-0.136023[/C][C]-1.4136[/C][C]0.080178[/C][/ROW]
[ROW][C]21[/C][C]0.065978[/C][C]0.6857[/C][C]0.247198[/C][/ROW]
[ROW][C]22[/C][C]-0.16357[/C][C]-1.6999[/C][C]0.046017[/C][/ROW]
[ROW][C]23[/C][C]-0.008588[/C][C]-0.0893[/C][C]0.464523[/C][/ROW]
[ROW][C]24[/C][C]-0.028439[/C][C]-0.2956[/C][C]0.38407[/C][/ROW]
[ROW][C]25[/C][C]-0.084236[/C][C]-0.8754[/C][C]0.191648[/C][/ROW]
[ROW][C]26[/C][C]-0.012121[/C][C]-0.126[/C][C]0.449995[/C][/ROW]
[ROW][C]27[/C][C]-0.06546[/C][C]-0.6803[/C][C]0.248892[/C][/ROW]
[ROW][C]28[/C][C]-0.020247[/C][C]-0.2104[/C][C]0.416869[/C][/ROW]
[ROW][C]29[/C][C]-0.113147[/C][C]-1.1759[/C][C]0.121119[/C][/ROW]
[ROW][C]30[/C][C]0.053244[/C][C]0.5533[/C][C]0.290593[/C][/ROW]
[ROW][C]31[/C][C]-0.012905[/C][C]-0.1341[/C][C]0.44678[/C][/ROW]
[ROW][C]32[/C][C]-0.004611[/C][C]-0.0479[/C][C]0.480935[/C][/ROW]
[ROW][C]33[/C][C]0.032079[/C][C]0.3334[/C][C]0.369748[/C][/ROW]
[ROW][C]34[/C][C]0.009699[/C][C]0.1008[/C][C]0.459952[/C][/ROW]
[ROW][C]35[/C][C]-0.065003[/C][C]-0.6755[/C][C]0.25039[/C][/ROW]
[ROW][C]36[/C][C]-0.253998[/C][C]-2.6396[/C][C]0.004764[/C][/ROW]
[ROW][C]37[/C][C]-0.04929[/C][C]-0.5122[/C][C]0.304766[/C][/ROW]
[ROW][C]38[/C][C]0.017353[/C][C]0.1803[/C][C]0.428613[/C][/ROW]
[ROW][C]39[/C][C]-0.079879[/C][C]-0.8301[/C][C]0.204149[/C][/ROW]
[ROW][C]40[/C][C]-0.130205[/C][C]-1.3531[/C][C]0.089421[/C][/ROW]
[ROW][C]41[/C][C]0.054041[/C][C]0.5616[/C][C]0.287771[/C][/ROW]
[ROW][C]42[/C][C]0.025273[/C][C]0.2626[/C][C]0.396663[/C][/ROW]
[ROW][C]43[/C][C]0.015094[/C][C]0.1569[/C][C]0.437825[/C][/ROW]
[ROW][C]44[/C][C]-0.009553[/C][C]-0.0993[/C][C]0.460551[/C][/ROW]
[ROW][C]45[/C][C]-0.007355[/C][C]-0.0764[/C][C]0.469607[/C][/ROW]
[ROW][C]46[/C][C]-0.018659[/C][C]-0.1939[/C][C]0.423305[/C][/ROW]
[ROW][C]47[/C][C]0.064492[/C][C]0.6702[/C][C]0.252075[/C][/ROW]
[ROW][C]48[/C][C]-0.163884[/C][C]-1.7031[/C][C]0.04571[/C][/ROW]
[ROW][C]49[/C][C]-0.084724[/C][C]-0.8805[/C][C]0.190277[/C][/ROW]
[ROW][C]50[/C][C]-0.091497[/C][C]-0.9509[/C][C]0.171899[/C][/ROW]
[ROW][C]51[/C][C]0.030694[/C][C]0.319[/C][C]0.375177[/C][/ROW]
[ROW][C]52[/C][C]0.036557[/C][C]0.3799[/C][C]0.352377[/C][/ROW]
[ROW][C]53[/C][C]-0.006582[/C][C]-0.0684[/C][C]0.472796[/C][/ROW]
[ROW][C]54[/C][C]0.089086[/C][C]0.9258[/C][C]0.178306[/C][/ROW]
[ROW][C]55[/C][C]-0.016466[/C][C]-0.1711[/C][C]0.432227[/C][/ROW]
[ROW][C]56[/C][C]-0.018195[/C][C]-0.1891[/C][C]0.425189[/C][/ROW]
[ROW][C]57[/C][C]0.031631[/C][C]0.3287[/C][C]0.371504[/C][/ROW]
[ROW][C]58[/C][C]-0.038848[/C][C]-0.4037[/C][C]0.343609[/C][/ROW]
[ROW][C]59[/C][C]0.005276[/C][C]0.0548[/C][C]0.47819[/C][/ROW]
[ROW][C]60[/C][C]-0.014096[/C][C]-0.1465[/C][C]0.441905[/C][/ROW]
[/TABLE]
Source: https://freestatistics.org/blog/index.php?pk=33691&T=2

Globally Unique Identifier (entire table): ba.freestatistics.org/blog/index.php?pk=33691&T=2

As an alternative you can also use a QR Code:  

The GUIDs for individual cells are displayed in the table below:

Partial Autocorrelation Function
Time lag kPACF(k)T-STATP-value
1-0.531843-5.52710
2-0.45895-4.76953e-06
30.0840180.87310.192261
4-0.021726-0.22580.410899
5-0.040266-0.41850.33822
60.2666072.77070.003294
7-0.044275-0.46010.323177
8-0.131899-1.37070.086649
90.0183440.19060.424585
100.1232541.28090.101488
11-0.063428-0.65920.255598
12-0.250125-2.59940.005322
13-0.21223-2.20560.014767
14-0.108007-1.12240.132082
150.1356141.40930.080803
16-0.089733-0.93250.176571
17-0.08514-0.88480.189115
180.128951.34010.091514
19-0.01193-0.1240.450781
20-0.136023-1.41360.080178
210.0659780.68570.247198
22-0.16357-1.69990.046017
23-0.008588-0.08930.464523
24-0.028439-0.29560.38407
25-0.084236-0.87540.191648
26-0.012121-0.1260.449995
27-0.06546-0.68030.248892
28-0.020247-0.21040.416869
29-0.113147-1.17590.121119
300.0532440.55330.290593
31-0.012905-0.13410.44678
32-0.004611-0.04790.480935
330.0320790.33340.369748
340.0096990.10080.459952
35-0.065003-0.67550.25039
36-0.253998-2.63960.004764
37-0.04929-0.51220.304766
380.0173530.18030.428613
39-0.079879-0.83010.204149
40-0.130205-1.35310.089421
410.0540410.56160.287771
420.0252730.26260.396663
430.0150940.15690.437825
44-0.009553-0.09930.460551
45-0.007355-0.07640.469607
46-0.018659-0.19390.423305
470.0644920.67020.252075
48-0.163884-1.70310.04571
49-0.084724-0.88050.190277
50-0.091497-0.95090.171899
510.0306940.3190.375177
520.0365570.37990.352377
53-0.006582-0.06840.472796
540.0890860.92580.178306
55-0.016466-0.17110.432227
56-0.018195-0.18910.425189
570.0316310.32870.371504
58-0.038848-0.40370.343609
590.0052760.05480.47819
60-0.014096-0.14650.441905


Parameters (Session):
par1 = 60 ; par2 = 1 ; par3 = 1 ; par4 = 1 ; par5 = 12 ;
Parameters (R input):
par1 = 60 ; par2 = 1 ; par3 = 1 ; par4 = 1 ; par5 = 12 ;
R code (references can be found in the software module):
if (par1 == 'Default') {
par1 = 10*log10(length(x))
} else {
par1 <- as.numeric(par1)
}
par2 <- as.numeric(par2)
par3 <- as.numeric(par3)
par4 <- as.numeric(par4)
par5 <- as.numeric(par5)
if (par2 == 0) {
x <- log(x)
} else {
x <- (x ^ par2 - 1) / par2
}
if (par3 > 0) x <- diff(x,lag=1,difference=par3)
if (par4 > 0) x <- diff(x,lag=par5,difference=par4)
bitmap(file='pic1.png')
racf <- acf(x,par1,main='Autocorrelation',xlab='lags',ylab='ACF')
dev.off()
bitmap(file='pic2.png')
rpacf <- pacf(x,par1,main='Partial Autocorrelation',xlab='lags',ylab='PACF')
dev.off()
(myacf <- c(racf$acf))
(mypacf <- c(rpacf$acf))
lengthx <- length(x)
sqrtn <- sqrt(lengthx)
load(file='createtable')
a<-table.start()
a<-table.row.start(a)
a<-table.element(a,'Autocorrelation Function',4,TRUE)
a<-table.row.end(a)
a<-table.row.start(a)
a<-table.element(a,'Time lag k',header=TRUE)
a<-table.element(a,hyperlink('basics.htm','ACF(k)','click here for more information about the Autocorrelation Function'),header=TRUE)
a<-table.element(a,'T-STAT',header=TRUE)
a<-table.element(a,'P-value',header=TRUE)
a<-table.row.end(a)
for (i in 2:(par1+1)) {
a<-table.row.start(a)
a<-table.element(a,i-1,header=TRUE)
a<-table.element(a,round(myacf[i],6))
mytstat <- myacf[i]*sqrtn
a<-table.element(a,round(mytstat,4))
a<-table.element(a,round(1-pt(abs(mytstat),lengthx),6))
a<-table.row.end(a)
}
a<-table.end(a)
table.save(a,file='mytable.tab')
a<-table.start()
a<-table.row.start(a)
a<-table.element(a,'Partial Autocorrelation Function',4,TRUE)
a<-table.row.end(a)
a<-table.row.start(a)
a<-table.element(a,'Time lag k',header=TRUE)
a<-table.element(a,hyperlink('basics.htm','PACF(k)','click here for more information about the Partial Autocorrelation Function'),header=TRUE)
a<-table.element(a,'T-STAT',header=TRUE)
a<-table.element(a,'P-value',header=TRUE)
a<-table.row.end(a)
for (i in 1:par1) {
a<-table.row.start(a)
a<-table.element(a,i,header=TRUE)
a<-table.element(a,round(mypacf[i],6))
mytstat <- mypacf[i]*sqrtn
a<-table.element(a,round(mytstat,4))
a<-table.element(a,round(1-pt(abs(mytstat),lengthx),6))
a<-table.row.end(a)
}
a<-table.end(a)
table.save(a,file='mytable1.tab')