Free Statistics

of Irreproducible Research!

Author's title

Author*The author of this computation has been verified*
R Software Modulerwasp_autocorrelation.wasp
Title produced by software(Partial) Autocorrelation Function
Date of computationMon, 15 Dec 2008 07:10:48 -0700
Cite this page as followsStatistical Computations at FreeStatistics.org, Office for Research Development and Education, URL https://freestatistics.org/blog/index.php?v=date/2008/Dec/15/t1229350307banbwtv4z70q0po.htm/, Retrieved Thu, 16 May 2024 02:19:26 +0000
Statistical Computations at FreeStatistics.org, Office for Research Development and Education, URL https://freestatistics.org/blog/index.php?pk=33690, Retrieved Thu, 16 May 2024 02:19:26 +0000
QR Codes:

Original text written by user:
IsPrivate?No (this computation is public)
User-defined keywords
Estimated Impact157
Family? (F = Feedback message, R = changed R code, M = changed R Module, P = changed Parameters, D = changed Data)
-       [(Partial) Autocorrelation Function] [paper uitvoer] [2008-12-15 14:10:48] [56fd94b954e08a6655cb7790b21ee404] [Current]
Feedback Forum

Post a new message
Dataseries X:
6392.3
8686.4
9244.7
8182.7
7451.4
7988.8
8243.5
8843
9092.7
8246.7
9311.7
8341.2
7116.7
9635.7
9815.4
8611.3
8297.8
8715.1
8919.9
10085.8
9511.7
8991.3
10311.2
8895.4
7449.8
10084
9859.4
9100.1
8920.8
8502.7
8599.6
10394.4
9290.4
8742.2
10217.3
8639
8139.6
10779.1
10427.7
10349.1
10036.4
9492.1
10638.8
12054.5
10324.7
11817.3
11008.9
9996.6
9419.5
11958.8
12594.6
11890.6
10871.7
11835.7
11542.2
13093.7
11180.2
12035.7
12112
10875.2
9897.3
11672.1
12385.7
11405.6
9830.9
11025.1
10853.8
12252.6
11839.4
11669.1
11601.4
11178.4
9516.4
12102.8
12989
11610.2
10205.5
11356.2
11307.1
12648.6
11947.2
11714.1
12192.5
11268.8
9097.4
12639.8
13040.1
11687.3
11191.7
11391.9
11793.1
13933.2
12778.1
11810.3
13698.4
11956.6
10723.8
13938.9
13979.8
13807.4
12973.9
12509.8
12934.1
14908.3
13772.1
13012.6
14049.9
11816.5
11593.2
14466.2
13615.9
14733.9
13880.7
13527.5
13584
16170.2
13260.6
14741.9
15486.5
13154.5
12621.2


Summary of computational transaction
Raw Inputview raw input (R code)
Raw Outputview raw output of R engine
Computing time1 seconds
R Server'Gwilym Jenkins' @ 72.249.127.135

\begin{tabular}{lllllllll}
\hline
Summary of computational transaction \tabularnewline
Raw Input & view raw input (R code)  \tabularnewline
Raw Output & view raw output of R engine  \tabularnewline
Computing time & 1 seconds \tabularnewline
R Server & 'Gwilym Jenkins' @ 72.249.127.135 \tabularnewline
\hline
\end{tabular}
%Source: https://freestatistics.org/blog/index.php?pk=33690&T=0

[TABLE]
[ROW][C]Summary of computational transaction[/C][/ROW]
[ROW][C]Raw Input[/C][C]view raw input (R code) [/C][/ROW]
[ROW][C]Raw Output[/C][C]view raw output of R engine [/C][/ROW]
[ROW][C]Computing time[/C][C]1 seconds[/C][/ROW]
[ROW][C]R Server[/C][C]'Gwilym Jenkins' @ 72.249.127.135[/C][/ROW]
[/TABLE]
Source: https://freestatistics.org/blog/index.php?pk=33690&T=0

Globally Unique Identifier (entire table): ba.freestatistics.org/blog/index.php?pk=33690&T=0

As an alternative you can also use a QR Code:  

The GUIDs for individual cells are displayed in the table below:

Summary of computational transaction
Raw Inputview raw input (R code)
Raw Outputview raw output of R engine
Computing time1 seconds
R Server'Gwilym Jenkins' @ 72.249.127.135


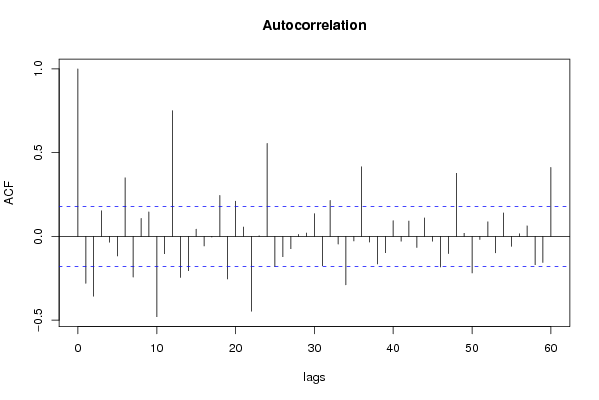
Autocorrelation Function
Time lag kACF(k)T-STATP-value
1-0.279471-3.06150.001359
2-0.356274-3.90287.9e-05
30.1531471.67760.04801
4-0.033942-0.37180.355343
5-0.116187-1.27280.102781
60.3500193.83430.000101
7-0.241949-2.65040.004562
80.1077541.18040.120091
90.1464271.6040.055669
10-0.47861-5.24290
11-0.102611-1.1240.131618
120.750728.22370
13-0.244913-2.68290.004164
14-0.203907-2.23370.013678
150.0431850.47310.318512
16-0.05616-0.61520.269794
17-0.003639-0.03990.484135
180.2452042.68610.004127
19-0.253728-2.77950.003161
200.2103882.30470.011452
210.0562760.61650.269376
22-0.446013-4.88582e-06
230.0039740.04350.482676
240.5552626.08260
25-0.180471-1.9770.025169
26-0.12082-1.32350.09409
27-0.072839-0.79790.21325
280.0121350.13290.447233
290.0203390.22280.412033
300.1359541.48930.069516
31-0.174267-1.9090.029325
320.2150262.35550.01006
33-0.045134-0.49440.310959
34-0.288481-3.16020.000998
35-0.026953-0.29530.384155
360.4161264.55846e-06
37-0.033643-0.36850.356561
38-0.163854-1.79490.037591
39-0.097115-1.06380.144769
400.0940251.030.152543
41-0.028536-0.31260.377563
420.0917391.00490.158472
43-0.065251-0.71480.238063
440.1106481.21210.11393
45-0.0282-0.30890.378962
46-0.181852-1.99210.024316
47-0.102222-1.11980.13252
480.3767294.12693.4e-05
490.0187730.20560.418707
50-0.217647-2.38420.009342
51-0.017926-0.19640.422327
520.0877890.96170.169071
53-0.097806-1.07140.143067
540.1403861.53790.063358
55-0.058547-0.64130.26126
560.015950.17470.430797
570.0633090.69350.244662
58-0.168279-1.84340.033869
59-0.1547-1.69470.046367
600.4122094.51557e-06

\begin{tabular}{lllllllll}
\hline
Autocorrelation Function \tabularnewline
Time lag k & ACF(k) & T-STAT & P-value \tabularnewline
1 & -0.279471 & -3.0615 & 0.001359 \tabularnewline
2 & -0.356274 & -3.9028 & 7.9e-05 \tabularnewline
3 & 0.153147 & 1.6776 & 0.04801 \tabularnewline
4 & -0.033942 & -0.3718 & 0.355343 \tabularnewline
5 & -0.116187 & -1.2728 & 0.102781 \tabularnewline
6 & 0.350019 & 3.8343 & 0.000101 \tabularnewline
7 & -0.241949 & -2.6504 & 0.004562 \tabularnewline
8 & 0.107754 & 1.1804 & 0.120091 \tabularnewline
9 & 0.146427 & 1.604 & 0.055669 \tabularnewline
10 & -0.47861 & -5.2429 & 0 \tabularnewline
11 & -0.102611 & -1.124 & 0.131618 \tabularnewline
12 & 0.75072 & 8.2237 & 0 \tabularnewline
13 & -0.244913 & -2.6829 & 0.004164 \tabularnewline
14 & -0.203907 & -2.2337 & 0.013678 \tabularnewline
15 & 0.043185 & 0.4731 & 0.318512 \tabularnewline
16 & -0.05616 & -0.6152 & 0.269794 \tabularnewline
17 & -0.003639 & -0.0399 & 0.484135 \tabularnewline
18 & 0.245204 & 2.6861 & 0.004127 \tabularnewline
19 & -0.253728 & -2.7795 & 0.003161 \tabularnewline
20 & 0.210388 & 2.3047 & 0.011452 \tabularnewline
21 & 0.056276 & 0.6165 & 0.269376 \tabularnewline
22 & -0.446013 & -4.8858 & 2e-06 \tabularnewline
23 & 0.003974 & 0.0435 & 0.482676 \tabularnewline
24 & 0.555262 & 6.0826 & 0 \tabularnewline
25 & -0.180471 & -1.977 & 0.025169 \tabularnewline
26 & -0.12082 & -1.3235 & 0.09409 \tabularnewline
27 & -0.072839 & -0.7979 & 0.21325 \tabularnewline
28 & 0.012135 & 0.1329 & 0.447233 \tabularnewline
29 & 0.020339 & 0.2228 & 0.412033 \tabularnewline
30 & 0.135954 & 1.4893 & 0.069516 \tabularnewline
31 & -0.174267 & -1.909 & 0.029325 \tabularnewline
32 & 0.215026 & 2.3555 & 0.01006 \tabularnewline
33 & -0.045134 & -0.4944 & 0.310959 \tabularnewline
34 & -0.288481 & -3.1602 & 0.000998 \tabularnewline
35 & -0.026953 & -0.2953 & 0.384155 \tabularnewline
36 & 0.416126 & 4.5584 & 6e-06 \tabularnewline
37 & -0.033643 & -0.3685 & 0.356561 \tabularnewline
38 & -0.163854 & -1.7949 & 0.037591 \tabularnewline
39 & -0.097115 & -1.0638 & 0.144769 \tabularnewline
40 & 0.094025 & 1.03 & 0.152543 \tabularnewline
41 & -0.028536 & -0.3126 & 0.377563 \tabularnewline
42 & 0.091739 & 1.0049 & 0.158472 \tabularnewline
43 & -0.065251 & -0.7148 & 0.238063 \tabularnewline
44 & 0.110648 & 1.2121 & 0.11393 \tabularnewline
45 & -0.0282 & -0.3089 & 0.378962 \tabularnewline
46 & -0.181852 & -1.9921 & 0.024316 \tabularnewline
47 & -0.102222 & -1.1198 & 0.13252 \tabularnewline
48 & 0.376729 & 4.1269 & 3.4e-05 \tabularnewline
49 & 0.018773 & 0.2056 & 0.418707 \tabularnewline
50 & -0.217647 & -2.3842 & 0.009342 \tabularnewline
51 & -0.017926 & -0.1964 & 0.422327 \tabularnewline
52 & 0.087789 & 0.9617 & 0.169071 \tabularnewline
53 & -0.097806 & -1.0714 & 0.143067 \tabularnewline
54 & 0.140386 & 1.5379 & 0.063358 \tabularnewline
55 & -0.058547 & -0.6413 & 0.26126 \tabularnewline
56 & 0.01595 & 0.1747 & 0.430797 \tabularnewline
57 & 0.063309 & 0.6935 & 0.244662 \tabularnewline
58 & -0.168279 & -1.8434 & 0.033869 \tabularnewline
59 & -0.1547 & -1.6947 & 0.046367 \tabularnewline
60 & 0.412209 & 4.5155 & 7e-06 \tabularnewline
\hline
\end{tabular}
%Source: https://freestatistics.org/blog/index.php?pk=33690&T=1

[TABLE]
[ROW][C]Autocorrelation Function[/C][/ROW]
[ROW][C]Time lag k[/C][C]ACF(k)[/C][C]T-STAT[/C][C]P-value[/C][/ROW]
[ROW][C]1[/C][C]-0.279471[/C][C]-3.0615[/C][C]0.001359[/C][/ROW]
[ROW][C]2[/C][C]-0.356274[/C][C]-3.9028[/C][C]7.9e-05[/C][/ROW]
[ROW][C]3[/C][C]0.153147[/C][C]1.6776[/C][C]0.04801[/C][/ROW]
[ROW][C]4[/C][C]-0.033942[/C][C]-0.3718[/C][C]0.355343[/C][/ROW]
[ROW][C]5[/C][C]-0.116187[/C][C]-1.2728[/C][C]0.102781[/C][/ROW]
[ROW][C]6[/C][C]0.350019[/C][C]3.8343[/C][C]0.000101[/C][/ROW]
[ROW][C]7[/C][C]-0.241949[/C][C]-2.6504[/C][C]0.004562[/C][/ROW]
[ROW][C]8[/C][C]0.107754[/C][C]1.1804[/C][C]0.120091[/C][/ROW]
[ROW][C]9[/C][C]0.146427[/C][C]1.604[/C][C]0.055669[/C][/ROW]
[ROW][C]10[/C][C]-0.47861[/C][C]-5.2429[/C][C]0[/C][/ROW]
[ROW][C]11[/C][C]-0.102611[/C][C]-1.124[/C][C]0.131618[/C][/ROW]
[ROW][C]12[/C][C]0.75072[/C][C]8.2237[/C][C]0[/C][/ROW]
[ROW][C]13[/C][C]-0.244913[/C][C]-2.6829[/C][C]0.004164[/C][/ROW]
[ROW][C]14[/C][C]-0.203907[/C][C]-2.2337[/C][C]0.013678[/C][/ROW]
[ROW][C]15[/C][C]0.043185[/C][C]0.4731[/C][C]0.318512[/C][/ROW]
[ROW][C]16[/C][C]-0.05616[/C][C]-0.6152[/C][C]0.269794[/C][/ROW]
[ROW][C]17[/C][C]-0.003639[/C][C]-0.0399[/C][C]0.484135[/C][/ROW]
[ROW][C]18[/C][C]0.245204[/C][C]2.6861[/C][C]0.004127[/C][/ROW]
[ROW][C]19[/C][C]-0.253728[/C][C]-2.7795[/C][C]0.003161[/C][/ROW]
[ROW][C]20[/C][C]0.210388[/C][C]2.3047[/C][C]0.011452[/C][/ROW]
[ROW][C]21[/C][C]0.056276[/C][C]0.6165[/C][C]0.269376[/C][/ROW]
[ROW][C]22[/C][C]-0.446013[/C][C]-4.8858[/C][C]2e-06[/C][/ROW]
[ROW][C]23[/C][C]0.003974[/C][C]0.0435[/C][C]0.482676[/C][/ROW]
[ROW][C]24[/C][C]0.555262[/C][C]6.0826[/C][C]0[/C][/ROW]
[ROW][C]25[/C][C]-0.180471[/C][C]-1.977[/C][C]0.025169[/C][/ROW]
[ROW][C]26[/C][C]-0.12082[/C][C]-1.3235[/C][C]0.09409[/C][/ROW]
[ROW][C]27[/C][C]-0.072839[/C][C]-0.7979[/C][C]0.21325[/C][/ROW]
[ROW][C]28[/C][C]0.012135[/C][C]0.1329[/C][C]0.447233[/C][/ROW]
[ROW][C]29[/C][C]0.020339[/C][C]0.2228[/C][C]0.412033[/C][/ROW]
[ROW][C]30[/C][C]0.135954[/C][C]1.4893[/C][C]0.069516[/C][/ROW]
[ROW][C]31[/C][C]-0.174267[/C][C]-1.909[/C][C]0.029325[/C][/ROW]
[ROW][C]32[/C][C]0.215026[/C][C]2.3555[/C][C]0.01006[/C][/ROW]
[ROW][C]33[/C][C]-0.045134[/C][C]-0.4944[/C][C]0.310959[/C][/ROW]
[ROW][C]34[/C][C]-0.288481[/C][C]-3.1602[/C][C]0.000998[/C][/ROW]
[ROW][C]35[/C][C]-0.026953[/C][C]-0.2953[/C][C]0.384155[/C][/ROW]
[ROW][C]36[/C][C]0.416126[/C][C]4.5584[/C][C]6e-06[/C][/ROW]
[ROW][C]37[/C][C]-0.033643[/C][C]-0.3685[/C][C]0.356561[/C][/ROW]
[ROW][C]38[/C][C]-0.163854[/C][C]-1.7949[/C][C]0.037591[/C][/ROW]
[ROW][C]39[/C][C]-0.097115[/C][C]-1.0638[/C][C]0.144769[/C][/ROW]
[ROW][C]40[/C][C]0.094025[/C][C]1.03[/C][C]0.152543[/C][/ROW]
[ROW][C]41[/C][C]-0.028536[/C][C]-0.3126[/C][C]0.377563[/C][/ROW]
[ROW][C]42[/C][C]0.091739[/C][C]1.0049[/C][C]0.158472[/C][/ROW]
[ROW][C]43[/C][C]-0.065251[/C][C]-0.7148[/C][C]0.238063[/C][/ROW]
[ROW][C]44[/C][C]0.110648[/C][C]1.2121[/C][C]0.11393[/C][/ROW]
[ROW][C]45[/C][C]-0.0282[/C][C]-0.3089[/C][C]0.378962[/C][/ROW]
[ROW][C]46[/C][C]-0.181852[/C][C]-1.9921[/C][C]0.024316[/C][/ROW]
[ROW][C]47[/C][C]-0.102222[/C][C]-1.1198[/C][C]0.13252[/C][/ROW]
[ROW][C]48[/C][C]0.376729[/C][C]4.1269[/C][C]3.4e-05[/C][/ROW]
[ROW][C]49[/C][C]0.018773[/C][C]0.2056[/C][C]0.418707[/C][/ROW]
[ROW][C]50[/C][C]-0.217647[/C][C]-2.3842[/C][C]0.009342[/C][/ROW]
[ROW][C]51[/C][C]-0.017926[/C][C]-0.1964[/C][C]0.422327[/C][/ROW]
[ROW][C]52[/C][C]0.087789[/C][C]0.9617[/C][C]0.169071[/C][/ROW]
[ROW][C]53[/C][C]-0.097806[/C][C]-1.0714[/C][C]0.143067[/C][/ROW]
[ROW][C]54[/C][C]0.140386[/C][C]1.5379[/C][C]0.063358[/C][/ROW]
[ROW][C]55[/C][C]-0.058547[/C][C]-0.6413[/C][C]0.26126[/C][/ROW]
[ROW][C]56[/C][C]0.01595[/C][C]0.1747[/C][C]0.430797[/C][/ROW]
[ROW][C]57[/C][C]0.063309[/C][C]0.6935[/C][C]0.244662[/C][/ROW]
[ROW][C]58[/C][C]-0.168279[/C][C]-1.8434[/C][C]0.033869[/C][/ROW]
[ROW][C]59[/C][C]-0.1547[/C][C]-1.6947[/C][C]0.046367[/C][/ROW]
[ROW][C]60[/C][C]0.412209[/C][C]4.5155[/C][C]7e-06[/C][/ROW]
[/TABLE]
Source: https://freestatistics.org/blog/index.php?pk=33690&T=1

Globally Unique Identifier (entire table): ba.freestatistics.org/blog/index.php?pk=33690&T=1

As an alternative you can also use a QR Code:  

The GUIDs for individual cells are displayed in the table below:

Autocorrelation Function
Time lag kACF(k)T-STATP-value
1-0.279471-3.06150.001359
2-0.356274-3.90287.9e-05
30.1531471.67760.04801
4-0.033942-0.37180.355343
5-0.116187-1.27280.102781
60.3500193.83430.000101
7-0.241949-2.65040.004562
80.1077541.18040.120091
90.1464271.6040.055669
10-0.47861-5.24290
11-0.102611-1.1240.131618
120.750728.22370
13-0.244913-2.68290.004164
14-0.203907-2.23370.013678
150.0431850.47310.318512
16-0.05616-0.61520.269794
17-0.003639-0.03990.484135
180.2452042.68610.004127
19-0.253728-2.77950.003161
200.2103882.30470.011452
210.0562760.61650.269376
22-0.446013-4.88582e-06
230.0039740.04350.482676
240.5552626.08260
25-0.180471-1.9770.025169
26-0.12082-1.32350.09409
27-0.072839-0.79790.21325
280.0121350.13290.447233
290.0203390.22280.412033
300.1359541.48930.069516
31-0.174267-1.9090.029325
320.2150262.35550.01006
33-0.045134-0.49440.310959
34-0.288481-3.16020.000998
35-0.026953-0.29530.384155
360.4161264.55846e-06
37-0.033643-0.36850.356561
38-0.163854-1.79490.037591
39-0.097115-1.06380.144769
400.0940251.030.152543
41-0.028536-0.31260.377563
420.0917391.00490.158472
43-0.065251-0.71480.238063
440.1106481.21210.11393
45-0.0282-0.30890.378962
46-0.181852-1.99210.024316
47-0.102222-1.11980.13252
480.3767294.12693.4e-05
490.0187730.20560.418707
50-0.217647-2.38420.009342
51-0.017926-0.19640.422327
520.0877890.96170.169071
53-0.097806-1.07140.143067
540.1403861.53790.063358
55-0.058547-0.64130.26126
560.015950.17470.430797
570.0633090.69350.244662
58-0.168279-1.84340.033869
59-0.1547-1.69470.046367
600.4122094.51557e-06


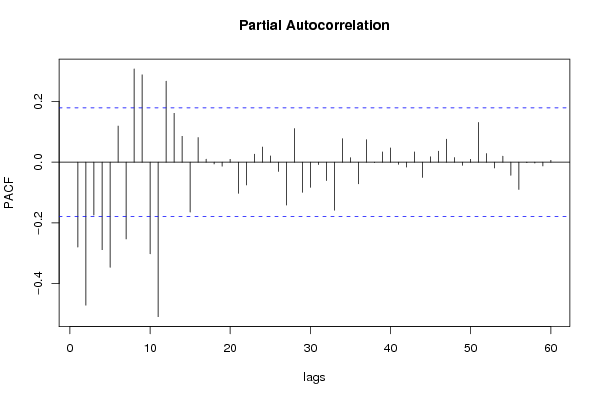
Partial Autocorrelation Function
Time lag kPACF(k)T-STATP-value
1-0.279471-3.06150.001359
2-0.47118-5.16150
3-0.174307-1.90940.029297
4-0.288328-3.15850.001003
5-0.346417-3.79480.000117
60.1189811.30340.097472
7-0.252958-2.7710.003239
80.306953.36250.000519
90.2874793.14920.001033
10-0.301997-3.30820.00062
11-0.508725-5.57280
120.2665332.91970.002093
130.1606981.76040.040448
140.0851510.93280.176402
15-0.164457-1.80150.037065
160.0809570.88680.18847
170.0099110.10860.456862
18-0.005848-0.06410.474514
19-0.01313-0.14380.442938
200.009290.10180.459555
21-0.102409-1.12180.132086
22-0.075105-0.82270.206144
230.0264290.28950.386345
240.0497860.54540.293254
250.0206990.22670.410503
26-0.030389-0.33290.369899
27-0.141288-1.54770.06216
280.1106571.21220.113911
29-0.099164-1.08630.139764
30-0.082826-0.90730.18303
31-0.007811-0.08560.465979
32-0.060656-0.66450.253838
33-0.158292-1.7340.042743
340.0774520.84840.198939
350.0149160.16340.435242
36-0.071161-0.77950.218601
370.0740610.81130.209401
38-0.001427-0.01560.493777
390.03360.36810.356735
400.0467310.51190.304828
41-0.007125-0.07810.468958
42-0.016084-0.17620.43022
430.0338680.3710.355643
44-0.050418-0.55230.290886
450.0175160.19190.424081
460.0360460.39490.346822
470.0756380.82860.204495
480.0152540.16710.433787
49-0.010287-0.11270.455234
500.009270.10150.459644
510.1307471.43230.077335
520.0281870.30880.379014
53-0.019158-0.20990.417066
540.0196320.21510.415044
55-0.0435-0.47650.317284
56-0.089944-0.98530.163232
57-0.001889-0.02070.491762
58-0.003102-0.0340.486476
59-0.012551-0.13750.445435
600.0062860.06890.472609

\begin{tabular}{lllllllll}
\hline
Partial Autocorrelation Function \tabularnewline
Time lag k & PACF(k) & T-STAT & P-value \tabularnewline
1 & -0.279471 & -3.0615 & 0.001359 \tabularnewline
2 & -0.47118 & -5.1615 & 0 \tabularnewline
3 & -0.174307 & -1.9094 & 0.029297 \tabularnewline
4 & -0.288328 & -3.1585 & 0.001003 \tabularnewline
5 & -0.346417 & -3.7948 & 0.000117 \tabularnewline
6 & 0.118981 & 1.3034 & 0.097472 \tabularnewline
7 & -0.252958 & -2.771 & 0.003239 \tabularnewline
8 & 0.30695 & 3.3625 & 0.000519 \tabularnewline
9 & 0.287479 & 3.1492 & 0.001033 \tabularnewline
10 & -0.301997 & -3.3082 & 0.00062 \tabularnewline
11 & -0.508725 & -5.5728 & 0 \tabularnewline
12 & 0.266533 & 2.9197 & 0.002093 \tabularnewline
13 & 0.160698 & 1.7604 & 0.040448 \tabularnewline
14 & 0.085151 & 0.9328 & 0.176402 \tabularnewline
15 & -0.164457 & -1.8015 & 0.037065 \tabularnewline
16 & 0.080957 & 0.8868 & 0.18847 \tabularnewline
17 & 0.009911 & 0.1086 & 0.456862 \tabularnewline
18 & -0.005848 & -0.0641 & 0.474514 \tabularnewline
19 & -0.01313 & -0.1438 & 0.442938 \tabularnewline
20 & 0.00929 & 0.1018 & 0.459555 \tabularnewline
21 & -0.102409 & -1.1218 & 0.132086 \tabularnewline
22 & -0.075105 & -0.8227 & 0.206144 \tabularnewline
23 & 0.026429 & 0.2895 & 0.386345 \tabularnewline
24 & 0.049786 & 0.5454 & 0.293254 \tabularnewline
25 & 0.020699 & 0.2267 & 0.410503 \tabularnewline
26 & -0.030389 & -0.3329 & 0.369899 \tabularnewline
27 & -0.141288 & -1.5477 & 0.06216 \tabularnewline
28 & 0.110657 & 1.2122 & 0.113911 \tabularnewline
29 & -0.099164 & -1.0863 & 0.139764 \tabularnewline
30 & -0.082826 & -0.9073 & 0.18303 \tabularnewline
31 & -0.007811 & -0.0856 & 0.465979 \tabularnewline
32 & -0.060656 & -0.6645 & 0.253838 \tabularnewline
33 & -0.158292 & -1.734 & 0.042743 \tabularnewline
34 & 0.077452 & 0.8484 & 0.198939 \tabularnewline
35 & 0.014916 & 0.1634 & 0.435242 \tabularnewline
36 & -0.071161 & -0.7795 & 0.218601 \tabularnewline
37 & 0.074061 & 0.8113 & 0.209401 \tabularnewline
38 & -0.001427 & -0.0156 & 0.493777 \tabularnewline
39 & 0.0336 & 0.3681 & 0.356735 \tabularnewline
40 & 0.046731 & 0.5119 & 0.304828 \tabularnewline
41 & -0.007125 & -0.0781 & 0.468958 \tabularnewline
42 & -0.016084 & -0.1762 & 0.43022 \tabularnewline
43 & 0.033868 & 0.371 & 0.355643 \tabularnewline
44 & -0.050418 & -0.5523 & 0.290886 \tabularnewline
45 & 0.017516 & 0.1919 & 0.424081 \tabularnewline
46 & 0.036046 & 0.3949 & 0.346822 \tabularnewline
47 & 0.075638 & 0.8286 & 0.204495 \tabularnewline
48 & 0.015254 & 0.1671 & 0.433787 \tabularnewline
49 & -0.010287 & -0.1127 & 0.455234 \tabularnewline
50 & 0.00927 & 0.1015 & 0.459644 \tabularnewline
51 & 0.130747 & 1.4323 & 0.077335 \tabularnewline
52 & 0.028187 & 0.3088 & 0.379014 \tabularnewline
53 & -0.019158 & -0.2099 & 0.417066 \tabularnewline
54 & 0.019632 & 0.2151 & 0.415044 \tabularnewline
55 & -0.0435 & -0.4765 & 0.317284 \tabularnewline
56 & -0.089944 & -0.9853 & 0.163232 \tabularnewline
57 & -0.001889 & -0.0207 & 0.491762 \tabularnewline
58 & -0.003102 & -0.034 & 0.486476 \tabularnewline
59 & -0.012551 & -0.1375 & 0.445435 \tabularnewline
60 & 0.006286 & 0.0689 & 0.472609 \tabularnewline
\hline
\end{tabular}
%Source: https://freestatistics.org/blog/index.php?pk=33690&T=2

[TABLE]
[ROW][C]Partial Autocorrelation Function[/C][/ROW]
[ROW][C]Time lag k[/C][C]PACF(k)[/C][C]T-STAT[/C][C]P-value[/C][/ROW]
[ROW][C]1[/C][C]-0.279471[/C][C]-3.0615[/C][C]0.001359[/C][/ROW]
[ROW][C]2[/C][C]-0.47118[/C][C]-5.1615[/C][C]0[/C][/ROW]
[ROW][C]3[/C][C]-0.174307[/C][C]-1.9094[/C][C]0.029297[/C][/ROW]
[ROW][C]4[/C][C]-0.288328[/C][C]-3.1585[/C][C]0.001003[/C][/ROW]
[ROW][C]5[/C][C]-0.346417[/C][C]-3.7948[/C][C]0.000117[/C][/ROW]
[ROW][C]6[/C][C]0.118981[/C][C]1.3034[/C][C]0.097472[/C][/ROW]
[ROW][C]7[/C][C]-0.252958[/C][C]-2.771[/C][C]0.003239[/C][/ROW]
[ROW][C]8[/C][C]0.30695[/C][C]3.3625[/C][C]0.000519[/C][/ROW]
[ROW][C]9[/C][C]0.287479[/C][C]3.1492[/C][C]0.001033[/C][/ROW]
[ROW][C]10[/C][C]-0.301997[/C][C]-3.3082[/C][C]0.00062[/C][/ROW]
[ROW][C]11[/C][C]-0.508725[/C][C]-5.5728[/C][C]0[/C][/ROW]
[ROW][C]12[/C][C]0.266533[/C][C]2.9197[/C][C]0.002093[/C][/ROW]
[ROW][C]13[/C][C]0.160698[/C][C]1.7604[/C][C]0.040448[/C][/ROW]
[ROW][C]14[/C][C]0.085151[/C][C]0.9328[/C][C]0.176402[/C][/ROW]
[ROW][C]15[/C][C]-0.164457[/C][C]-1.8015[/C][C]0.037065[/C][/ROW]
[ROW][C]16[/C][C]0.080957[/C][C]0.8868[/C][C]0.18847[/C][/ROW]
[ROW][C]17[/C][C]0.009911[/C][C]0.1086[/C][C]0.456862[/C][/ROW]
[ROW][C]18[/C][C]-0.005848[/C][C]-0.0641[/C][C]0.474514[/C][/ROW]
[ROW][C]19[/C][C]-0.01313[/C][C]-0.1438[/C][C]0.442938[/C][/ROW]
[ROW][C]20[/C][C]0.00929[/C][C]0.1018[/C][C]0.459555[/C][/ROW]
[ROW][C]21[/C][C]-0.102409[/C][C]-1.1218[/C][C]0.132086[/C][/ROW]
[ROW][C]22[/C][C]-0.075105[/C][C]-0.8227[/C][C]0.206144[/C][/ROW]
[ROW][C]23[/C][C]0.026429[/C][C]0.2895[/C][C]0.386345[/C][/ROW]
[ROW][C]24[/C][C]0.049786[/C][C]0.5454[/C][C]0.293254[/C][/ROW]
[ROW][C]25[/C][C]0.020699[/C][C]0.2267[/C][C]0.410503[/C][/ROW]
[ROW][C]26[/C][C]-0.030389[/C][C]-0.3329[/C][C]0.369899[/C][/ROW]
[ROW][C]27[/C][C]-0.141288[/C][C]-1.5477[/C][C]0.06216[/C][/ROW]
[ROW][C]28[/C][C]0.110657[/C][C]1.2122[/C][C]0.113911[/C][/ROW]
[ROW][C]29[/C][C]-0.099164[/C][C]-1.0863[/C][C]0.139764[/C][/ROW]
[ROW][C]30[/C][C]-0.082826[/C][C]-0.9073[/C][C]0.18303[/C][/ROW]
[ROW][C]31[/C][C]-0.007811[/C][C]-0.0856[/C][C]0.465979[/C][/ROW]
[ROW][C]32[/C][C]-0.060656[/C][C]-0.6645[/C][C]0.253838[/C][/ROW]
[ROW][C]33[/C][C]-0.158292[/C][C]-1.734[/C][C]0.042743[/C][/ROW]
[ROW][C]34[/C][C]0.077452[/C][C]0.8484[/C][C]0.198939[/C][/ROW]
[ROW][C]35[/C][C]0.014916[/C][C]0.1634[/C][C]0.435242[/C][/ROW]
[ROW][C]36[/C][C]-0.071161[/C][C]-0.7795[/C][C]0.218601[/C][/ROW]
[ROW][C]37[/C][C]0.074061[/C][C]0.8113[/C][C]0.209401[/C][/ROW]
[ROW][C]38[/C][C]-0.001427[/C][C]-0.0156[/C][C]0.493777[/C][/ROW]
[ROW][C]39[/C][C]0.0336[/C][C]0.3681[/C][C]0.356735[/C][/ROW]
[ROW][C]40[/C][C]0.046731[/C][C]0.5119[/C][C]0.304828[/C][/ROW]
[ROW][C]41[/C][C]-0.007125[/C][C]-0.0781[/C][C]0.468958[/C][/ROW]
[ROW][C]42[/C][C]-0.016084[/C][C]-0.1762[/C][C]0.43022[/C][/ROW]
[ROW][C]43[/C][C]0.033868[/C][C]0.371[/C][C]0.355643[/C][/ROW]
[ROW][C]44[/C][C]-0.050418[/C][C]-0.5523[/C][C]0.290886[/C][/ROW]
[ROW][C]45[/C][C]0.017516[/C][C]0.1919[/C][C]0.424081[/C][/ROW]
[ROW][C]46[/C][C]0.036046[/C][C]0.3949[/C][C]0.346822[/C][/ROW]
[ROW][C]47[/C][C]0.075638[/C][C]0.8286[/C][C]0.204495[/C][/ROW]
[ROW][C]48[/C][C]0.015254[/C][C]0.1671[/C][C]0.433787[/C][/ROW]
[ROW][C]49[/C][C]-0.010287[/C][C]-0.1127[/C][C]0.455234[/C][/ROW]
[ROW][C]50[/C][C]0.00927[/C][C]0.1015[/C][C]0.459644[/C][/ROW]
[ROW][C]51[/C][C]0.130747[/C][C]1.4323[/C][C]0.077335[/C][/ROW]
[ROW][C]52[/C][C]0.028187[/C][C]0.3088[/C][C]0.379014[/C][/ROW]
[ROW][C]53[/C][C]-0.019158[/C][C]-0.2099[/C][C]0.417066[/C][/ROW]
[ROW][C]54[/C][C]0.019632[/C][C]0.2151[/C][C]0.415044[/C][/ROW]
[ROW][C]55[/C][C]-0.0435[/C][C]-0.4765[/C][C]0.317284[/C][/ROW]
[ROW][C]56[/C][C]-0.089944[/C][C]-0.9853[/C][C]0.163232[/C][/ROW]
[ROW][C]57[/C][C]-0.001889[/C][C]-0.0207[/C][C]0.491762[/C][/ROW]
[ROW][C]58[/C][C]-0.003102[/C][C]-0.034[/C][C]0.486476[/C][/ROW]
[ROW][C]59[/C][C]-0.012551[/C][C]-0.1375[/C][C]0.445435[/C][/ROW]
[ROW][C]60[/C][C]0.006286[/C][C]0.0689[/C][C]0.472609[/C][/ROW]
[/TABLE]
Source: https://freestatistics.org/blog/index.php?pk=33690&T=2

Globally Unique Identifier (entire table): ba.freestatistics.org/blog/index.php?pk=33690&T=2

As an alternative you can also use a QR Code:  

The GUIDs for individual cells are displayed in the table below:

Partial Autocorrelation Function
Time lag kPACF(k)T-STATP-value
1-0.279471-3.06150.001359
2-0.47118-5.16150
3-0.174307-1.90940.029297
4-0.288328-3.15850.001003
5-0.346417-3.79480.000117
60.1189811.30340.097472
7-0.252958-2.7710.003239
80.306953.36250.000519
90.2874793.14920.001033
10-0.301997-3.30820.00062
11-0.508725-5.57280
120.2665332.91970.002093
130.1606981.76040.040448
140.0851510.93280.176402
15-0.164457-1.80150.037065
160.0809570.88680.18847
170.0099110.10860.456862
18-0.005848-0.06410.474514
19-0.01313-0.14380.442938
200.009290.10180.459555
21-0.102409-1.12180.132086
22-0.075105-0.82270.206144
230.0264290.28950.386345
240.0497860.54540.293254
250.0206990.22670.410503
26-0.030389-0.33290.369899
27-0.141288-1.54770.06216
280.1106571.21220.113911
29-0.099164-1.08630.139764
30-0.082826-0.90730.18303
31-0.007811-0.08560.465979
32-0.060656-0.66450.253838
33-0.158292-1.7340.042743
340.0774520.84840.198939
350.0149160.16340.435242
36-0.071161-0.77950.218601
370.0740610.81130.209401
38-0.001427-0.01560.493777
390.03360.36810.356735
400.0467310.51190.304828
41-0.007125-0.07810.468958
42-0.016084-0.17620.43022
430.0338680.3710.355643
44-0.050418-0.55230.290886
450.0175160.19190.424081
460.0360460.39490.346822
470.0756380.82860.204495
480.0152540.16710.433787
49-0.010287-0.11270.455234
500.009270.10150.459644
510.1307471.43230.077335
520.0281870.30880.379014
53-0.019158-0.20990.417066
540.0196320.21510.415044
55-0.0435-0.47650.317284
56-0.089944-0.98530.163232
57-0.001889-0.02070.491762
58-0.003102-0.0340.486476
59-0.012551-0.13750.445435
600.0062860.06890.472609


Parameters (Session):
par1 = 60 ; par2 = 1 ; par3 = 1 ; par4 = 0 ; par5 = 12 ;
Parameters (R input):
par1 = 60 ; par2 = 1 ; par3 = 1 ; par4 = 0 ; par5 = 12 ;
R code (references can be found in the software module):
if (par1 == 'Default') {
par1 = 10*log10(length(x))
} else {
par1 <- as.numeric(par1)
}
par2 <- as.numeric(par2)
par3 <- as.numeric(par3)
par4 <- as.numeric(par4)
par5 <- as.numeric(par5)
if (par2 == 0) {
x <- log(x)
} else {
x <- (x ^ par2 - 1) / par2
}
if (par3 > 0) x <- diff(x,lag=1,difference=par3)
if (par4 > 0) x <- diff(x,lag=par5,difference=par4)
bitmap(file='pic1.png')
racf <- acf(x,par1,main='Autocorrelation',xlab='lags',ylab='ACF')
dev.off()
bitmap(file='pic2.png')
rpacf <- pacf(x,par1,main='Partial Autocorrelation',xlab='lags',ylab='PACF')
dev.off()
(myacf <- c(racf$acf))
(mypacf <- c(rpacf$acf))
lengthx <- length(x)
sqrtn <- sqrt(lengthx)
load(file='createtable')
a<-table.start()
a<-table.row.start(a)
a<-table.element(a,'Autocorrelation Function',4,TRUE)
a<-table.row.end(a)
a<-table.row.start(a)
a<-table.element(a,'Time lag k',header=TRUE)
a<-table.element(a,hyperlink('basics.htm','ACF(k)','click here for more information about the Autocorrelation Function'),header=TRUE)
a<-table.element(a,'T-STAT',header=TRUE)
a<-table.element(a,'P-value',header=TRUE)
a<-table.row.end(a)
for (i in 2:(par1+1)) {
a<-table.row.start(a)
a<-table.element(a,i-1,header=TRUE)
a<-table.element(a,round(myacf[i],6))
mytstat <- myacf[i]*sqrtn
a<-table.element(a,round(mytstat,4))
a<-table.element(a,round(1-pt(abs(mytstat),lengthx),6))
a<-table.row.end(a)
}
a<-table.end(a)
table.save(a,file='mytable.tab')
a<-table.start()
a<-table.row.start(a)
a<-table.element(a,'Partial Autocorrelation Function',4,TRUE)
a<-table.row.end(a)
a<-table.row.start(a)
a<-table.element(a,'Time lag k',header=TRUE)
a<-table.element(a,hyperlink('basics.htm','PACF(k)','click here for more information about the Partial Autocorrelation Function'),header=TRUE)
a<-table.element(a,'T-STAT',header=TRUE)
a<-table.element(a,'P-value',header=TRUE)
a<-table.row.end(a)
for (i in 1:par1) {
a<-table.row.start(a)
a<-table.element(a,i,header=TRUE)
a<-table.element(a,round(mypacf[i],6))
mytstat <- mypacf[i]*sqrtn
a<-table.element(a,round(mytstat,4))
a<-table.element(a,round(1-pt(abs(mytstat),lengthx),6))
a<-table.row.end(a)
}
a<-table.end(a)
table.save(a,file='mytable1.tab')