Free Statistics

of Irreproducible Research!

Author's title

Author*The author of this computation has been verified*
R Software Modulerwasp_autocorrelation.wasp
Title produced by software(Partial) Autocorrelation Function
Date of computationMon, 15 Dec 2008 07:07:44 -0700
Cite this page as followsStatistical Computations at FreeStatistics.org, Office for Research Development and Education, URL https://freestatistics.org/blog/index.php?v=date/2008/Dec/15/t1229350121pqbvkhnl9bian3s.htm/, Retrieved Thu, 16 May 2024 00:12:58 +0000
Statistical Computations at FreeStatistics.org, Office for Research Development and Education, URL https://freestatistics.org/blog/index.php?pk=33689, Retrieved Thu, 16 May 2024 00:12:58 +0000
QR Codes:

Original text written by user:
IsPrivate?No (this computation is public)
User-defined keywords
Estimated Impact153
Family? (F = Feedback message, R = changed R code, M = changed R Module, P = changed Parameters, D = changed Data)
-       [(Partial) Autocorrelation Function] [paper uitvoer] [2008-12-15 14:07:44] [56fd94b954e08a6655cb7790b21ee404] [Current]
Feedback Forum

Post a new message
Dataseries X:
6392.3
8686.4
9244.7
8182.7
7451.4
7988.8
8243.5
8843
9092.7
8246.7
9311.7
8341.2
7116.7
9635.7
9815.4
8611.3
8297.8
8715.1
8919.9
10085.8
9511.7
8991.3
10311.2
8895.4
7449.8
10084
9859.4
9100.1
8920.8
8502.7
8599.6
10394.4
9290.4
8742.2
10217.3
8639
8139.6
10779.1
10427.7
10349.1
10036.4
9492.1
10638.8
12054.5
10324.7
11817.3
11008.9
9996.6
9419.5
11958.8
12594.6
11890.6
10871.7
11835.7
11542.2
13093.7
11180.2
12035.7
12112
10875.2
9897.3
11672.1
12385.7
11405.6
9830.9
11025.1
10853.8
12252.6
11839.4
11669.1
11601.4
11178.4
9516.4
12102.8
12989
11610.2
10205.5
11356.2
11307.1
12648.6
11947.2
11714.1
12192.5
11268.8
9097.4
12639.8
13040.1
11687.3
11191.7
11391.9
11793.1
13933.2
12778.1
11810.3
13698.4
11956.6
10723.8
13938.9
13979.8
13807.4
12973.9
12509.8
12934.1
14908.3
13772.1
13012.6
14049.9
11816.5
11593.2
14466.2
13615.9
14733.9
13880.7
13527.5
13584
16170.2
13260.6
14741.9
15486.5
13154.5
12621.2


Summary of computational transaction
Raw Inputview raw input (R code)
Raw Outputview raw output of R engine
Computing time1 seconds
R Server'Gwilym Jenkins' @ 72.249.127.135

\begin{tabular}{lllllllll}
\hline
Summary of computational transaction \tabularnewline
Raw Input & view raw input (R code)  \tabularnewline
Raw Output & view raw output of R engine  \tabularnewline
Computing time & 1 seconds \tabularnewline
R Server & 'Gwilym Jenkins' @ 72.249.127.135 \tabularnewline
\hline
\end{tabular}
%Source: https://freestatistics.org/blog/index.php?pk=33689&T=0

[TABLE]
[ROW][C]Summary of computational transaction[/C][/ROW]
[ROW][C]Raw Input[/C][C]view raw input (R code) [/C][/ROW]
[ROW][C]Raw Output[/C][C]view raw output of R engine [/C][/ROW]
[ROW][C]Computing time[/C][C]1 seconds[/C][/ROW]
[ROW][C]R Server[/C][C]'Gwilym Jenkins' @ 72.249.127.135[/C][/ROW]
[/TABLE]
Source: https://freestatistics.org/blog/index.php?pk=33689&T=0

Globally Unique Identifier (entire table): ba.freestatistics.org/blog/index.php?pk=33689&T=0

As an alternative you can also use a QR Code:  

The GUIDs for individual cells are displayed in the table below:

Summary of computational transaction
Raw Inputview raw input (R code)
Raw Outputview raw output of R engine
Computing time1 seconds
R Server'Gwilym Jenkins' @ 72.249.127.135


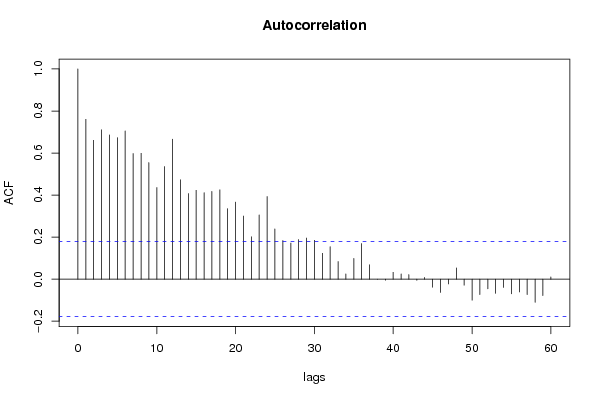
Autocorrelation Function
Time lag kACF(k)T-STATP-value
10.7605568.36610
20.6608237.26910
30.7106347.8170
40.6862487.54870
50.6732717.4060
60.7049897.75490
70.5973256.57060
80.5985416.5840
90.554486.09930
100.4360814.79692e-06
110.5356545.89220
120.6660997.32710
130.4724365.19680
140.4070994.47819e-06
150.4229614.65264e-06
160.4113134.52447e-06
170.4174714.59225e-06
180.4248784.67374e-06
190.3353133.68840.00017
200.3665724.03234.9e-05
210.3003453.30380.000627
220.2016652.21830.014199
230.3054093.35950.000522
240.3930194.32321.6e-05
250.2390122.62910.004835
260.1836682.02040.022777
270.1716071.88770.030732
280.1888042.07680.019966
290.1953882.14930.016802
300.1847362.03210.022167
310.1232791.35610.088802
320.1548821.70370.045502
330.0840430.92450.178541
340.0250180.27520.391818
350.098891.08780.139426
360.1694391.86380.032384
370.0683290.75160.22687
380.0002870.00320.498743
39-0.004559-0.05010.480044
400.0324760.35720.360771
410.0250950.2760.391493
420.021750.23930.405658
43-0.005557-0.06110.47568
440.008580.09440.462481
45-0.038083-0.41890.338012
46-0.062774-0.69050.245597
47-0.022587-0.24850.402101
480.0536790.59050.277989
49-0.028677-0.31540.376484
50-0.099641-1.09610.137616
51-0.07291-0.8020.212059
52-0.045908-0.5050.307245
53-0.06735-0.74080.230111
54-0.039212-0.43130.333496
55-0.069689-0.76660.222413
56-0.060563-0.66620.253279
57-0.073377-0.80710.210582
58-0.110131-1.21140.114044
59-0.077732-0.85510.197106
600.0104850.11530.454185

\begin{tabular}{lllllllll}
\hline
Autocorrelation Function \tabularnewline
Time lag k & ACF(k) & T-STAT & P-value \tabularnewline
1 & 0.760556 & 8.3661 & 0 \tabularnewline
2 & 0.660823 & 7.2691 & 0 \tabularnewline
3 & 0.710634 & 7.817 & 0 \tabularnewline
4 & 0.686248 & 7.5487 & 0 \tabularnewline
5 & 0.673271 & 7.406 & 0 \tabularnewline
6 & 0.704989 & 7.7549 & 0 \tabularnewline
7 & 0.597325 & 6.5706 & 0 \tabularnewline
8 & 0.598541 & 6.584 & 0 \tabularnewline
9 & 0.55448 & 6.0993 & 0 \tabularnewline
10 & 0.436081 & 4.7969 & 2e-06 \tabularnewline
11 & 0.535654 & 5.8922 & 0 \tabularnewline
12 & 0.666099 & 7.3271 & 0 \tabularnewline
13 & 0.472436 & 5.1968 & 0 \tabularnewline
14 & 0.407099 & 4.4781 & 9e-06 \tabularnewline
15 & 0.422961 & 4.6526 & 4e-06 \tabularnewline
16 & 0.411313 & 4.5244 & 7e-06 \tabularnewline
17 & 0.417471 & 4.5922 & 5e-06 \tabularnewline
18 & 0.424878 & 4.6737 & 4e-06 \tabularnewline
19 & 0.335313 & 3.6884 & 0.00017 \tabularnewline
20 & 0.366572 & 4.0323 & 4.9e-05 \tabularnewline
21 & 0.300345 & 3.3038 & 0.000627 \tabularnewline
22 & 0.201665 & 2.2183 & 0.014199 \tabularnewline
23 & 0.305409 & 3.3595 & 0.000522 \tabularnewline
24 & 0.393019 & 4.3232 & 1.6e-05 \tabularnewline
25 & 0.239012 & 2.6291 & 0.004835 \tabularnewline
26 & 0.183668 & 2.0204 & 0.022777 \tabularnewline
27 & 0.171607 & 1.8877 & 0.030732 \tabularnewline
28 & 0.188804 & 2.0768 & 0.019966 \tabularnewline
29 & 0.195388 & 2.1493 & 0.016802 \tabularnewline
30 & 0.184736 & 2.0321 & 0.022167 \tabularnewline
31 & 0.123279 & 1.3561 & 0.088802 \tabularnewline
32 & 0.154882 & 1.7037 & 0.045502 \tabularnewline
33 & 0.084043 & 0.9245 & 0.178541 \tabularnewline
34 & 0.025018 & 0.2752 & 0.391818 \tabularnewline
35 & 0.09889 & 1.0878 & 0.139426 \tabularnewline
36 & 0.169439 & 1.8638 & 0.032384 \tabularnewline
37 & 0.068329 & 0.7516 & 0.22687 \tabularnewline
38 & 0.000287 & 0.0032 & 0.498743 \tabularnewline
39 & -0.004559 & -0.0501 & 0.480044 \tabularnewline
40 & 0.032476 & 0.3572 & 0.360771 \tabularnewline
41 & 0.025095 & 0.276 & 0.391493 \tabularnewline
42 & 0.02175 & 0.2393 & 0.405658 \tabularnewline
43 & -0.005557 & -0.0611 & 0.47568 \tabularnewline
44 & 0.00858 & 0.0944 & 0.462481 \tabularnewline
45 & -0.038083 & -0.4189 & 0.338012 \tabularnewline
46 & -0.062774 & -0.6905 & 0.245597 \tabularnewline
47 & -0.022587 & -0.2485 & 0.402101 \tabularnewline
48 & 0.053679 & 0.5905 & 0.277989 \tabularnewline
49 & -0.028677 & -0.3154 & 0.376484 \tabularnewline
50 & -0.099641 & -1.0961 & 0.137616 \tabularnewline
51 & -0.07291 & -0.802 & 0.212059 \tabularnewline
52 & -0.045908 & -0.505 & 0.307245 \tabularnewline
53 & -0.06735 & -0.7408 & 0.230111 \tabularnewline
54 & -0.039212 & -0.4313 & 0.333496 \tabularnewline
55 & -0.069689 & -0.7666 & 0.222413 \tabularnewline
56 & -0.060563 & -0.6662 & 0.253279 \tabularnewline
57 & -0.073377 & -0.8071 & 0.210582 \tabularnewline
58 & -0.110131 & -1.2114 & 0.114044 \tabularnewline
59 & -0.077732 & -0.8551 & 0.197106 \tabularnewline
60 & 0.010485 & 0.1153 & 0.454185 \tabularnewline
\hline
\end{tabular}
%Source: https://freestatistics.org/blog/index.php?pk=33689&T=1

[TABLE]
[ROW][C]Autocorrelation Function[/C][/ROW]
[ROW][C]Time lag k[/C][C]ACF(k)[/C][C]T-STAT[/C][C]P-value[/C][/ROW]
[ROW][C]1[/C][C]0.760556[/C][C]8.3661[/C][C]0[/C][/ROW]
[ROW][C]2[/C][C]0.660823[/C][C]7.2691[/C][C]0[/C][/ROW]
[ROW][C]3[/C][C]0.710634[/C][C]7.817[/C][C]0[/C][/ROW]
[ROW][C]4[/C][C]0.686248[/C][C]7.5487[/C][C]0[/C][/ROW]
[ROW][C]5[/C][C]0.673271[/C][C]7.406[/C][C]0[/C][/ROW]
[ROW][C]6[/C][C]0.704989[/C][C]7.7549[/C][C]0[/C][/ROW]
[ROW][C]7[/C][C]0.597325[/C][C]6.5706[/C][C]0[/C][/ROW]
[ROW][C]8[/C][C]0.598541[/C][C]6.584[/C][C]0[/C][/ROW]
[ROW][C]9[/C][C]0.55448[/C][C]6.0993[/C][C]0[/C][/ROW]
[ROW][C]10[/C][C]0.436081[/C][C]4.7969[/C][C]2e-06[/C][/ROW]
[ROW][C]11[/C][C]0.535654[/C][C]5.8922[/C][C]0[/C][/ROW]
[ROW][C]12[/C][C]0.666099[/C][C]7.3271[/C][C]0[/C][/ROW]
[ROW][C]13[/C][C]0.472436[/C][C]5.1968[/C][C]0[/C][/ROW]
[ROW][C]14[/C][C]0.407099[/C][C]4.4781[/C][C]9e-06[/C][/ROW]
[ROW][C]15[/C][C]0.422961[/C][C]4.6526[/C][C]4e-06[/C][/ROW]
[ROW][C]16[/C][C]0.411313[/C][C]4.5244[/C][C]7e-06[/C][/ROW]
[ROW][C]17[/C][C]0.417471[/C][C]4.5922[/C][C]5e-06[/C][/ROW]
[ROW][C]18[/C][C]0.424878[/C][C]4.6737[/C][C]4e-06[/C][/ROW]
[ROW][C]19[/C][C]0.335313[/C][C]3.6884[/C][C]0.00017[/C][/ROW]
[ROW][C]20[/C][C]0.366572[/C][C]4.0323[/C][C]4.9e-05[/C][/ROW]
[ROW][C]21[/C][C]0.300345[/C][C]3.3038[/C][C]0.000627[/C][/ROW]
[ROW][C]22[/C][C]0.201665[/C][C]2.2183[/C][C]0.014199[/C][/ROW]
[ROW][C]23[/C][C]0.305409[/C][C]3.3595[/C][C]0.000522[/C][/ROW]
[ROW][C]24[/C][C]0.393019[/C][C]4.3232[/C][C]1.6e-05[/C][/ROW]
[ROW][C]25[/C][C]0.239012[/C][C]2.6291[/C][C]0.004835[/C][/ROW]
[ROW][C]26[/C][C]0.183668[/C][C]2.0204[/C][C]0.022777[/C][/ROW]
[ROW][C]27[/C][C]0.171607[/C][C]1.8877[/C][C]0.030732[/C][/ROW]
[ROW][C]28[/C][C]0.188804[/C][C]2.0768[/C][C]0.019966[/C][/ROW]
[ROW][C]29[/C][C]0.195388[/C][C]2.1493[/C][C]0.016802[/C][/ROW]
[ROW][C]30[/C][C]0.184736[/C][C]2.0321[/C][C]0.022167[/C][/ROW]
[ROW][C]31[/C][C]0.123279[/C][C]1.3561[/C][C]0.088802[/C][/ROW]
[ROW][C]32[/C][C]0.154882[/C][C]1.7037[/C][C]0.045502[/C][/ROW]
[ROW][C]33[/C][C]0.084043[/C][C]0.9245[/C][C]0.178541[/C][/ROW]
[ROW][C]34[/C][C]0.025018[/C][C]0.2752[/C][C]0.391818[/C][/ROW]
[ROW][C]35[/C][C]0.09889[/C][C]1.0878[/C][C]0.139426[/C][/ROW]
[ROW][C]36[/C][C]0.169439[/C][C]1.8638[/C][C]0.032384[/C][/ROW]
[ROW][C]37[/C][C]0.068329[/C][C]0.7516[/C][C]0.22687[/C][/ROW]
[ROW][C]38[/C][C]0.000287[/C][C]0.0032[/C][C]0.498743[/C][/ROW]
[ROW][C]39[/C][C]-0.004559[/C][C]-0.0501[/C][C]0.480044[/C][/ROW]
[ROW][C]40[/C][C]0.032476[/C][C]0.3572[/C][C]0.360771[/C][/ROW]
[ROW][C]41[/C][C]0.025095[/C][C]0.276[/C][C]0.391493[/C][/ROW]
[ROW][C]42[/C][C]0.02175[/C][C]0.2393[/C][C]0.405658[/C][/ROW]
[ROW][C]43[/C][C]-0.005557[/C][C]-0.0611[/C][C]0.47568[/C][/ROW]
[ROW][C]44[/C][C]0.00858[/C][C]0.0944[/C][C]0.462481[/C][/ROW]
[ROW][C]45[/C][C]-0.038083[/C][C]-0.4189[/C][C]0.338012[/C][/ROW]
[ROW][C]46[/C][C]-0.062774[/C][C]-0.6905[/C][C]0.245597[/C][/ROW]
[ROW][C]47[/C][C]-0.022587[/C][C]-0.2485[/C][C]0.402101[/C][/ROW]
[ROW][C]48[/C][C]0.053679[/C][C]0.5905[/C][C]0.277989[/C][/ROW]
[ROW][C]49[/C][C]-0.028677[/C][C]-0.3154[/C][C]0.376484[/C][/ROW]
[ROW][C]50[/C][C]-0.099641[/C][C]-1.0961[/C][C]0.137616[/C][/ROW]
[ROW][C]51[/C][C]-0.07291[/C][C]-0.802[/C][C]0.212059[/C][/ROW]
[ROW][C]52[/C][C]-0.045908[/C][C]-0.505[/C][C]0.307245[/C][/ROW]
[ROW][C]53[/C][C]-0.06735[/C][C]-0.7408[/C][C]0.230111[/C][/ROW]
[ROW][C]54[/C][C]-0.039212[/C][C]-0.4313[/C][C]0.333496[/C][/ROW]
[ROW][C]55[/C][C]-0.069689[/C][C]-0.7666[/C][C]0.222413[/C][/ROW]
[ROW][C]56[/C][C]-0.060563[/C][C]-0.6662[/C][C]0.253279[/C][/ROW]
[ROW][C]57[/C][C]-0.073377[/C][C]-0.8071[/C][C]0.210582[/C][/ROW]
[ROW][C]58[/C][C]-0.110131[/C][C]-1.2114[/C][C]0.114044[/C][/ROW]
[ROW][C]59[/C][C]-0.077732[/C][C]-0.8551[/C][C]0.197106[/C][/ROW]
[ROW][C]60[/C][C]0.010485[/C][C]0.1153[/C][C]0.454185[/C][/ROW]
[/TABLE]
Source: https://freestatistics.org/blog/index.php?pk=33689&T=1

Globally Unique Identifier (entire table): ba.freestatistics.org/blog/index.php?pk=33689&T=1

As an alternative you can also use a QR Code:  

The GUIDs for individual cells are displayed in the table below:

Autocorrelation Function
Time lag kACF(k)T-STATP-value
10.7605568.36610
20.6608237.26910
30.7106347.8170
40.6862487.54870
50.6732717.4060
60.7049897.75490
70.5973256.57060
80.5985416.5840
90.554486.09930
100.4360814.79692e-06
110.5356545.89220
120.6660997.32710
130.4724365.19680
140.4070994.47819e-06
150.4229614.65264e-06
160.4113134.52447e-06
170.4174714.59225e-06
180.4248784.67374e-06
190.3353133.68840.00017
200.3665724.03234.9e-05
210.3003453.30380.000627
220.2016652.21830.014199
230.3054093.35950.000522
240.3930194.32321.6e-05
250.2390122.62910.004835
260.1836682.02040.022777
270.1716071.88770.030732
280.1888042.07680.019966
290.1953882.14930.016802
300.1847362.03210.022167
310.1232791.35610.088802
320.1548821.70370.045502
330.0840430.92450.178541
340.0250180.27520.391818
350.098891.08780.139426
360.1694391.86380.032384
370.0683290.75160.22687
380.0002870.00320.498743
39-0.004559-0.05010.480044
400.0324760.35720.360771
410.0250950.2760.391493
420.021750.23930.405658
43-0.005557-0.06110.47568
440.008580.09440.462481
45-0.038083-0.41890.338012
46-0.062774-0.69050.245597
47-0.022587-0.24850.402101
480.0536790.59050.277989
49-0.028677-0.31540.376484
50-0.099641-1.09610.137616
51-0.07291-0.8020.212059
52-0.045908-0.5050.307245
53-0.06735-0.74080.230111
54-0.039212-0.43130.333496
55-0.069689-0.76660.222413
56-0.060563-0.66620.253279
57-0.073377-0.80710.210582
58-0.110131-1.21140.114044
59-0.077732-0.85510.197106
600.0104850.11530.454185


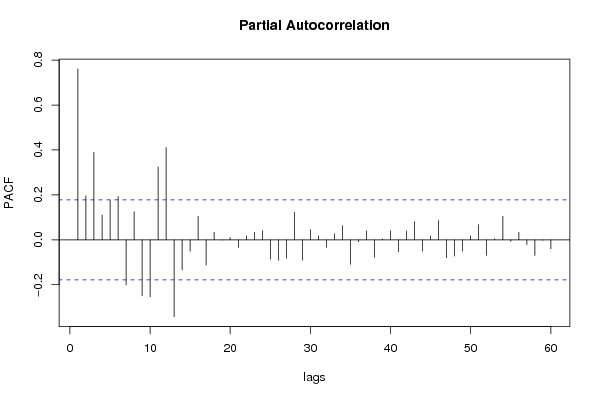
Partial Autocorrelation Function
Time lag kPACF(k)T-STATP-value
10.7605568.36610
20.1954132.14950.016791
30.3887744.27651.9e-05
40.1097411.20720.114863
50.1768111.94490.027052
60.1922782.11510.018238
7-0.200955-2.21050.014475
80.1247031.37170.086343
9-0.249721-2.74690.003468
10-0.253903-2.79290.003037
110.3236353.560.000266
120.4102914.51327e-06
13-0.342336-3.76570.000129
14-0.133999-1.4740.071541
15-0.05122-0.56340.287097
160.1047221.15190.125809
17-0.112378-1.23620.109396
180.0333780.36720.357071
19-0.001768-0.01950.492257
200.0099750.10970.456403
21-0.034073-0.37480.354232
220.0178620.19650.422282
230.0331990.36520.357802
240.0411690.45290.32573
25-0.086271-0.9490.17226
26-0.091528-1.00680.158019
27-0.081794-0.89970.185024
280.1228621.35150.089531
29-0.091147-1.00260.159022
300.0447390.49210.311761
310.0175740.19330.423519
32-0.033051-0.36360.358409
330.0263070.28940.386395
340.0630060.69310.244799
35-0.109582-1.20540.1152
36-0.008588-0.09450.462447
370.0399940.43990.330385
38-0.077976-0.85770.196367
390.0039620.04360.482654
400.040410.44450.328734
41-0.053848-0.59230.277369
420.0385370.42390.336195
430.0809980.8910.187355
44-0.050587-0.55650.289465
450.0171460.18860.425358
460.0856190.94180.174082
47-0.080183-0.8820.189759
48-0.072464-0.79710.213477
49-0.050806-0.55890.288642
500.0173860.19120.424326
510.0675790.74340.22935
52-0.069997-0.770.22141
530.004920.05410.478464
540.1046491.15110.125972
55-0.006882-0.07570.469889
560.0329460.36240.35884
57-0.021552-0.23710.4065
58-0.069751-0.76730.222209
59-0.002473-0.02720.489173
60-0.039952-0.43950.330552

\begin{tabular}{lllllllll}
\hline
Partial Autocorrelation Function \tabularnewline
Time lag k & PACF(k) & T-STAT & P-value \tabularnewline
1 & 0.760556 & 8.3661 & 0 \tabularnewline
2 & 0.195413 & 2.1495 & 0.016791 \tabularnewline
3 & 0.388774 & 4.2765 & 1.9e-05 \tabularnewline
4 & 0.109741 & 1.2072 & 0.114863 \tabularnewline
5 & 0.176811 & 1.9449 & 0.027052 \tabularnewline
6 & 0.192278 & 2.1151 & 0.018238 \tabularnewline
7 & -0.200955 & -2.2105 & 0.014475 \tabularnewline
8 & 0.124703 & 1.3717 & 0.086343 \tabularnewline
9 & -0.249721 & -2.7469 & 0.003468 \tabularnewline
10 & -0.253903 & -2.7929 & 0.003037 \tabularnewline
11 & 0.323635 & 3.56 & 0.000266 \tabularnewline
12 & 0.410291 & 4.5132 & 7e-06 \tabularnewline
13 & -0.342336 & -3.7657 & 0.000129 \tabularnewline
14 & -0.133999 & -1.474 & 0.071541 \tabularnewline
15 & -0.05122 & -0.5634 & 0.287097 \tabularnewline
16 & 0.104722 & 1.1519 & 0.125809 \tabularnewline
17 & -0.112378 & -1.2362 & 0.109396 \tabularnewline
18 & 0.033378 & 0.3672 & 0.357071 \tabularnewline
19 & -0.001768 & -0.0195 & 0.492257 \tabularnewline
20 & 0.009975 & 0.1097 & 0.456403 \tabularnewline
21 & -0.034073 & -0.3748 & 0.354232 \tabularnewline
22 & 0.017862 & 0.1965 & 0.422282 \tabularnewline
23 & 0.033199 & 0.3652 & 0.357802 \tabularnewline
24 & 0.041169 & 0.4529 & 0.32573 \tabularnewline
25 & -0.086271 & -0.949 & 0.17226 \tabularnewline
26 & -0.091528 & -1.0068 & 0.158019 \tabularnewline
27 & -0.081794 & -0.8997 & 0.185024 \tabularnewline
28 & 0.122862 & 1.3515 & 0.089531 \tabularnewline
29 & -0.091147 & -1.0026 & 0.159022 \tabularnewline
30 & 0.044739 & 0.4921 & 0.311761 \tabularnewline
31 & 0.017574 & 0.1933 & 0.423519 \tabularnewline
32 & -0.033051 & -0.3636 & 0.358409 \tabularnewline
33 & 0.026307 & 0.2894 & 0.386395 \tabularnewline
34 & 0.063006 & 0.6931 & 0.244799 \tabularnewline
35 & -0.109582 & -1.2054 & 0.1152 \tabularnewline
36 & -0.008588 & -0.0945 & 0.462447 \tabularnewline
37 & 0.039994 & 0.4399 & 0.330385 \tabularnewline
38 & -0.077976 & -0.8577 & 0.196367 \tabularnewline
39 & 0.003962 & 0.0436 & 0.482654 \tabularnewline
40 & 0.04041 & 0.4445 & 0.328734 \tabularnewline
41 & -0.053848 & -0.5923 & 0.277369 \tabularnewline
42 & 0.038537 & 0.4239 & 0.336195 \tabularnewline
43 & 0.080998 & 0.891 & 0.187355 \tabularnewline
44 & -0.050587 & -0.5565 & 0.289465 \tabularnewline
45 & 0.017146 & 0.1886 & 0.425358 \tabularnewline
46 & 0.085619 & 0.9418 & 0.174082 \tabularnewline
47 & -0.080183 & -0.882 & 0.189759 \tabularnewline
48 & -0.072464 & -0.7971 & 0.213477 \tabularnewline
49 & -0.050806 & -0.5589 & 0.288642 \tabularnewline
50 & 0.017386 & 0.1912 & 0.424326 \tabularnewline
51 & 0.067579 & 0.7434 & 0.22935 \tabularnewline
52 & -0.069997 & -0.77 & 0.22141 \tabularnewline
53 & 0.00492 & 0.0541 & 0.478464 \tabularnewline
54 & 0.104649 & 1.1511 & 0.125972 \tabularnewline
55 & -0.006882 & -0.0757 & 0.469889 \tabularnewline
56 & 0.032946 & 0.3624 & 0.35884 \tabularnewline
57 & -0.021552 & -0.2371 & 0.4065 \tabularnewline
58 & -0.069751 & -0.7673 & 0.222209 \tabularnewline
59 & -0.002473 & -0.0272 & 0.489173 \tabularnewline
60 & -0.039952 & -0.4395 & 0.330552 \tabularnewline
\hline
\end{tabular}
%Source: https://freestatistics.org/blog/index.php?pk=33689&T=2

[TABLE]
[ROW][C]Partial Autocorrelation Function[/C][/ROW]
[ROW][C]Time lag k[/C][C]PACF(k)[/C][C]T-STAT[/C][C]P-value[/C][/ROW]
[ROW][C]1[/C][C]0.760556[/C][C]8.3661[/C][C]0[/C][/ROW]
[ROW][C]2[/C][C]0.195413[/C][C]2.1495[/C][C]0.016791[/C][/ROW]
[ROW][C]3[/C][C]0.388774[/C][C]4.2765[/C][C]1.9e-05[/C][/ROW]
[ROW][C]4[/C][C]0.109741[/C][C]1.2072[/C][C]0.114863[/C][/ROW]
[ROW][C]5[/C][C]0.176811[/C][C]1.9449[/C][C]0.027052[/C][/ROW]
[ROW][C]6[/C][C]0.192278[/C][C]2.1151[/C][C]0.018238[/C][/ROW]
[ROW][C]7[/C][C]-0.200955[/C][C]-2.2105[/C][C]0.014475[/C][/ROW]
[ROW][C]8[/C][C]0.124703[/C][C]1.3717[/C][C]0.086343[/C][/ROW]
[ROW][C]9[/C][C]-0.249721[/C][C]-2.7469[/C][C]0.003468[/C][/ROW]
[ROW][C]10[/C][C]-0.253903[/C][C]-2.7929[/C][C]0.003037[/C][/ROW]
[ROW][C]11[/C][C]0.323635[/C][C]3.56[/C][C]0.000266[/C][/ROW]
[ROW][C]12[/C][C]0.410291[/C][C]4.5132[/C][C]7e-06[/C][/ROW]
[ROW][C]13[/C][C]-0.342336[/C][C]-3.7657[/C][C]0.000129[/C][/ROW]
[ROW][C]14[/C][C]-0.133999[/C][C]-1.474[/C][C]0.071541[/C][/ROW]
[ROW][C]15[/C][C]-0.05122[/C][C]-0.5634[/C][C]0.287097[/C][/ROW]
[ROW][C]16[/C][C]0.104722[/C][C]1.1519[/C][C]0.125809[/C][/ROW]
[ROW][C]17[/C][C]-0.112378[/C][C]-1.2362[/C][C]0.109396[/C][/ROW]
[ROW][C]18[/C][C]0.033378[/C][C]0.3672[/C][C]0.357071[/C][/ROW]
[ROW][C]19[/C][C]-0.001768[/C][C]-0.0195[/C][C]0.492257[/C][/ROW]
[ROW][C]20[/C][C]0.009975[/C][C]0.1097[/C][C]0.456403[/C][/ROW]
[ROW][C]21[/C][C]-0.034073[/C][C]-0.3748[/C][C]0.354232[/C][/ROW]
[ROW][C]22[/C][C]0.017862[/C][C]0.1965[/C][C]0.422282[/C][/ROW]
[ROW][C]23[/C][C]0.033199[/C][C]0.3652[/C][C]0.357802[/C][/ROW]
[ROW][C]24[/C][C]0.041169[/C][C]0.4529[/C][C]0.32573[/C][/ROW]
[ROW][C]25[/C][C]-0.086271[/C][C]-0.949[/C][C]0.17226[/C][/ROW]
[ROW][C]26[/C][C]-0.091528[/C][C]-1.0068[/C][C]0.158019[/C][/ROW]
[ROW][C]27[/C][C]-0.081794[/C][C]-0.8997[/C][C]0.185024[/C][/ROW]
[ROW][C]28[/C][C]0.122862[/C][C]1.3515[/C][C]0.089531[/C][/ROW]
[ROW][C]29[/C][C]-0.091147[/C][C]-1.0026[/C][C]0.159022[/C][/ROW]
[ROW][C]30[/C][C]0.044739[/C][C]0.4921[/C][C]0.311761[/C][/ROW]
[ROW][C]31[/C][C]0.017574[/C][C]0.1933[/C][C]0.423519[/C][/ROW]
[ROW][C]32[/C][C]-0.033051[/C][C]-0.3636[/C][C]0.358409[/C][/ROW]
[ROW][C]33[/C][C]0.026307[/C][C]0.2894[/C][C]0.386395[/C][/ROW]
[ROW][C]34[/C][C]0.063006[/C][C]0.6931[/C][C]0.244799[/C][/ROW]
[ROW][C]35[/C][C]-0.109582[/C][C]-1.2054[/C][C]0.1152[/C][/ROW]
[ROW][C]36[/C][C]-0.008588[/C][C]-0.0945[/C][C]0.462447[/C][/ROW]
[ROW][C]37[/C][C]0.039994[/C][C]0.4399[/C][C]0.330385[/C][/ROW]
[ROW][C]38[/C][C]-0.077976[/C][C]-0.8577[/C][C]0.196367[/C][/ROW]
[ROW][C]39[/C][C]0.003962[/C][C]0.0436[/C][C]0.482654[/C][/ROW]
[ROW][C]40[/C][C]0.04041[/C][C]0.4445[/C][C]0.328734[/C][/ROW]
[ROW][C]41[/C][C]-0.053848[/C][C]-0.5923[/C][C]0.277369[/C][/ROW]
[ROW][C]42[/C][C]0.038537[/C][C]0.4239[/C][C]0.336195[/C][/ROW]
[ROW][C]43[/C][C]0.080998[/C][C]0.891[/C][C]0.187355[/C][/ROW]
[ROW][C]44[/C][C]-0.050587[/C][C]-0.5565[/C][C]0.289465[/C][/ROW]
[ROW][C]45[/C][C]0.017146[/C][C]0.1886[/C][C]0.425358[/C][/ROW]
[ROW][C]46[/C][C]0.085619[/C][C]0.9418[/C][C]0.174082[/C][/ROW]
[ROW][C]47[/C][C]-0.080183[/C][C]-0.882[/C][C]0.189759[/C][/ROW]
[ROW][C]48[/C][C]-0.072464[/C][C]-0.7971[/C][C]0.213477[/C][/ROW]
[ROW][C]49[/C][C]-0.050806[/C][C]-0.5589[/C][C]0.288642[/C][/ROW]
[ROW][C]50[/C][C]0.017386[/C][C]0.1912[/C][C]0.424326[/C][/ROW]
[ROW][C]51[/C][C]0.067579[/C][C]0.7434[/C][C]0.22935[/C][/ROW]
[ROW][C]52[/C][C]-0.069997[/C][C]-0.77[/C][C]0.22141[/C][/ROW]
[ROW][C]53[/C][C]0.00492[/C][C]0.0541[/C][C]0.478464[/C][/ROW]
[ROW][C]54[/C][C]0.104649[/C][C]1.1511[/C][C]0.125972[/C][/ROW]
[ROW][C]55[/C][C]-0.006882[/C][C]-0.0757[/C][C]0.469889[/C][/ROW]
[ROW][C]56[/C][C]0.032946[/C][C]0.3624[/C][C]0.35884[/C][/ROW]
[ROW][C]57[/C][C]-0.021552[/C][C]-0.2371[/C][C]0.4065[/C][/ROW]
[ROW][C]58[/C][C]-0.069751[/C][C]-0.7673[/C][C]0.222209[/C][/ROW]
[ROW][C]59[/C][C]-0.002473[/C][C]-0.0272[/C][C]0.489173[/C][/ROW]
[ROW][C]60[/C][C]-0.039952[/C][C]-0.4395[/C][C]0.330552[/C][/ROW]
[/TABLE]
Source: https://freestatistics.org/blog/index.php?pk=33689&T=2

Globally Unique Identifier (entire table): ba.freestatistics.org/blog/index.php?pk=33689&T=2

As an alternative you can also use a QR Code:  

The GUIDs for individual cells are displayed in the table below:

Partial Autocorrelation Function
Time lag kPACF(k)T-STATP-value
10.7605568.36610
20.1954132.14950.016791
30.3887744.27651.9e-05
40.1097411.20720.114863
50.1768111.94490.027052
60.1922782.11510.018238
7-0.200955-2.21050.014475
80.1247031.37170.086343
9-0.249721-2.74690.003468
10-0.253903-2.79290.003037
110.3236353.560.000266
120.4102914.51327e-06
13-0.342336-3.76570.000129
14-0.133999-1.4740.071541
15-0.05122-0.56340.287097
160.1047221.15190.125809
17-0.112378-1.23620.109396
180.0333780.36720.357071
19-0.001768-0.01950.492257
200.0099750.10970.456403
21-0.034073-0.37480.354232
220.0178620.19650.422282
230.0331990.36520.357802
240.0411690.45290.32573
25-0.086271-0.9490.17226
26-0.091528-1.00680.158019
27-0.081794-0.89970.185024
280.1228621.35150.089531
29-0.091147-1.00260.159022
300.0447390.49210.311761
310.0175740.19330.423519
32-0.033051-0.36360.358409
330.0263070.28940.386395
340.0630060.69310.244799
35-0.109582-1.20540.1152
36-0.008588-0.09450.462447
370.0399940.43990.330385
38-0.077976-0.85770.196367
390.0039620.04360.482654
400.040410.44450.328734
41-0.053848-0.59230.277369
420.0385370.42390.336195
430.0809980.8910.187355
44-0.050587-0.55650.289465
450.0171460.18860.425358
460.0856190.94180.174082
47-0.080183-0.8820.189759
48-0.072464-0.79710.213477
49-0.050806-0.55890.288642
500.0173860.19120.424326
510.0675790.74340.22935
52-0.069997-0.770.22141
530.004920.05410.478464
540.1046491.15110.125972
55-0.006882-0.07570.469889
560.0329460.36240.35884
57-0.021552-0.23710.4065
58-0.069751-0.76730.222209
59-0.002473-0.02720.489173
60-0.039952-0.43950.330552


Parameters (Session):
par1 = 60 ; par2 = 1 ; par3 = 0 ; par4 = 0 ; par5 = 12 ;
Parameters (R input):
par1 = 60 ; par2 = 1 ; par3 = 0 ; par4 = 0 ; par5 = 12 ;
R code (references can be found in the software module):
if (par1 == 'Default') {
par1 = 10*log10(length(x))
} else {
par1 <- as.numeric(par1)
}
par2 <- as.numeric(par2)
par3 <- as.numeric(par3)
par4 <- as.numeric(par4)
par5 <- as.numeric(par5)
if (par2 == 0) {
x <- log(x)
} else {
x <- (x ^ par2 - 1) / par2
}
if (par3 > 0) x <- diff(x,lag=1,difference=par3)
if (par4 > 0) x <- diff(x,lag=par5,difference=par4)
bitmap(file='pic1.png')
racf <- acf(x,par1,main='Autocorrelation',xlab='lags',ylab='ACF')
dev.off()
bitmap(file='pic2.png')
rpacf <- pacf(x,par1,main='Partial Autocorrelation',xlab='lags',ylab='PACF')
dev.off()
(myacf <- c(racf$acf))
(mypacf <- c(rpacf$acf))
lengthx <- length(x)
sqrtn <- sqrt(lengthx)
load(file='createtable')
a<-table.start()
a<-table.row.start(a)
a<-table.element(a,'Autocorrelation Function',4,TRUE)
a<-table.row.end(a)
a<-table.row.start(a)
a<-table.element(a,'Time lag k',header=TRUE)
a<-table.element(a,hyperlink('basics.htm','ACF(k)','click here for more information about the Autocorrelation Function'),header=TRUE)
a<-table.element(a,'T-STAT',header=TRUE)
a<-table.element(a,'P-value',header=TRUE)
a<-table.row.end(a)
for (i in 2:(par1+1)) {
a<-table.row.start(a)
a<-table.element(a,i-1,header=TRUE)
a<-table.element(a,round(myacf[i],6))
mytstat <- myacf[i]*sqrtn
a<-table.element(a,round(mytstat,4))
a<-table.element(a,round(1-pt(abs(mytstat),lengthx),6))
a<-table.row.end(a)
}
a<-table.end(a)
table.save(a,file='mytable.tab')
a<-table.start()
a<-table.row.start(a)
a<-table.element(a,'Partial Autocorrelation Function',4,TRUE)
a<-table.row.end(a)
a<-table.row.start(a)
a<-table.element(a,'Time lag k',header=TRUE)
a<-table.element(a,hyperlink('basics.htm','PACF(k)','click here for more information about the Partial Autocorrelation Function'),header=TRUE)
a<-table.element(a,'T-STAT',header=TRUE)
a<-table.element(a,'P-value',header=TRUE)
a<-table.row.end(a)
for (i in 1:par1) {
a<-table.row.start(a)
a<-table.element(a,i,header=TRUE)
a<-table.element(a,round(mypacf[i],6))
mytstat <- mypacf[i]*sqrtn
a<-table.element(a,round(mytstat,4))
a<-table.element(a,round(1-pt(abs(mytstat),lengthx),6))
a<-table.row.end(a)
}
a<-table.end(a)
table.save(a,file='mytable1.tab')