Free Statistics

of Irreproducible Research!

Author's title

Author*The author of this computation has been verified*
R Software Modulerwasp_arimaforecasting.wasp
Title produced by softwareARIMA Forecasting
Date of computationMon, 15 Dec 2008 05:59:24 -0700
Cite this page as followsStatistical Computations at FreeStatistics.org, Office for Research Development and Education, URL https://freestatistics.org/blog/index.php?v=date/2008/Dec/15/t1229346020gnwumntvv8sgpcw.htm/, Retrieved Wed, 15 May 2024 09:13:48 +0000
Statistical Computations at FreeStatistics.org, Office for Research Development and Education, URL https://freestatistics.org/blog/index.php?pk=33684, Retrieved Wed, 15 May 2024 09:13:48 +0000
QR Codes:

Original text written by user:
IsPrivate?No (this computation is public)
User-defined keywords
Estimated Impact218
Family? (F = Feedback message, R = changed R code, M = changed R Module, P = changed Parameters, D = changed Data)
F       [ARIMA Forecasting] [ARIMA Forecasting] [2008-12-15 12:59:24] [8758b22b4a10c08c31202f233362e983] [Current]
F         [ARIMA Forecasting] [ARIMA] [2008-12-15 22:45:01] [76963dc1903f0f612b6153510a3818cf]
- RMPD      [Standard Deviation-Mean Plot] [feedback op blog] [2008-12-19 12:44:53] [b635de6fc42b001d22cbe6e730fec936]
-   PD      [ARIMA Forecasting] [feedback op blog] [2008-12-19 12:58:39] [b635de6fc42b001d22cbe6e730fec936]
Feedback Forum
2008-12-18 12:56:14 [Ken Van den Heuvel] [reply
Kijken we terug naar de eerste tabel, meer bepaald de 7de, 8ste en 9de kolom.

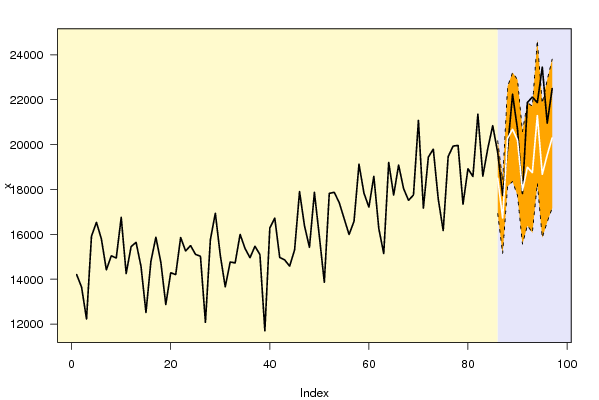
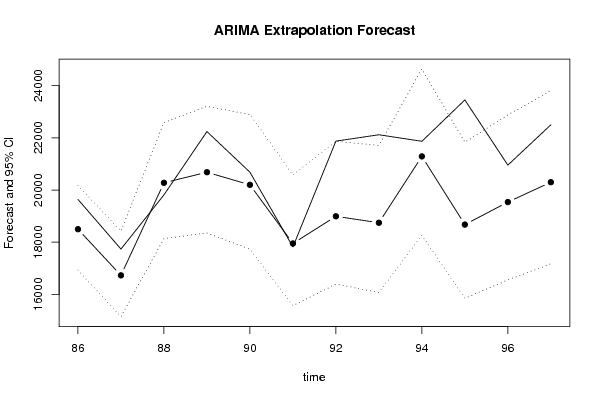
De 7de kolom geeft P(F[t]>Y[t-1]). Dit is de stijgingskans 1 periode vooruit. Bij observatie 97 bijvoorbeeld zien we een waarde van 35,69%. Er is dus 35,69% kans dat F(t)>Y(t-1). De kans op een daling is bijgevolg 100%-35,69% = 64,31%.

De 8ste kolom is P(F[t]>Y[t-s]). Dit is de stijgingskans tegenover dezelfde maand van het jaar voordien. Bij observatie 97 is er 37,99% kans op stijging tegenover dezelfde maand van het jaar voordien, want s = 12. Bijgevolg is er dus 62,01% kans op een daling t.o.v. vorig jaar.

De 9de kolom is P(F[t]>Y[85]). Dit is de kans op stijging, berekend tegenover de laatst gekende waarde. Bij observatie 97 is er dus 38,99% kans op stijging, berekend tegenover de laatst gekende waarde, 85.
2008-12-22 14:09:48 [Matthieu Blondeau] [reply
Ik denk dat ik de taak vrij correct heb opgelost behalve vraag 4 die ik niet heb opgelost. Ken legt het hier dan ook duidelijk uit hoe deze vraag moest worder geinterpreteerd.

Post a new message
Dataseries X:
14211
13646,8
12224,6
15916,4
16535,9
15796
14418,6
15044,5
14944,2
16754,8
14254
15454,9
15644,8
14568,3
12520,2
14803
15873,2
14755,3
12875,1
14291,1
14205,3
15859,4
15258,9
15498,6
15106,5
15023,6
12083
15761,3
16943
15070,3
13659,6
14768,9
14725,1
15998,1
15370,6
14956,9
15469,7
15101,8
11703,7
16283,6
16726,5
14968,9
14861
14583,3
15305,8
17903,9
16379,4
15420,3
17870,5
15912,8
13866,5
17823,2
17872
17420,4
16704,4
15991,2
16583,6
19123,5
17838,7
17209,4
18586,5
16258,1
15141,6
19202,1
17746,5
19090,1
18040,3
17515,5
17751,8
21072,4
17170
19439,5
19795,4
17574,9
16165,4
19464,6
19932,1
19961,2
17343,4
18924,2
18574,1
21350,6
18594,6
19823,1
20844,4
19640,2
17735,4
19813,6
22238,5
20682,2
17818,6
21872,1
22117
21865,9
23451,3
20953,7
22497,3


Summary of computational transaction
Raw Inputview raw input (R code)
Raw Outputview raw output of R engine
Computing time3 seconds
R Server'Sir Ronald Aylmer Fisher' @ 193.190.124.24

\begin{tabular}{lllllllll}
\hline
Summary of computational transaction \tabularnewline
Raw Input & view raw input (R code)  \tabularnewline
Raw Output & view raw output of R engine  \tabularnewline
Computing time & 3 seconds \tabularnewline
R Server & 'Sir Ronald Aylmer Fisher' @ 193.190.124.24 \tabularnewline
\hline
\end{tabular}
%Source: https://freestatistics.org/blog/index.php?pk=33684&T=0

[TABLE]
[ROW][C]Summary of computational transaction[/C][/ROW]
[ROW][C]Raw Input[/C][C]view raw input (R code) [/C][/ROW]
[ROW][C]Raw Output[/C][C]view raw output of R engine [/C][/ROW]
[ROW][C]Computing time[/C][C]3 seconds[/C][/ROW]
[ROW][C]R Server[/C][C]'Sir Ronald Aylmer Fisher' @ 193.190.124.24[/C][/ROW]
[/TABLE]
Source: https://freestatistics.org/blog/index.php?pk=33684&T=0

Globally Unique Identifier (entire table): ba.freestatistics.org/blog/index.php?pk=33684&T=0

As an alternative you can also use a QR Code:  

The GUIDs for individual cells are displayed in the table below:

Summary of computational transaction
Raw Inputview raw input (R code)
Raw Outputview raw output of R engine
Computing time3 seconds
R Server'Sir Ronald Aylmer Fisher' @ 193.190.124.24


Univariate ARIMA Extrapolation Forecast
timeY[t]F[t]95% LB95% UBp-value(H0: Y[t] = F[t])P(F[t]>Y[t-1])P(F[t]>Y[t-s])P(F[t]>Y[85])
7319795.4-------
7417574.9-------
7516165.4-------
7619464.6-------
7719932.1-------
7819961.2-------
7917343.4-------
8018924.2-------
8118574.1-------
8221350.6-------
8318594.6-------
8419823.1-------
8520844.4-------
8619640.218497.523216925.832120168.63230.09010.0030.86040.003
8717735.416729.304915146.820218424.04240.12234e-040.74290
8819813.620274.83818136.024822584.25360.34770.98440.75420.3144
8922238.520680.789618355.392323204.95140.11320.74960.71950.4495
9020682.220198.120917733.562522892.97810.36240.06890.56840.3192
9117818.617951.022515567.966420578.38660.46070.02080.67480.0154
9221872.118991.463716393.781621864.40670.02470.78820.51830.1031
932211718744.983116076.009821709.6570.01290.01930.5450.0826
9421865.921287.805618269.924638.46080.36760.31380.48530.6023
9523451.318674.393715852.519521830.37370.00150.02370.51980.0889
9620953.719537.043916553.95722877.46530.20290.01080.43340.2215
9722497.320297.863117171.566923802.31760.10930.35690.37990.3799

\begin{tabular}{lllllllll}
\hline
Univariate ARIMA Extrapolation Forecast \tabularnewline
time & Y[t] & F[t] & 95% LB & 95% UB & p-value(H0: Y[t] = F[t]) & P(F[t]>Y[t-1]) & P(F[t]>Y[t-s]) & P(F[t]>Y[85]) \tabularnewline
73 & 19795.4 & - & - & - & - & - & - & - \tabularnewline
74 & 17574.9 & - & - & - & - & - & - & - \tabularnewline
75 & 16165.4 & - & - & - & - & - & - & - \tabularnewline
76 & 19464.6 & - & - & - & - & - & - & - \tabularnewline
77 & 19932.1 & - & - & - & - & - & - & - \tabularnewline
78 & 19961.2 & - & - & - & - & - & - & - \tabularnewline
79 & 17343.4 & - & - & - & - & - & - & - \tabularnewline
80 & 18924.2 & - & - & - & - & - & - & - \tabularnewline
81 & 18574.1 & - & - & - & - & - & - & - \tabularnewline
82 & 21350.6 & - & - & - & - & - & - & - \tabularnewline
83 & 18594.6 & - & - & - & - & - & - & - \tabularnewline
84 & 19823.1 & - & - & - & - & - & - & - \tabularnewline
85 & 20844.4 & - & - & - & - & - & - & - \tabularnewline
86 & 19640.2 & 18497.5232 & 16925.8321 & 20168.6323 & 0.0901 & 0.003 & 0.8604 & 0.003 \tabularnewline
87 & 17735.4 & 16729.3049 & 15146.8202 & 18424.0424 & 0.1223 & 4e-04 & 0.7429 & 0 \tabularnewline
88 & 19813.6 & 20274.838 & 18136.0248 & 22584.2536 & 0.3477 & 0.9844 & 0.7542 & 0.3144 \tabularnewline
89 & 22238.5 & 20680.7896 & 18355.3923 & 23204.9514 & 0.1132 & 0.7496 & 0.7195 & 0.4495 \tabularnewline
90 & 20682.2 & 20198.1209 & 17733.5625 & 22892.9781 & 0.3624 & 0.0689 & 0.5684 & 0.3192 \tabularnewline
91 & 17818.6 & 17951.0225 & 15567.9664 & 20578.3866 & 0.4607 & 0.0208 & 0.6748 & 0.0154 \tabularnewline
92 & 21872.1 & 18991.4637 & 16393.7816 & 21864.4067 & 0.0247 & 0.7882 & 0.5183 & 0.1031 \tabularnewline
93 & 22117 & 18744.9831 & 16076.0098 & 21709.657 & 0.0129 & 0.0193 & 0.545 & 0.0826 \tabularnewline
94 & 21865.9 & 21287.8056 & 18269.9 & 24638.4608 & 0.3676 & 0.3138 & 0.4853 & 0.6023 \tabularnewline
95 & 23451.3 & 18674.3937 & 15852.5195 & 21830.3737 & 0.0015 & 0.0237 & 0.5198 & 0.0889 \tabularnewline
96 & 20953.7 & 19537.0439 & 16553.957 & 22877.4653 & 0.2029 & 0.0108 & 0.4334 & 0.2215 \tabularnewline
97 & 22497.3 & 20297.8631 & 17171.5669 & 23802.3176 & 0.1093 & 0.3569 & 0.3799 & 0.3799 \tabularnewline
\hline
\end{tabular}
%Source: https://freestatistics.org/blog/index.php?pk=33684&T=1

[TABLE]
[ROW][C]Univariate ARIMA Extrapolation Forecast[/C][/ROW]
[ROW][C]time[/C][C]Y[t][/C][C]F[t][/C][C]95% LB[/C][C]95% UB[/C][C]p-value(H0: Y[t] = F[t])[/C][C]P(F[t]>Y[t-1])[/C][C]P(F[t]>Y[t-s])[/C][C]P(F[t]>Y[85])[/C][/ROW]
[ROW][C]73[/C][C]19795.4[/C][C]-[/C][C]-[/C][C]-[/C][C]-[/C][C]-[/C][C]-[/C][C]-[/C][/ROW]
[ROW][C]74[/C][C]17574.9[/C][C]-[/C][C]-[/C][C]-[/C][C]-[/C][C]-[/C][C]-[/C][C]-[/C][/ROW]
[ROW][C]75[/C][C]16165.4[/C][C]-[/C][C]-[/C][C]-[/C][C]-[/C][C]-[/C][C]-[/C][C]-[/C][/ROW]
[ROW][C]76[/C][C]19464.6[/C][C]-[/C][C]-[/C][C]-[/C][C]-[/C][C]-[/C][C]-[/C][C]-[/C][/ROW]
[ROW][C]77[/C][C]19932.1[/C][C]-[/C][C]-[/C][C]-[/C][C]-[/C][C]-[/C][C]-[/C][C]-[/C][/ROW]
[ROW][C]78[/C][C]19961.2[/C][C]-[/C][C]-[/C][C]-[/C][C]-[/C][C]-[/C][C]-[/C][C]-[/C][/ROW]
[ROW][C]79[/C][C]17343.4[/C][C]-[/C][C]-[/C][C]-[/C][C]-[/C][C]-[/C][C]-[/C][C]-[/C][/ROW]
[ROW][C]80[/C][C]18924.2[/C][C]-[/C][C]-[/C][C]-[/C][C]-[/C][C]-[/C][C]-[/C][C]-[/C][/ROW]
[ROW][C]81[/C][C]18574.1[/C][C]-[/C][C]-[/C][C]-[/C][C]-[/C][C]-[/C][C]-[/C][C]-[/C][/ROW]
[ROW][C]82[/C][C]21350.6[/C][C]-[/C][C]-[/C][C]-[/C][C]-[/C][C]-[/C][C]-[/C][C]-[/C][/ROW]
[ROW][C]83[/C][C]18594.6[/C][C]-[/C][C]-[/C][C]-[/C][C]-[/C][C]-[/C][C]-[/C][C]-[/C][/ROW]
[ROW][C]84[/C][C]19823.1[/C][C]-[/C][C]-[/C][C]-[/C][C]-[/C][C]-[/C][C]-[/C][C]-[/C][/ROW]
[ROW][C]85[/C][C]20844.4[/C][C]-[/C][C]-[/C][C]-[/C][C]-[/C][C]-[/C][C]-[/C][C]-[/C][/ROW]
[ROW][C]86[/C][C]19640.2[/C][C]18497.5232[/C][C]16925.8321[/C][C]20168.6323[/C][C]0.0901[/C][C]0.003[/C][C]0.8604[/C][C]0.003[/C][/ROW]
[ROW][C]87[/C][C]17735.4[/C][C]16729.3049[/C][C]15146.8202[/C][C]18424.0424[/C][C]0.1223[/C][C]4e-04[/C][C]0.7429[/C][C]0[/C][/ROW]
[ROW][C]88[/C][C]19813.6[/C][C]20274.838[/C][C]18136.0248[/C][C]22584.2536[/C][C]0.3477[/C][C]0.9844[/C][C]0.7542[/C][C]0.3144[/C][/ROW]
[ROW][C]89[/C][C]22238.5[/C][C]20680.7896[/C][C]18355.3923[/C][C]23204.9514[/C][C]0.1132[/C][C]0.7496[/C][C]0.7195[/C][C]0.4495[/C][/ROW]
[ROW][C]90[/C][C]20682.2[/C][C]20198.1209[/C][C]17733.5625[/C][C]22892.9781[/C][C]0.3624[/C][C]0.0689[/C][C]0.5684[/C][C]0.3192[/C][/ROW]
[ROW][C]91[/C][C]17818.6[/C][C]17951.0225[/C][C]15567.9664[/C][C]20578.3866[/C][C]0.4607[/C][C]0.0208[/C][C]0.6748[/C][C]0.0154[/C][/ROW]
[ROW][C]92[/C][C]21872.1[/C][C]18991.4637[/C][C]16393.7816[/C][C]21864.4067[/C][C]0.0247[/C][C]0.7882[/C][C]0.5183[/C][C]0.1031[/C][/ROW]
[ROW][C]93[/C][C]22117[/C][C]18744.9831[/C][C]16076.0098[/C][C]21709.657[/C][C]0.0129[/C][C]0.0193[/C][C]0.545[/C][C]0.0826[/C][/ROW]
[ROW][C]94[/C][C]21865.9[/C][C]21287.8056[/C][C]18269.9[/C][C]24638.4608[/C][C]0.3676[/C][C]0.3138[/C][C]0.4853[/C][C]0.6023[/C][/ROW]
[ROW][C]95[/C][C]23451.3[/C][C]18674.3937[/C][C]15852.5195[/C][C]21830.3737[/C][C]0.0015[/C][C]0.0237[/C][C]0.5198[/C][C]0.0889[/C][/ROW]
[ROW][C]96[/C][C]20953.7[/C][C]19537.0439[/C][C]16553.957[/C][C]22877.4653[/C][C]0.2029[/C][C]0.0108[/C][C]0.4334[/C][C]0.2215[/C][/ROW]
[ROW][C]97[/C][C]22497.3[/C][C]20297.8631[/C][C]17171.5669[/C][C]23802.3176[/C][C]0.1093[/C][C]0.3569[/C][C]0.3799[/C][C]0.3799[/C][/ROW]
[/TABLE]
Source: https://freestatistics.org/blog/index.php?pk=33684&T=1

Globally Unique Identifier (entire table): ba.freestatistics.org/blog/index.php?pk=33684&T=1

As an alternative you can also use a QR Code:  

The GUIDs for individual cells are displayed in the table below:

Univariate ARIMA Extrapolation Forecast
timeY[t]F[t]95% LB95% UBp-value(H0: Y[t] = F[t])P(F[t]>Y[t-1])P(F[t]>Y[t-s])P(F[t]>Y[85])
7319795.4-------
7417574.9-------
7516165.4-------
7619464.6-------
7719932.1-------
7819961.2-------
7917343.4-------
8018924.2-------
8118574.1-------
8221350.6-------
8318594.6-------
8419823.1-------
8520844.4-------
8619640.218497.523216925.832120168.63230.09010.0030.86040.003
8717735.416729.304915146.820218424.04240.12234e-040.74290
8819813.620274.83818136.024822584.25360.34770.98440.75420.3144
8922238.520680.789618355.392323204.95140.11320.74960.71950.4495
9020682.220198.120917733.562522892.97810.36240.06890.56840.3192
9117818.617951.022515567.966420578.38660.46070.02080.67480.0154
9221872.118991.463716393.781621864.40670.02470.78820.51830.1031
932211718744.983116076.009821709.6570.01290.01930.5450.0826
9421865.921287.805618269.924638.46080.36760.31380.48530.6023
9523451.318674.393715852.519521830.37370.00150.02370.51980.0889
9620953.719537.043916553.95722877.46530.20290.01080.43340.2215
9722497.320297.863117171.566923802.31760.10930.35690.37990.3799


Univariate ARIMA Extrapolation Forecast Performance
time% S.E.PEMAPESq.EMSERMSE
860.04610.06180.00511305710.171108809.1809329.8624
870.05170.06010.0051012227.420284352.285290.4346
880.0581-0.02270.0019212740.470717728.3726133.1479
890.06230.07530.00632426461.7496202205.1458449.6723
900.06810.0240.002234332.599819527.7167139.7416
910.0747-0.00746e-0417535.71831461.309938.2271
920.07720.15170.01268298065.7806691505.4817831.5681
930.08070.17990.01511370497.7979947541.4832973.4174
940.08030.02720.0023334193.127527849.4273166.8815
950.08620.25580.021322818833.38161901569.44851378.9741
960.08720.07250.0062006914.4403167242.87408.9534
970.08810.10840.0094837522.8064403126.9005634.9228

\begin{tabular}{lllllllll}
\hline
Univariate ARIMA Extrapolation Forecast Performance \tabularnewline
time & % S.E. & PE & MAPE & Sq.E & MSE & RMSE \tabularnewline
86 & 0.0461 & 0.0618 & 0.0051 & 1305710.171 & 108809.1809 & 329.8624 \tabularnewline
87 & 0.0517 & 0.0601 & 0.005 & 1012227.4202 & 84352.285 & 290.4346 \tabularnewline
88 & 0.0581 & -0.0227 & 0.0019 & 212740.4707 & 17728.3726 & 133.1479 \tabularnewline
89 & 0.0623 & 0.0753 & 0.0063 & 2426461.7496 & 202205.1458 & 449.6723 \tabularnewline
90 & 0.0681 & 0.024 & 0.002 & 234332.5998 & 19527.7167 & 139.7416 \tabularnewline
91 & 0.0747 & -0.0074 & 6e-04 & 17535.7183 & 1461.3099 & 38.2271 \tabularnewline
92 & 0.0772 & 0.1517 & 0.0126 & 8298065.7806 & 691505.4817 & 831.5681 \tabularnewline
93 & 0.0807 & 0.1799 & 0.015 & 11370497.7979 & 947541.4832 & 973.4174 \tabularnewline
94 & 0.0803 & 0.0272 & 0.0023 & 334193.1275 & 27849.4273 & 166.8815 \tabularnewline
95 & 0.0862 & 0.2558 & 0.0213 & 22818833.3816 & 1901569.4485 & 1378.9741 \tabularnewline
96 & 0.0872 & 0.0725 & 0.006 & 2006914.4403 & 167242.87 & 408.9534 \tabularnewline
97 & 0.0881 & 0.1084 & 0.009 & 4837522.8064 & 403126.9005 & 634.9228 \tabularnewline
\hline
\end{tabular}
%Source: https://freestatistics.org/blog/index.php?pk=33684&T=2

[TABLE]
[ROW][C]Univariate ARIMA Extrapolation Forecast Performance[/C][/ROW]
[ROW][C]time[/C][C]% S.E.[/C][C]PE[/C][C]MAPE[/C][C]Sq.E[/C][C]MSE[/C][C]RMSE[/C][/ROW]
[ROW][C]86[/C][C]0.0461[/C][C]0.0618[/C][C]0.0051[/C][C]1305710.171[/C][C]108809.1809[/C][C]329.8624[/C][/ROW]
[ROW][C]87[/C][C]0.0517[/C][C]0.0601[/C][C]0.005[/C][C]1012227.4202[/C][C]84352.285[/C][C]290.4346[/C][/ROW]
[ROW][C]88[/C][C]0.0581[/C][C]-0.0227[/C][C]0.0019[/C][C]212740.4707[/C][C]17728.3726[/C][C]133.1479[/C][/ROW]
[ROW][C]89[/C][C]0.0623[/C][C]0.0753[/C][C]0.0063[/C][C]2426461.7496[/C][C]202205.1458[/C][C]449.6723[/C][/ROW]
[ROW][C]90[/C][C]0.0681[/C][C]0.024[/C][C]0.002[/C][C]234332.5998[/C][C]19527.7167[/C][C]139.7416[/C][/ROW]
[ROW][C]91[/C][C]0.0747[/C][C]-0.0074[/C][C]6e-04[/C][C]17535.7183[/C][C]1461.3099[/C][C]38.2271[/C][/ROW]
[ROW][C]92[/C][C]0.0772[/C][C]0.1517[/C][C]0.0126[/C][C]8298065.7806[/C][C]691505.4817[/C][C]831.5681[/C][/ROW]
[ROW][C]93[/C][C]0.0807[/C][C]0.1799[/C][C]0.015[/C][C]11370497.7979[/C][C]947541.4832[/C][C]973.4174[/C][/ROW]
[ROW][C]94[/C][C]0.0803[/C][C]0.0272[/C][C]0.0023[/C][C]334193.1275[/C][C]27849.4273[/C][C]166.8815[/C][/ROW]
[ROW][C]95[/C][C]0.0862[/C][C]0.2558[/C][C]0.0213[/C][C]22818833.3816[/C][C]1901569.4485[/C][C]1378.9741[/C][/ROW]
[ROW][C]96[/C][C]0.0872[/C][C]0.0725[/C][C]0.006[/C][C]2006914.4403[/C][C]167242.87[/C][C]408.9534[/C][/ROW]
[ROW][C]97[/C][C]0.0881[/C][C]0.1084[/C][C]0.009[/C][C]4837522.8064[/C][C]403126.9005[/C][C]634.9228[/C][/ROW]
[/TABLE]
Source: https://freestatistics.org/blog/index.php?pk=33684&T=2

Globally Unique Identifier (entire table): ba.freestatistics.org/blog/index.php?pk=33684&T=2

As an alternative you can also use a QR Code:  

The GUIDs for individual cells are displayed in the table below:

Univariate ARIMA Extrapolation Forecast Performance
time% S.E.PEMAPESq.EMSERMSE
860.04610.06180.00511305710.171108809.1809329.8624
870.05170.06010.0051012227.420284352.285290.4346
880.0581-0.02270.0019212740.470717728.3726133.1479
890.06230.07530.00632426461.7496202205.1458449.6723
900.06810.0240.002234332.599819527.7167139.7416
910.0747-0.00746e-0417535.71831461.309938.2271
920.07720.15170.01268298065.7806691505.4817831.5681
930.08070.17990.01511370497.7979947541.4832973.4174
940.08030.02720.0023334193.127527849.4273166.8815
950.08620.25580.021322818833.38161901569.44851378.9741
960.08720.07250.0062006914.4403167242.87408.9534
970.08810.10840.0094837522.8064403126.9005634.9228


Parameters (Session):
par1 = 12 ; par2 = 0.3 ; par3 = 0 ; par4 = 1 ; par5 = 12 ; par6 = 2 ; par7 = 0 ; par8 = 1 ; par9 = 1 ; par10 = FALSE ;
Parameters (R input):
par1 = 12 ; par2 = 0.3 ; par3 = 0 ; par4 = 1 ; par5 = 12 ; par6 = 2 ; par7 = 0 ; par8 = 1 ; par9 = 1 ; par10 = FALSE ;
R code (references can be found in the software module):
par1 <- as.numeric(par1) #cut off periods
par2 <- as.numeric(par2) #lambda
par3 <- as.numeric(par3) #degree of non-seasonal differencing
par4 <- as.numeric(par4) #degree of seasonal differencing
par5 <- as.numeric(par5) #seasonal period
par6 <- as.numeric(par6) #p
par7 <- as.numeric(par7) #q
par8 <- as.numeric(par8) #P
par9 <- as.numeric(par9) #Q
if (par10 == 'TRUE') par10 <- TRUE
if (par10 == 'FALSE') par10 <- FALSE
if (par2 == 0) x <- log(x)
if (par2 != 0) x <- x^par2
lx <- length(x)
first <- lx - 2*par1
nx <- lx - par1
nx1 <- nx + 1
fx <- lx - nx
if (fx < 1) {
fx <- par5
nx1 <- lx + fx - 1
first <- lx - 2*fx
}
first <- 1
if (fx < 3) fx <- round(lx/10,0)
(arima.out <- arima(x[1:nx], order=c(par6,par3,par7), seasonal=list(order=c(par8,par4,par9), period=par5), include.mean=par10, method='ML'))
(forecast <- predict(arima.out,fx))
(lb <- forecast$pred - 1.96 * forecast$se)
(ub <- forecast$pred + 1.96 * forecast$se)
if (par2 == 0) {
x <- exp(x)
forecast$pred <- exp(forecast$pred)
lb <- exp(lb)
ub <- exp(ub)
}
if (par2 != 0) {
x <- x^(1/par2)
forecast$pred <- forecast$pred^(1/par2)
lb <- lb^(1/par2)
ub <- ub^(1/par2)
}
if (par2 < 0) {
olb <- lb
lb <- ub
ub <- olb
}
(actandfor <- c(x[1:nx], forecast$pred))
(perc.se <- (ub-forecast$pred)/1.96/forecast$pred)
bitmap(file='test1.png')
opar <- par(mar=c(4,4,2,2),las=1)
ylim <- c( min(x[first:nx],lb), max(x[first:nx],ub))
plot(x,ylim=ylim,type='n',xlim=c(first,lx))
usr <- par('usr')
rect(usr[1],usr[3],nx+1,usr[4],border=NA,col='lemonchiffon')
rect(nx1,usr[3],usr[2],usr[4],border=NA,col='lavender')
abline(h= (-3:3)*2 , col ='gray', lty =3)
polygon( c(nx1:lx,lx:nx1), c(lb,rev(ub)), col = 'orange', lty=2,border=NA)
lines(nx1:lx, lb , lty=2)
lines(nx1:lx, ub , lty=2)
lines(x, lwd=2)
lines(nx1:lx, forecast$pred , lwd=2 , col ='white')
box()
par(opar)
dev.off()
prob.dec <- array(NA, dim=fx)
prob.sdec <- array(NA, dim=fx)
prob.ldec <- array(NA, dim=fx)
prob.pval <- array(NA, dim=fx)
perf.pe <- array(0, dim=fx)
perf.mape <- array(0, dim=fx)
perf.se <- array(0, dim=fx)
perf.mse <- array(0, dim=fx)
perf.rmse <- array(0, dim=fx)
for (i in 1:fx) {
locSD <- (ub[i] - forecast$pred[i]) / 1.96
perf.pe[i] = (x[nx+i] - forecast$pred[i]) / forecast$pred[i]
perf.mape[i] = perf.mape[i] + abs(perf.pe[i])
perf.se[i] = (x[nx+i] - forecast$pred[i])^2
perf.mse[i] = perf.mse[i] + perf.se[i]
prob.dec[i] = pnorm((x[nx+i-1] - forecast$pred[i]) / locSD)
prob.sdec[i] = pnorm((x[nx+i-par5] - forecast$pred[i]) / locSD)
prob.ldec[i] = pnorm((x[nx] - forecast$pred[i]) / locSD)
prob.pval[i] = pnorm(abs(x[nx+i] - forecast$pred[i]) / locSD)
}
perf.mape = perf.mape / fx
perf.mse = perf.mse / fx
perf.rmse = sqrt(perf.mse)
bitmap(file='test2.png')
plot(forecast$pred, pch=19, type='b',main='ARIMA Extrapolation Forecast', ylab='Forecast and 95% CI', xlab='time',ylim=c(min(lb),max(ub)))
dum <- forecast$pred
dum[1:12] <- x[(nx+1):lx]
lines(dum, lty=1)
lines(ub,lty=3)
lines(lb,lty=3)
dev.off()
load(file='createtable')
a<-table.start()
a<-table.row.start(a)
a<-table.element(a,'Univariate ARIMA Extrapolation Forecast',9,TRUE)
a<-table.row.end(a)
a<-table.row.start(a)
a<-table.element(a,'time',1,header=TRUE)
a<-table.element(a,'Y[t]',1,header=TRUE)
a<-table.element(a,'F[t]',1,header=TRUE)
a<-table.element(a,'95% LB',1,header=TRUE)
a<-table.element(a,'95% UB',1,header=TRUE)
a<-table.element(a,'p-value
(H0: Y[t] = F[t])',1,header=TRUE)
a<-table.element(a,'P(F[t]>Y[t-1])',1,header=TRUE)
a<-table.element(a,'P(F[t]>Y[t-s])',1,header=TRUE)
mylab <- paste('P(F[t]>Y[',nx,sep='')
mylab <- paste(mylab,'])',sep='')
a<-table.element(a,mylab,1,header=TRUE)
a<-table.row.end(a)
for (i in (nx-par5):nx) {
a<-table.row.start(a)
a<-table.element(a,i,header=TRUE)
a<-table.element(a,x[i])
a<-table.element(a,'-')
a<-table.row.end(a)
}
for (i in 1:fx) {
a<-table.row.start(a)
a<-table.element(a,nx+i,header=TRUE)
a<-table.element(a,round(x[nx+i],4))
a<-table.element(a,round(forecast$pred[i],4))
a<-table.element(a,round(lb[i],4))
a<-table.element(a,round(ub[i],4))
a<-table.element(a,round((1-prob.pval[i]),4))
a<-table.element(a,round((1-prob.dec[i]),4))
a<-table.element(a,round((1-prob.sdec[i]),4))
a<-table.element(a,round((1-prob.ldec[i]),4))
a<-table.row.end(a)
}
a<-table.end(a)
table.save(a,file='mytable.tab')
a<-table.start()
a<-table.row.start(a)
a<-table.element(a,'Univariate ARIMA Extrapolation Forecast Performance',7,TRUE)
a<-table.row.end(a)
a<-table.row.start(a)
a<-table.element(a,'time',1,header=TRUE)
a<-table.element(a,'% S.E.',1,header=TRUE)
a<-table.element(a,'PE',1,header=TRUE)
a<-table.element(a,'MAPE',1,header=TRUE)
a<-table.element(a,'Sq.E',1,header=TRUE)
a<-table.element(a,'MSE',1,header=TRUE)
a<-table.element(a,'RMSE',1,header=TRUE)
a<-table.row.end(a)
for (i in 1:fx) {
a<-table.row.start(a)
a<-table.element(a,nx+i,header=TRUE)
a<-table.element(a,round(perc.se[i],4))
a<-table.element(a,round(perf.pe[i],4))
a<-table.element(a,round(perf.mape[i],4))
a<-table.element(a,round(perf.se[i],4))
a<-table.element(a,round(perf.mse[i],4))
a<-table.element(a,round(perf.rmse[i],4))
a<-table.row.end(a)
}
a<-table.end(a)
table.save(a,file='mytable1.tab')