Free Statistics

of Irreproducible Research!

Author's title

Author*The author of this computation has been verified*
R Software Modulerwasp_autocorrelation.wasp
Title produced by software(Partial) Autocorrelation Function
Date of computationMon, 15 Dec 2008 04:05:07 -0700
Cite this page as followsStatistical Computations at FreeStatistics.org, Office for Research Development and Education, URL https://freestatistics.org/blog/index.php?v=date/2008/Dec/15/t1229339142qn0g58ff520hrex.htm/, Retrieved Wed, 15 May 2024 05:53:05 +0000
Statistical Computations at FreeStatistics.org, Office for Research Development and Education, URL https://freestatistics.org/blog/index.php?pk=33664, Retrieved Wed, 15 May 2024 05:53:05 +0000
QR Codes:

Original text written by user:
IsPrivate?No (this computation is public)
User-defined keywords
Estimated Impact187
Family? (F = Feedback message, R = changed R code, M = changed R Module, P = changed Parameters, D = changed Data)
-       [(Partial) Autocorrelation Function] [] [2008-12-15 11:05:07] [d41d8cd98f00b204e9800998ecf8427e] [Current]
Feedback Forum

Post a new message
Dataseries X:
1961782
1787447
1953757
1828167
2078223
1777226
1538059
1678452
2262924
1616451
1829222
1763216
2138777
1565784
1781485
1962103
1775358
1837255
1917824
1878651
2124030
1948811
1947985
1719466
2139078
2086587
2020001
2405555
2152069
2791310
2397287
1885473
1978324
2165120
2052877
1726766
2267082
2501737
1916630
2177682
1859283
1718749
1819181
1463556
1979279
1723911
1528538
1635412
2255789
1698773
1635959
2054968
1794346
1938855
2112672
1446965
1610773
1576815
1509935
1769046


Summary of computational transaction
Raw Inputview raw input (R code)
Raw Outputview raw output of R engine
Computing time3 seconds
R Server'Herman Ole Andreas Wold' @ 193.190.124.10:1001

\begin{tabular}{lllllllll}
\hline
Summary of computational transaction \tabularnewline
Raw Input & view raw input (R code)  \tabularnewline
Raw Output & view raw output of R engine  \tabularnewline
Computing time & 3 seconds \tabularnewline
R Server & 'Herman Ole Andreas Wold' @ 193.190.124.10:1001 \tabularnewline
\hline
\end{tabular}
%Source: https://freestatistics.org/blog/index.php?pk=33664&T=0

[TABLE]
[ROW][C]Summary of computational transaction[/C][/ROW]
[ROW][C]Raw Input[/C][C]view raw input (R code) [/C][/ROW]
[ROW][C]Raw Output[/C][C]view raw output of R engine [/C][/ROW]
[ROW][C]Computing time[/C][C]3 seconds[/C][/ROW]
[ROW][C]R Server[/C][C]'Herman Ole Andreas Wold' @ 193.190.124.10:1001[/C][/ROW]
[/TABLE]
Source: https://freestatistics.org/blog/index.php?pk=33664&T=0

Globally Unique Identifier (entire table): ba.freestatistics.org/blog/index.php?pk=33664&T=0

As an alternative you can also use a QR Code:  

The GUIDs for individual cells are displayed in the table below:

Summary of computational transaction
Raw Inputview raw input (R code)
Raw Outputview raw output of R engine
Computing time3 seconds
R Server'Herman Ole Andreas Wold' @ 193.190.124.10:1001


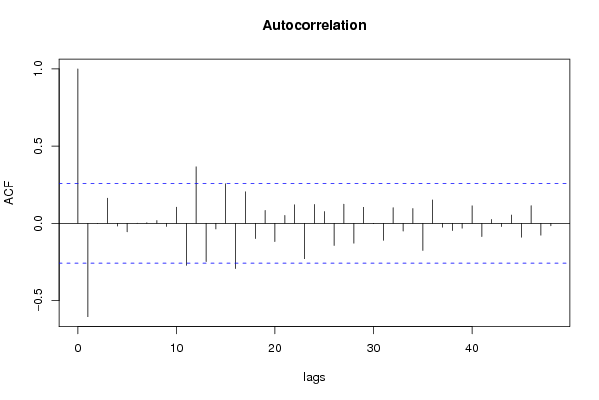
Autocorrelation Function
Time lag kACF(k)T-STATP-value
1-0.604116-4.60081.2e-05
2-0.00058-0.00440.498244
30.1629321.24090.109827
4-0.017731-0.1350.446524
5-0.054585-0.41570.339578
60.0009380.00710.497162
70.0043880.03340.486729
80.0179260.13650.445942
9-0.020052-0.15270.439577
100.1048510.79850.213914
11-0.271648-2.06880.021516
120.3665772.79180.003543
13-0.247123-1.8820.032426
14-0.035759-0.27230.393167
150.2558581.94860.028096
16-0.292835-2.23020.014811
170.2039731.55340.062883
18-0.098606-0.7510.227857
190.0840570.64020.262295
20-0.117669-0.89610.186941
210.0510280.38860.349491
220.1200070.91390.182264
23-0.228935-1.74350.043271
240.1229030.9360.176576
250.0762620.58080.281814
26-0.142803-1.08760.140644
270.1240940.94510.174272
28-0.128057-0.97530.166742
290.1038770.79110.216053
30-0.001754-0.01340.494694
31-0.110142-0.83880.202508
320.1016820.77440.220924
33-0.049993-0.38070.352395
340.0957970.72960.234296
35-0.175207-1.33430.093654
360.1520151.15770.125863
37-0.024617-0.18750.42597
38-0.046915-0.35730.361083
39-0.03118-0.23750.406569
400.113520.86450.195426
41-0.085106-0.64820.259722
420.0252430.19220.42411
43-0.020943-0.15950.436916
440.0536350.40850.342216
45-0.08986-0.68430.24824
460.1145510.87240.193295
47-0.076523-0.58280.281149
48-0.015773-0.12010.452399

\begin{tabular}{lllllllll}
\hline
Autocorrelation Function \tabularnewline
Time lag k & ACF(k) & T-STAT & P-value \tabularnewline
1 & -0.604116 & -4.6008 & 1.2e-05 \tabularnewline
2 & -0.00058 & -0.0044 & 0.498244 \tabularnewline
3 & 0.162932 & 1.2409 & 0.109827 \tabularnewline
4 & -0.017731 & -0.135 & 0.446524 \tabularnewline
5 & -0.054585 & -0.4157 & 0.339578 \tabularnewline
6 & 0.000938 & 0.0071 & 0.497162 \tabularnewline
7 & 0.004388 & 0.0334 & 0.486729 \tabularnewline
8 & 0.017926 & 0.1365 & 0.445942 \tabularnewline
9 & -0.020052 & -0.1527 & 0.439577 \tabularnewline
10 & 0.104851 & 0.7985 & 0.213914 \tabularnewline
11 & -0.271648 & -2.0688 & 0.021516 \tabularnewline
12 & 0.366577 & 2.7918 & 0.003543 \tabularnewline
13 & -0.247123 & -1.882 & 0.032426 \tabularnewline
14 & -0.035759 & -0.2723 & 0.393167 \tabularnewline
15 & 0.255858 & 1.9486 & 0.028096 \tabularnewline
16 & -0.292835 & -2.2302 & 0.014811 \tabularnewline
17 & 0.203973 & 1.5534 & 0.062883 \tabularnewline
18 & -0.098606 & -0.751 & 0.227857 \tabularnewline
19 & 0.084057 & 0.6402 & 0.262295 \tabularnewline
20 & -0.117669 & -0.8961 & 0.186941 \tabularnewline
21 & 0.051028 & 0.3886 & 0.349491 \tabularnewline
22 & 0.120007 & 0.9139 & 0.182264 \tabularnewline
23 & -0.228935 & -1.7435 & 0.043271 \tabularnewline
24 & 0.122903 & 0.936 & 0.176576 \tabularnewline
25 & 0.076262 & 0.5808 & 0.281814 \tabularnewline
26 & -0.142803 & -1.0876 & 0.140644 \tabularnewline
27 & 0.124094 & 0.9451 & 0.174272 \tabularnewline
28 & -0.128057 & -0.9753 & 0.166742 \tabularnewline
29 & 0.103877 & 0.7911 & 0.216053 \tabularnewline
30 & -0.001754 & -0.0134 & 0.494694 \tabularnewline
31 & -0.110142 & -0.8388 & 0.202508 \tabularnewline
32 & 0.101682 & 0.7744 & 0.220924 \tabularnewline
33 & -0.049993 & -0.3807 & 0.352395 \tabularnewline
34 & 0.095797 & 0.7296 & 0.234296 \tabularnewline
35 & -0.175207 & -1.3343 & 0.093654 \tabularnewline
36 & 0.152015 & 1.1577 & 0.125863 \tabularnewline
37 & -0.024617 & -0.1875 & 0.42597 \tabularnewline
38 & -0.046915 & -0.3573 & 0.361083 \tabularnewline
39 & -0.03118 & -0.2375 & 0.406569 \tabularnewline
40 & 0.11352 & 0.8645 & 0.195426 \tabularnewline
41 & -0.085106 & -0.6482 & 0.259722 \tabularnewline
42 & 0.025243 & 0.1922 & 0.42411 \tabularnewline
43 & -0.020943 & -0.1595 & 0.436916 \tabularnewline
44 & 0.053635 & 0.4085 & 0.342216 \tabularnewline
45 & -0.08986 & -0.6843 & 0.24824 \tabularnewline
46 & 0.114551 & 0.8724 & 0.193295 \tabularnewline
47 & -0.076523 & -0.5828 & 0.281149 \tabularnewline
48 & -0.015773 & -0.1201 & 0.452399 \tabularnewline
\hline
\end{tabular}
%Source: https://freestatistics.org/blog/index.php?pk=33664&T=1

[TABLE]
[ROW][C]Autocorrelation Function[/C][/ROW]
[ROW][C]Time lag k[/C][C]ACF(k)[/C][C]T-STAT[/C][C]P-value[/C][/ROW]
[ROW][C]1[/C][C]-0.604116[/C][C]-4.6008[/C][C]1.2e-05[/C][/ROW]
[ROW][C]2[/C][C]-0.00058[/C][C]-0.0044[/C][C]0.498244[/C][/ROW]
[ROW][C]3[/C][C]0.162932[/C][C]1.2409[/C][C]0.109827[/C][/ROW]
[ROW][C]4[/C][C]-0.017731[/C][C]-0.135[/C][C]0.446524[/C][/ROW]
[ROW][C]5[/C][C]-0.054585[/C][C]-0.4157[/C][C]0.339578[/C][/ROW]
[ROW][C]6[/C][C]0.000938[/C][C]0.0071[/C][C]0.497162[/C][/ROW]
[ROW][C]7[/C][C]0.004388[/C][C]0.0334[/C][C]0.486729[/C][/ROW]
[ROW][C]8[/C][C]0.017926[/C][C]0.1365[/C][C]0.445942[/C][/ROW]
[ROW][C]9[/C][C]-0.020052[/C][C]-0.1527[/C][C]0.439577[/C][/ROW]
[ROW][C]10[/C][C]0.104851[/C][C]0.7985[/C][C]0.213914[/C][/ROW]
[ROW][C]11[/C][C]-0.271648[/C][C]-2.0688[/C][C]0.021516[/C][/ROW]
[ROW][C]12[/C][C]0.366577[/C][C]2.7918[/C][C]0.003543[/C][/ROW]
[ROW][C]13[/C][C]-0.247123[/C][C]-1.882[/C][C]0.032426[/C][/ROW]
[ROW][C]14[/C][C]-0.035759[/C][C]-0.2723[/C][C]0.393167[/C][/ROW]
[ROW][C]15[/C][C]0.255858[/C][C]1.9486[/C][C]0.028096[/C][/ROW]
[ROW][C]16[/C][C]-0.292835[/C][C]-2.2302[/C][C]0.014811[/C][/ROW]
[ROW][C]17[/C][C]0.203973[/C][C]1.5534[/C][C]0.062883[/C][/ROW]
[ROW][C]18[/C][C]-0.098606[/C][C]-0.751[/C][C]0.227857[/C][/ROW]
[ROW][C]19[/C][C]0.084057[/C][C]0.6402[/C][C]0.262295[/C][/ROW]
[ROW][C]20[/C][C]-0.117669[/C][C]-0.8961[/C][C]0.186941[/C][/ROW]
[ROW][C]21[/C][C]0.051028[/C][C]0.3886[/C][C]0.349491[/C][/ROW]
[ROW][C]22[/C][C]0.120007[/C][C]0.9139[/C][C]0.182264[/C][/ROW]
[ROW][C]23[/C][C]-0.228935[/C][C]-1.7435[/C][C]0.043271[/C][/ROW]
[ROW][C]24[/C][C]0.122903[/C][C]0.936[/C][C]0.176576[/C][/ROW]
[ROW][C]25[/C][C]0.076262[/C][C]0.5808[/C][C]0.281814[/C][/ROW]
[ROW][C]26[/C][C]-0.142803[/C][C]-1.0876[/C][C]0.140644[/C][/ROW]
[ROW][C]27[/C][C]0.124094[/C][C]0.9451[/C][C]0.174272[/C][/ROW]
[ROW][C]28[/C][C]-0.128057[/C][C]-0.9753[/C][C]0.166742[/C][/ROW]
[ROW][C]29[/C][C]0.103877[/C][C]0.7911[/C][C]0.216053[/C][/ROW]
[ROW][C]30[/C][C]-0.001754[/C][C]-0.0134[/C][C]0.494694[/C][/ROW]
[ROW][C]31[/C][C]-0.110142[/C][C]-0.8388[/C][C]0.202508[/C][/ROW]
[ROW][C]32[/C][C]0.101682[/C][C]0.7744[/C][C]0.220924[/C][/ROW]
[ROW][C]33[/C][C]-0.049993[/C][C]-0.3807[/C][C]0.352395[/C][/ROW]
[ROW][C]34[/C][C]0.095797[/C][C]0.7296[/C][C]0.234296[/C][/ROW]
[ROW][C]35[/C][C]-0.175207[/C][C]-1.3343[/C][C]0.093654[/C][/ROW]
[ROW][C]36[/C][C]0.152015[/C][C]1.1577[/C][C]0.125863[/C][/ROW]
[ROW][C]37[/C][C]-0.024617[/C][C]-0.1875[/C][C]0.42597[/C][/ROW]
[ROW][C]38[/C][C]-0.046915[/C][C]-0.3573[/C][C]0.361083[/C][/ROW]
[ROW][C]39[/C][C]-0.03118[/C][C]-0.2375[/C][C]0.406569[/C][/ROW]
[ROW][C]40[/C][C]0.11352[/C][C]0.8645[/C][C]0.195426[/C][/ROW]
[ROW][C]41[/C][C]-0.085106[/C][C]-0.6482[/C][C]0.259722[/C][/ROW]
[ROW][C]42[/C][C]0.025243[/C][C]0.1922[/C][C]0.42411[/C][/ROW]
[ROW][C]43[/C][C]-0.020943[/C][C]-0.1595[/C][C]0.436916[/C][/ROW]
[ROW][C]44[/C][C]0.053635[/C][C]0.4085[/C][C]0.342216[/C][/ROW]
[ROW][C]45[/C][C]-0.08986[/C][C]-0.6843[/C][C]0.24824[/C][/ROW]
[ROW][C]46[/C][C]0.114551[/C][C]0.8724[/C][C]0.193295[/C][/ROW]
[ROW][C]47[/C][C]-0.076523[/C][C]-0.5828[/C][C]0.281149[/C][/ROW]
[ROW][C]48[/C][C]-0.015773[/C][C]-0.1201[/C][C]0.452399[/C][/ROW]
[/TABLE]
Source: https://freestatistics.org/blog/index.php?pk=33664&T=1

Globally Unique Identifier (entire table): ba.freestatistics.org/blog/index.php?pk=33664&T=1

As an alternative you can also use a QR Code:  

The GUIDs for individual cells are displayed in the table below:

Autocorrelation Function
Time lag kACF(k)T-STATP-value
1-0.604116-4.60081.2e-05
2-0.00058-0.00440.498244
30.1629321.24090.109827
4-0.017731-0.1350.446524
5-0.054585-0.41570.339578
60.0009380.00710.497162
70.0043880.03340.486729
80.0179260.13650.445942
9-0.020052-0.15270.439577
100.1048510.79850.213914
11-0.271648-2.06880.021516
120.3665772.79180.003543
13-0.247123-1.8820.032426
14-0.035759-0.27230.393167
150.2558581.94860.028096
16-0.292835-2.23020.014811
170.2039731.55340.062883
18-0.098606-0.7510.227857
190.0840570.64020.262295
20-0.117669-0.89610.186941
210.0510280.38860.349491
220.1200070.91390.182264
23-0.228935-1.74350.043271
240.1229030.9360.176576
250.0762620.58080.281814
26-0.142803-1.08760.140644
270.1240940.94510.174272
28-0.128057-0.97530.166742
290.1038770.79110.216053
30-0.001754-0.01340.494694
31-0.110142-0.83880.202508
320.1016820.77440.220924
33-0.049993-0.38070.352395
340.0957970.72960.234296
35-0.175207-1.33430.093654
360.1520151.15770.125863
37-0.024617-0.18750.42597
38-0.046915-0.35730.361083
39-0.03118-0.23750.406569
400.113520.86450.195426
41-0.085106-0.64820.259722
420.0252430.19220.42411
43-0.020943-0.15950.436916
440.0536350.40850.342216
45-0.08986-0.68430.24824
460.1145510.87240.193295
47-0.076523-0.58280.281149
48-0.015773-0.12010.452399


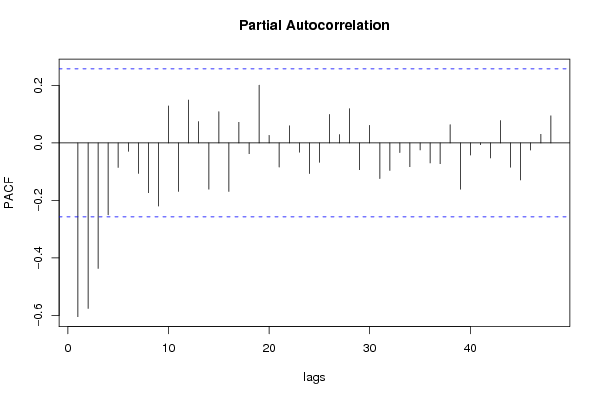
Partial Autocorrelation Function
Time lag kPACF(k)T-STATP-value
1-0.604116-4.60081.2e-05
2-0.575609-4.38372.5e-05
3-0.436501-3.32430.00077
4-0.250136-1.9050.030873
5-0.085407-0.65040.258989
6-0.029254-0.22280.41224
7-0.10613-0.80830.211121
8-0.172866-1.31650.096591
9-0.219467-1.67140.050014
100.1288540.98130.165255
11-0.168652-1.28440.102052
120.1491771.13610.130294
130.0744780.56720.28638
14-0.160894-1.22530.112701
150.1087640.82830.205441
16-0.168579-1.28390.102148
170.0718160.54690.29326
18-0.037509-0.28570.388077
190.2009751.53060.065655
200.026340.20060.420857
21-0.083676-0.63730.263233
220.0594790.4530.326128
23-0.032302-0.2460.403274
24-0.106683-0.81250.209922
25-0.067428-0.51350.30477
260.0989690.75370.227032
270.0292070.22240.41238
280.1191710.90760.183928
29-0.092915-0.70760.241008
300.0611310.46560.321638
31-0.123928-0.94380.174592
32-0.095444-0.72690.235111
33-0.033506-0.25520.399746
34-0.082517-0.62840.266096
35-0.024442-0.18610.426489
36-0.06934-0.52810.299731
37-0.072197-0.54980.292271
380.0636070.48440.314957
39-0.160655-1.22350.113042
40-0.042278-0.3220.374313
41-0.006104-0.04650.48154
42-0.052066-0.39650.346587
430.0778440.59280.277797
44-0.084097-0.64050.262197
45-0.128702-0.98020.165537
46-0.024646-0.18770.425883
470.030240.23030.409334
480.094340.71850.237676

\begin{tabular}{lllllllll}
\hline
Partial Autocorrelation Function \tabularnewline
Time lag k & PACF(k) & T-STAT & P-value \tabularnewline
1 & -0.604116 & -4.6008 & 1.2e-05 \tabularnewline
2 & -0.575609 & -4.3837 & 2.5e-05 \tabularnewline
3 & -0.436501 & -3.3243 & 0.00077 \tabularnewline
4 & -0.250136 & -1.905 & 0.030873 \tabularnewline
5 & -0.085407 & -0.6504 & 0.258989 \tabularnewline
6 & -0.029254 & -0.2228 & 0.41224 \tabularnewline
7 & -0.10613 & -0.8083 & 0.211121 \tabularnewline
8 & -0.172866 & -1.3165 & 0.096591 \tabularnewline
9 & -0.219467 & -1.6714 & 0.050014 \tabularnewline
10 & 0.128854 & 0.9813 & 0.165255 \tabularnewline
11 & -0.168652 & -1.2844 & 0.102052 \tabularnewline
12 & 0.149177 & 1.1361 & 0.130294 \tabularnewline
13 & 0.074478 & 0.5672 & 0.28638 \tabularnewline
14 & -0.160894 & -1.2253 & 0.112701 \tabularnewline
15 & 0.108764 & 0.8283 & 0.205441 \tabularnewline
16 & -0.168579 & -1.2839 & 0.102148 \tabularnewline
17 & 0.071816 & 0.5469 & 0.29326 \tabularnewline
18 & -0.037509 & -0.2857 & 0.388077 \tabularnewline
19 & 0.200975 & 1.5306 & 0.065655 \tabularnewline
20 & 0.02634 & 0.2006 & 0.420857 \tabularnewline
21 & -0.083676 & -0.6373 & 0.263233 \tabularnewline
22 & 0.059479 & 0.453 & 0.326128 \tabularnewline
23 & -0.032302 & -0.246 & 0.403274 \tabularnewline
24 & -0.106683 & -0.8125 & 0.209922 \tabularnewline
25 & -0.067428 & -0.5135 & 0.30477 \tabularnewline
26 & 0.098969 & 0.7537 & 0.227032 \tabularnewline
27 & 0.029207 & 0.2224 & 0.41238 \tabularnewline
28 & 0.119171 & 0.9076 & 0.183928 \tabularnewline
29 & -0.092915 & -0.7076 & 0.241008 \tabularnewline
30 & 0.061131 & 0.4656 & 0.321638 \tabularnewline
31 & -0.123928 & -0.9438 & 0.174592 \tabularnewline
32 & -0.095444 & -0.7269 & 0.235111 \tabularnewline
33 & -0.033506 & -0.2552 & 0.399746 \tabularnewline
34 & -0.082517 & -0.6284 & 0.266096 \tabularnewline
35 & -0.024442 & -0.1861 & 0.426489 \tabularnewline
36 & -0.06934 & -0.5281 & 0.299731 \tabularnewline
37 & -0.072197 & -0.5498 & 0.292271 \tabularnewline
38 & 0.063607 & 0.4844 & 0.314957 \tabularnewline
39 & -0.160655 & -1.2235 & 0.113042 \tabularnewline
40 & -0.042278 & -0.322 & 0.374313 \tabularnewline
41 & -0.006104 & -0.0465 & 0.48154 \tabularnewline
42 & -0.052066 & -0.3965 & 0.346587 \tabularnewline
43 & 0.077844 & 0.5928 & 0.277797 \tabularnewline
44 & -0.084097 & -0.6405 & 0.262197 \tabularnewline
45 & -0.128702 & -0.9802 & 0.165537 \tabularnewline
46 & -0.024646 & -0.1877 & 0.425883 \tabularnewline
47 & 0.03024 & 0.2303 & 0.409334 \tabularnewline
48 & 0.09434 & 0.7185 & 0.237676 \tabularnewline
\hline
\end{tabular}
%Source: https://freestatistics.org/blog/index.php?pk=33664&T=2

[TABLE]
[ROW][C]Partial Autocorrelation Function[/C][/ROW]
[ROW][C]Time lag k[/C][C]PACF(k)[/C][C]T-STAT[/C][C]P-value[/C][/ROW]
[ROW][C]1[/C][C]-0.604116[/C][C]-4.6008[/C][C]1.2e-05[/C][/ROW]
[ROW][C]2[/C][C]-0.575609[/C][C]-4.3837[/C][C]2.5e-05[/C][/ROW]
[ROW][C]3[/C][C]-0.436501[/C][C]-3.3243[/C][C]0.00077[/C][/ROW]
[ROW][C]4[/C][C]-0.250136[/C][C]-1.905[/C][C]0.030873[/C][/ROW]
[ROW][C]5[/C][C]-0.085407[/C][C]-0.6504[/C][C]0.258989[/C][/ROW]
[ROW][C]6[/C][C]-0.029254[/C][C]-0.2228[/C][C]0.41224[/C][/ROW]
[ROW][C]7[/C][C]-0.10613[/C][C]-0.8083[/C][C]0.211121[/C][/ROW]
[ROW][C]8[/C][C]-0.172866[/C][C]-1.3165[/C][C]0.096591[/C][/ROW]
[ROW][C]9[/C][C]-0.219467[/C][C]-1.6714[/C][C]0.050014[/C][/ROW]
[ROW][C]10[/C][C]0.128854[/C][C]0.9813[/C][C]0.165255[/C][/ROW]
[ROW][C]11[/C][C]-0.168652[/C][C]-1.2844[/C][C]0.102052[/C][/ROW]
[ROW][C]12[/C][C]0.149177[/C][C]1.1361[/C][C]0.130294[/C][/ROW]
[ROW][C]13[/C][C]0.074478[/C][C]0.5672[/C][C]0.28638[/C][/ROW]
[ROW][C]14[/C][C]-0.160894[/C][C]-1.2253[/C][C]0.112701[/C][/ROW]
[ROW][C]15[/C][C]0.108764[/C][C]0.8283[/C][C]0.205441[/C][/ROW]
[ROW][C]16[/C][C]-0.168579[/C][C]-1.2839[/C][C]0.102148[/C][/ROW]
[ROW][C]17[/C][C]0.071816[/C][C]0.5469[/C][C]0.29326[/C][/ROW]
[ROW][C]18[/C][C]-0.037509[/C][C]-0.2857[/C][C]0.388077[/C][/ROW]
[ROW][C]19[/C][C]0.200975[/C][C]1.5306[/C][C]0.065655[/C][/ROW]
[ROW][C]20[/C][C]0.02634[/C][C]0.2006[/C][C]0.420857[/C][/ROW]
[ROW][C]21[/C][C]-0.083676[/C][C]-0.6373[/C][C]0.263233[/C][/ROW]
[ROW][C]22[/C][C]0.059479[/C][C]0.453[/C][C]0.326128[/C][/ROW]
[ROW][C]23[/C][C]-0.032302[/C][C]-0.246[/C][C]0.403274[/C][/ROW]
[ROW][C]24[/C][C]-0.106683[/C][C]-0.8125[/C][C]0.209922[/C][/ROW]
[ROW][C]25[/C][C]-0.067428[/C][C]-0.5135[/C][C]0.30477[/C][/ROW]
[ROW][C]26[/C][C]0.098969[/C][C]0.7537[/C][C]0.227032[/C][/ROW]
[ROW][C]27[/C][C]0.029207[/C][C]0.2224[/C][C]0.41238[/C][/ROW]
[ROW][C]28[/C][C]0.119171[/C][C]0.9076[/C][C]0.183928[/C][/ROW]
[ROW][C]29[/C][C]-0.092915[/C][C]-0.7076[/C][C]0.241008[/C][/ROW]
[ROW][C]30[/C][C]0.061131[/C][C]0.4656[/C][C]0.321638[/C][/ROW]
[ROW][C]31[/C][C]-0.123928[/C][C]-0.9438[/C][C]0.174592[/C][/ROW]
[ROW][C]32[/C][C]-0.095444[/C][C]-0.7269[/C][C]0.235111[/C][/ROW]
[ROW][C]33[/C][C]-0.033506[/C][C]-0.2552[/C][C]0.399746[/C][/ROW]
[ROW][C]34[/C][C]-0.082517[/C][C]-0.6284[/C][C]0.266096[/C][/ROW]
[ROW][C]35[/C][C]-0.024442[/C][C]-0.1861[/C][C]0.426489[/C][/ROW]
[ROW][C]36[/C][C]-0.06934[/C][C]-0.5281[/C][C]0.299731[/C][/ROW]
[ROW][C]37[/C][C]-0.072197[/C][C]-0.5498[/C][C]0.292271[/C][/ROW]
[ROW][C]38[/C][C]0.063607[/C][C]0.4844[/C][C]0.314957[/C][/ROW]
[ROW][C]39[/C][C]-0.160655[/C][C]-1.2235[/C][C]0.113042[/C][/ROW]
[ROW][C]40[/C][C]-0.042278[/C][C]-0.322[/C][C]0.374313[/C][/ROW]
[ROW][C]41[/C][C]-0.006104[/C][C]-0.0465[/C][C]0.48154[/C][/ROW]
[ROW][C]42[/C][C]-0.052066[/C][C]-0.3965[/C][C]0.346587[/C][/ROW]
[ROW][C]43[/C][C]0.077844[/C][C]0.5928[/C][C]0.277797[/C][/ROW]
[ROW][C]44[/C][C]-0.084097[/C][C]-0.6405[/C][C]0.262197[/C][/ROW]
[ROW][C]45[/C][C]-0.128702[/C][C]-0.9802[/C][C]0.165537[/C][/ROW]
[ROW][C]46[/C][C]-0.024646[/C][C]-0.1877[/C][C]0.425883[/C][/ROW]
[ROW][C]47[/C][C]0.03024[/C][C]0.2303[/C][C]0.409334[/C][/ROW]
[ROW][C]48[/C][C]0.09434[/C][C]0.7185[/C][C]0.237676[/C][/ROW]
[/TABLE]
Source: https://freestatistics.org/blog/index.php?pk=33664&T=2

Globally Unique Identifier (entire table): ba.freestatistics.org/blog/index.php?pk=33664&T=2

As an alternative you can also use a QR Code:  

The GUIDs for individual cells are displayed in the table below:

Partial Autocorrelation Function
Time lag kPACF(k)T-STATP-value
1-0.604116-4.60081.2e-05
2-0.575609-4.38372.5e-05
3-0.436501-3.32430.00077
4-0.250136-1.9050.030873
5-0.085407-0.65040.258989
6-0.029254-0.22280.41224
7-0.10613-0.80830.211121
8-0.172866-1.31650.096591
9-0.219467-1.67140.050014
100.1288540.98130.165255
11-0.168652-1.28440.102052
120.1491771.13610.130294
130.0744780.56720.28638
14-0.160894-1.22530.112701
150.1087640.82830.205441
16-0.168579-1.28390.102148
170.0718160.54690.29326
18-0.037509-0.28570.388077
190.2009751.53060.065655
200.026340.20060.420857
21-0.083676-0.63730.263233
220.0594790.4530.326128
23-0.032302-0.2460.403274
24-0.106683-0.81250.209922
25-0.067428-0.51350.30477
260.0989690.75370.227032
270.0292070.22240.41238
280.1191710.90760.183928
29-0.092915-0.70760.241008
300.0611310.46560.321638
31-0.123928-0.94380.174592
32-0.095444-0.72690.235111
33-0.033506-0.25520.399746
34-0.082517-0.62840.266096
35-0.024442-0.18610.426489
36-0.06934-0.52810.299731
37-0.072197-0.54980.292271
380.0636070.48440.314957
39-0.160655-1.22350.113042
40-0.042278-0.3220.374313
41-0.006104-0.04650.48154
42-0.052066-0.39650.346587
430.0778440.59280.277797
44-0.084097-0.64050.262197
45-0.128702-0.98020.165537
46-0.024646-0.18770.425883
470.030240.23030.409334
480.094340.71850.237676


Parameters (Session):
par1 = 48 ; par2 = 1 ; par3 = 2 ; par4 = 0 ; par5 = 12 ;
Parameters (R input):
par1 = 48 ; par2 = 1 ; par3 = 2 ; par4 = 0 ; par5 = 12 ;
R code (references can be found in the software module):
if (par1 == 'Default') {
par1 = 10*log10(length(x))
} else {
par1 <- as.numeric(par1)
}
par2 <- as.numeric(par2)
par3 <- as.numeric(par3)
par4 <- as.numeric(par4)
par5 <- as.numeric(par5)
if (par2 == 0) {
x <- log(x)
} else {
x <- (x ^ par2 - 1) / par2
}
if (par3 > 0) x <- diff(x,lag=1,difference=par3)
if (par4 > 0) x <- diff(x,lag=par5,difference=par4)
bitmap(file='pic1.png')
racf <- acf(x,par1,main='Autocorrelation',xlab='lags',ylab='ACF')
dev.off()
bitmap(file='pic2.png')
rpacf <- pacf(x,par1,main='Partial Autocorrelation',xlab='lags',ylab='PACF')
dev.off()
(myacf <- c(racf$acf))
(mypacf <- c(rpacf$acf))
lengthx <- length(x)
sqrtn <- sqrt(lengthx)
load(file='createtable')
a<-table.start()
a<-table.row.start(a)
a<-table.element(a,'Autocorrelation Function',4,TRUE)
a<-table.row.end(a)
a<-table.row.start(a)
a<-table.element(a,'Time lag k',header=TRUE)
a<-table.element(a,hyperlink('basics.htm','ACF(k)','click here for more information about the Autocorrelation Function'),header=TRUE)
a<-table.element(a,'T-STAT',header=TRUE)
a<-table.element(a,'P-value',header=TRUE)
a<-table.row.end(a)
for (i in 2:(par1+1)) {
a<-table.row.start(a)
a<-table.element(a,i-1,header=TRUE)
a<-table.element(a,round(myacf[i],6))
mytstat <- myacf[i]*sqrtn
a<-table.element(a,round(mytstat,4))
a<-table.element(a,round(1-pt(abs(mytstat),lengthx),6))
a<-table.row.end(a)
}
a<-table.end(a)
table.save(a,file='mytable.tab')
a<-table.start()
a<-table.row.start(a)
a<-table.element(a,'Partial Autocorrelation Function',4,TRUE)
a<-table.row.end(a)
a<-table.row.start(a)
a<-table.element(a,'Time lag k',header=TRUE)
a<-table.element(a,hyperlink('basics.htm','PACF(k)','click here for more information about the Partial Autocorrelation Function'),header=TRUE)
a<-table.element(a,'T-STAT',header=TRUE)
a<-table.element(a,'P-value',header=TRUE)
a<-table.row.end(a)
for (i in 1:par1) {
a<-table.row.start(a)
a<-table.element(a,i,header=TRUE)
a<-table.element(a,round(mypacf[i],6))
mytstat <- mypacf[i]*sqrtn
a<-table.element(a,round(mytstat,4))
a<-table.element(a,round(1-pt(abs(mytstat),lengthx),6))
a<-table.row.end(a)
}
a<-table.end(a)
table.save(a,file='mytable1.tab')